The Path of Future Interest Rates

The future path of interest rates is high on the list of what worries markets today. We can gain some insight by anticipating the Fed’s response to changes in the economic landscape and by looking at the pattern of yields on bonds across various maturities.

The Fed has the twin mandates of stable prices and full employment. Inflation expectations are, of course, a key consideration. After the Fed ratcheted up rates over the past two years, inflation seemed under control and a cut in the Federal Funds rate was expected. However, inflation snapped back a bit in January, putting this forecast in jeopardy, producing turmoil in markets. The Fed’s latest pronouncements are consistent with a rate cut, but further down the road once the prospects for inflation and economic activity become clearer. Thus, while the path of interest rates is for a reduction, the timing remains uncertain.

The Fed controls the short-term Fed Funds rate. Longer-term rates reflect the buying and selling by traders in the bond market, which is reflected in the pattern of yields. The observed yield is what a trader earns if the bond is held to maturity. However, there is a market in which bonds can be traded – investors do not have to hold the bond until it matures. Thus, the pattern of yields at various maturities is formed by combinations of observed and expected yields. For example, two-year yields (4.6%) include the combination of observed one-year yields (5.1%) and expected lower yields (4.2%) one year hence. Consequently, today’s pattern is telling us to expect lower rates.

While uncertainty remains, both the Fed and yields point to reduced rates ahead. We’ll see.

Market Review  

Stocks

Stock indices were up nicely in February. All but developed international markets (EAFE index), which was up 1.8%, jumped nearly 5% this month. Over the past 12 months, stock investors have been rewarded – a diversified stock portfolio earned 12%, well above historical averages. The S&P 500 12-month return of 31% stands out.

The S&P 500 continues to be driven by the results of the largest tech companies engaged in the development of Artificial Intelligence (AI). Nvidia, the premier manufacturer of chips for AI, is the poster child. Its recently reported earnings were well above market expectations producing a one-day pop of over 16% on the news. It is up 29% in February and 243% over the trailing twelve months – extraordinary results indeed.

China is about 25% of our emerging markets index and explains much of its volatility. A proxy index for China’s stock market was up 10% in February, but about flat over the last quarter and down nearly 20% over the trailing twelve months.

Bonds

Our Treasury bond indices were down from 0.3% for short-term maturities to almost 3% at the longer end in February due to rising yields. The total increase in 5-year and 10-year yields of about 0.5% is explained in equal measures by increasing inflation expectations and an uptick in the underlying cost of capital.  Over the trailing 12 months, Treasury securities maturing in the 3–5-year range earned 4.2%, a 1.4% premium above inflation (CPI).

The Price Earnings (P/E) Ratio

The P/E ratio is used by analysts to establish a company’s expected value. Multiplying either reported or projected earnings by this ratio gives an indication of this value. It provides a perspective on current stock prices.

The PE ratio is the price per share divided by earnings per share. It measures what the market pays for a dollar of reported earnings. While substantial effort is oftentimes used to project future earnings, as P/E ratios are not constant, this analysis must be done with care.

P/E ratios not only differ widely among companies, but also fluctuate significantly over time depending upon the company’s growth opportunities and the economic landscape. For example, while the P/E ratio of the S&P 500 over the past 90 years has been generally between 10 and 20 times; it has been as low as 6 times and, briefly, over 120 times. A high P/E ratio signals that a large portion of future earnings are expected to come from investment opportunities (growth).

P/E ratios for S&P 500 stocks have been increasing over the trailing 12-month period – from 22 to 26 times. Increasing P/E ratios help to explain the 21% return of the S&P 500, which is well above other market indices. Not surprisingly, the current P/E ratios of the so-called “Magnificent Seven” are above what’s typical, no doubt reflecting prospects for Artificial Intelligence (AI) – Amazon (84 times), Nvidia (82 times), and Tesla (61 times) stand out. These P/E ratios mean that the future impact of AI is a significant part of today’s stock price.

Market Review  

Stocks

Stock indices were mixed in January. Stocks traded on developed international markets were up a little less than 1% (EAFE Index) while emerging market stocks (MSCI Index) were off almost 5%. The S&P 500 Index was up almost 2% in January. This result is concentrated in stocks of just a few tech companies – the “Magnificent Seven” less Tesla that lost 30% due to a hiccup in earnings and concerns for the whims of Elon Musk.

Our emerging markets index was dragged down by losses in China and Korea, both down about 9%. These two countries make up 40% of the index. Over the past year, China was down 23%, primarily reflecting the economic turmoil from debt-financed real estate.

At their recent meeting, the Fed voted to keep the federal funds rate where it is. While the market’s initial response was negative, it has bounced back since. The current pattern of yields over the next year implies a drop of about 1% in short-term rates. However, not only is the eventual cut by the Fed uncertain, the impact on stocks depends on the extent to which any change is already imbedded in prices.

Bonds

Not much change in bond prices in January. Up a bit at the short end; down a bit for longer maturities.    The shape of the Yield Curve is currently downward sloping with short-term yields above longer-term yields, which has been the case for some time. To return to the more typical upward slope, either short-term rates must fall, or longer-term rates rise. Falling short-term yields seem more likely, but we’ll see.

Year in Review

After plenty of ups and downs throughout the year, financial markets turned in reasonable results in 2023 – a globally diversified stock portfolio was up 16%, a reasonable proxy for bonds (Barclays Aggregated Bond Index) returned 6%. News on several fronts helps to explain this year’s results:

Interest Rates, Inflation and Prospects for a Soft Landing

Throughout 2023, all eyes were on the Fed’s effort to tamp down inflation without a recession. Much uncertainty was associated with its ability to pull this off. During the year, the Fed raised its Federal Funds Target Rate by 1% to 5.5%, which seemed to have the desired effect, as the annualized change in the Consumer Price Index (CPI) fell from almost 7% to 3% by the end of the year. Unemployment remained at historical lows in a growing economy suggesting a soft landing – not the conventional wisdom at the start of the year.

Stocks responded positively. The tech-ladened S&P 500 was up over 26%; domestic small company stocks (Russell 2000) up 17%; international developed markets (EAFE Index) returned 18% and emerging markets (MSCI Index) 10%.

Bond yields fell back in response to expectations that the Fed is done raising interest rates. The yield on the closely watched 10-year Treasury Note fell over 100 basis points (1%) from its October peak. Yields are now about where they were at the beginning of the year, producing returns for Treasury securities of about 4% across all maturities.

Artificial Intelligence and the Magnificent Seven

News on Artificial Intelligence (AI) impacted financial markets positively. Amid the short-term uncertainty, it is clear the impact of AI will be profound. Domestic tech companies expected to benefit from AI, termed the “Magnificent Seven” (Apple, Amazon, Google, Meta, Microsoft, Nvidia and Tesla) representing 30% of the value of the S&P 500, were up big in 2023. An equally weighted portfolio of these stocks more than doubled over the year.

Interest rate risk and bank failures

Rapidly rising interest rates from near zero means banks are susceptible to interest rate risk by funding long-term loans with short-term liabilities. This risk explains the failures of Signature Bank and Republic Banks, as well as increased concern for the banking system in early 2023.

Political upheaval

We have endured our share of political upheaval in 2023, including the ongoing fighting in Ukraine, the brutal attack by Hamas and Israel’s response, coupled with the ongoing dysfunction of our Congress. This political wrangling and global uncertainty, plus a three-year increase in the average price of goods in the CPI of 17%, helps to explain the public perception of the domestic economy generally being worse than what’s implied by the numbers.

What’s Ahead in 2024

The beginning of a year is when we are treated to various forecasts of what’s ahead. Don’t pay any attention – no one knows. A long history of market behavior does give us a sense of what’s expected, but what’s realized is driven by surprises, both positive and negative. Market prices are the best predictor – diversification is the best way to deal with uncertainty. Take advantage of the wonders of compound interest by maintaining established commitments to several markets and avoid getting caught up in anyone’s predictions.

Investing in the “Magnificent Seven”

Now the leading high-tech companies are the “Magnificent Seven” (those of a certain age will relate). These companies – Apple, Alphabet (Google), Amazon, Meta (Facebook), Microsoft, Nvidia, and Tesla – make up about 30% of the S&P 500 index. While it is a stretch to expect an investor is lucky enough to have built and maintained an equally weighted portfolio of these stocks over the past ten years, had they done so it would have earned a compound annual return of 40% – an extraordinary result indeed. Unfortunately, investing is not done with hindsight. We can’t expect a repeat performance of the last ten years for the “Magnificent Seven.”

Realized returns depend on how an uncertain future unfolds versus what’s expected. The extraordinary past results of the “Magnificent Seven” can be explained by changing expectations for the impact of AI (Artificial Intelligence). Unfortunately, the future of AI, while no doubt profound, is probably no clearer today.

Market prices reflect the best predictions based on what is known. Any predictions that are different should be taken with a “grain of salt.” While we are faced with significant uncertainty about the future of AI, at any point in time market prices reflect this unknown future. Of course, there will be surprises — diversification lessens their impact.

Yet, it is important to participate in the risks and rewards of AI. Since the S&P 500 includes a significant commitment to the “Magnificent Seven,” holding an allocation to stocks of this index in a well-diversified portfolio meets this objective. Avoid trying to guess the future of AI by maintaining established commitments and enduring the impact of the surprises

Market Review

Stocks

Stocks snapped back nicely this month on the positive inflation news, leading to expectations that the Fed will relent on increasing interest rates. Stock market indices are all up over 8%. The November numbers are evidence of how quickly markets can turn around. I don’t recall many predictions of a turnaround at the beginning of the month.

Year-to-date returns, while variable among various markets, are all in positive territory. The 20.8% return of the S&P 500, which is dominated by the largest tech companies, is well above other stock market indices that ranged from 4% (Russell 2000) to 12% (EAFE). The jury is still out on whether these recent results are evidence of the so-called “soft landing” from the Fed’s efforts to tame inflation – but it feels better.

Bonds

Bond yields dropped in the past month, also reflecting the positive inflation news and Fed expectations.  While yields on short-term bonds stayed about where they were, longer-term yields dropped significantly producing positive returns on longer-term bonds. The yield on the bellwether 10-year Treasury fell significantly from 5.0% to 4.3%, a -0.7% drop for the month.

As the Fed embarked on its program to tame inflation, the 10-year yield has jumped a remarkable 300 basis points (3%), alarming many observers. However, it is important to note that this increase is off an unsustainable low. Yields at today’s levels are more reasonable.

Interest Rate Risk in Bonds

Rapidly rising interest rates explain bond market losses in recent periods. The Bloomberg U.S. Aggregate Bond Index, a reasonable proxy for the U.S. bond markets, is off 4% over the past three months, confirming that bonds are risky.

Bond risk is from two sources primarily – credit risk and interest rate risk. Credit risk is straightforward – it’s the chance that the bond won’t pay interest and principal as agreed. The premiums for bearing this risk change primarily in response to changes in the economy. Interest rate risk is the variability in bond values in response to changes in interest rates. Recent results reflect the impact of changes in interest rates (interest rate risk).

Interest rate risk is not the same for all bonds. It depends on its duration (years to maturity adjusted by the effect of periodic cash flows). We can see the impact of duration on bond returns by looking at recent results for U.S. Treasury indices. Securities issued by the U.S. Government, by definition, bear only interest rate risk. The 1-3 Year Index earned 1%, while the 3-5 Year Index lost 1%, and the 7-10 Year Index lost 5% over the past three months. It’s only if the bond is to be held to maturity and there are no coupon payments (Treasury Bill or zero-coupon bond) that it will earn the yield implied when it was purchased. Otherwise, there is interest rate risk.

Bonds are risky – the sources of this risk are complex. It is important that they are well understood.

MARKET REVIEW

Stocks

While showing some signs of coming back, stocks are down this month, which brings the trailing three months’ numbers to negative 3% for the S&P 500 and 12% for the domestic small cap index (Russell 2000). In this three-month period our international market index (EAFE) and emerging market index (MSCI Emerging Markets) are down 6% and 8%, respectively. A globally diversified stock portfolio is off 8% over this period.

Clearly, there has been a reduction in the appetite for risk. However, while the turmoil in the Middle East gives us more to worry about, the economy seems in good shape – unemployment is low, inflation is falling, rapidly increasing interest rates are mostly behind us, and we seem to have avoided a recession. Of course, it’s hard to be optimistic about inflation when the average price of items that make up the Consumer Price Index (CPI) has gone up 30% over the past three years. The outlook seems better and, as the past few days have demonstrated, it can become positive quickly.

Bonds

Over the last three months, yields on short-term Treasuries have not moved from the 5.5% range. After moving up significantly, longer-term yields fell back in just the last few days of the month to where they are just above where they were at the beginning of the month. Over the trailing three months, on the other hand, these yields have pushed up – the current 10-year yield of 4.7% is up from 4%. Since bond prices move in the opposite direction from yields, we can see the impact of these increases in the 3.5% loss in the 7–10-year Treasury index. The spread between nominal and inflation-adjusted yields, a reasonable measure of the market’s expectation for inflation, has remained at a little more than 2%.

Each month, the Federal Open Market Committee (FOMC) issues its position on the current economic conditions and outlook on future forecasts and projections. The main areas of focus are inflation, unemployment and interest rates. Here are a few takeaways from Chairman Jerome Powell’s press conference:


  • As predicted, the FOMC voted to hold the federal benchmark overnight interest rate at its current range (5.25% – 5.5%). They are anticipating rate decreases in 2024 and 2025. However, the Fed “dot plot” (below) shows an expectation of slower decreases than originally discussed at previous meetings (chart from Yahoo Finance).

  • Rate predictors anticipate one more hike by the end of this year. However, this is not a unanimous decision, with seven out of nineteen committee members opting to keep rates steady to finish out the year. Ultimately this decision will be driven by how the economy performs between now and the end of 2023.


  • Some of the risks affecting the outlook of the economy noted by Powell were the United Auto Workers strike, a potential government shutdown, the beginning of student loan repayment, high energy and oil prices, and increase in long-term borrowing costs. All of these factors will play an important role in the Fed’s future decision making.


  • Powell also addressed the growing frustration with inflation. Some current inflation measures remain more than twice the Fed’s optimal level of 2%. The Fed’s commitment to decreasing inflation is one of the primary reasons that interest rates currently remain steady.


  • Although most people were predicting a recession, the incoming data shows a resilient economy. Economic growth remains strong and unemployment is still close to record lows. One of the key reasons for this is demand across the US economy remains solid and consumer spending is up.


  • The updated economic projections seem to indicate a “soft landing,” even though Powell emphasizes there is still uncertainty about making it their baseline. A soft landing means the FOMC’s goal is to bring inflation down while maintaining maximum employment and ultimately avoid a recession.


Overall, the Federal Reserve is attempting to “proceed carefully” with future policy moves while attempting to combat inflation without impacting jobs. The next FOMC meeting will be held October 30 – November 1. Contact your Rockbridge advisor if you have any questions or concerns.

“Irrational Exuberance” and Market Pricing

The price of Nvidia stock, a software design and development firm that manufactures chips integral to the gaming industry and, consequently, a proxy for Artificial Intelligence (AI), skyrocketed from $142 per share on December 30 to $494 per share today – a gain of over 230%. Does this increase in value reflect irrational exuberance or the markets’ pricing of the unknown future of AI?

Unlike cryptocurrency there is substance to AI. It has the potential to profoundly impact society and the economic landscape. While exciting, much of this potential is unfolding. Market prices discount today all that is known about this uncertain future. As new information becomes available, it is quickly incorporated into prices and results in ups and downs, which can be dramatic. Today’s prices of AI stocks, especially Nvidia, gives us a hint of what market participants expect for AI. While dramatic, it can reflect “rational exuberance.”  Where these prices go from here depends on unknowns, which can be both positive and negative for AI.

MARKET REVIEW

Stocks

Stocks were down across the board this month. With little change in the outlook for inflation and economic growth, this month’s drop seemingly reflects less appetite for risk. Yields moved up, making less risky bonds relatively more attractive. While we would like to explain monthly ups and downs in stock market behavior, oftentimes it is simply random noise. Quarter-to-date results, except for the slightly negative results in the International Developed Market Index (EAFE), were positive, however.

The year-to-date numbers remain upbeat. Even after the August falloff, a stock portfolio diversified sufficiently to span global markets is up nearly 9%, led by a 19% uptick in the S&P 500, which is heavily influenced by domestic Tech companies that are primed to participate in the future of AI.

A portfolio of stocks traded in the China markets was off nearly 6% since the first of the year, a distinct outlier from other markets. This performance, no doubt, reflects the economic slowdown and the implosion of its real estate market. The significance of China notwithstanding, many analysts observe that because our trade with China is not large and our financial markets are not correlated, this slump will have a minimal effect on the U.S. economy. While China is an outsized contributor (26%) to our emerging market allocation, it represents less than 4% of our global stock portfolio.

Bonds

Yields on longer maturing bonds were up, resulting in negative returns (price reductions offsetting coupon payments). Yields on 10-year Treasuries climbed more the 0.3%. This uptick is in real interest rates, not inflation expectations, as the spread between nominal and inflation-adjusted yields has remained at a little more than 2%.

While the Yield Curve (pattern of Treasury yields across several maturities) continues to slope downward, with increasing yields at longer maturities, it has “flattened” to some extent, but still consistent with falling future interest rates. Reduced inflation expectations and an economic slowdown continue to be the popular explanations. We’ll see.

Inflation and a “Soft Landing”

Inflation expectations and the economic impact of the Fed’s ratcheting up its Target Interest Rate has been a major source of uncertainty. So far, the trajectory of inflation has been in the right direction and unemployment has remained low. The trailing 12-month change in the Consumer Price Index (CPI) has declined from its peak of 9% in March 2022 to less than 3% this month, while unemployment has remained in the historically low 3.6% range. Equity markets have responded positively. However, this good news notwithstanding, uncertainty seems to persist.

This uncertainty reflects the conventional wisdom that increasing interest rates to fight inflation means a recession. One indicator of an impending recession is a downward sloping Yield Curve (future interest rates expected to be lower). The argument here is that the Fed will have to reduce rates to pull the economy out of a recession. However, the shape could also mean lower future inflation. Interest rates typically include a risk-free rate plus a premium for expected inflation. With inflation coming down, a reduction in that premium could explain the expectation for lower interest rates implied by the downward sloping Yield Curve.

Further confounding the usual link between rising interest rates and a recession, is the extent to which inflation is embedded or transitory. The pandemic not only produced massive deficits to offset unemployment, but it also brought on supply chain disruptions. Additionally, the invasion of Ukraine drove grain prices up. While these factors seem temporary, with the recent 0.25% increase in its Target Federal Funds rate, the Fed seems committed to drive out any embedded inflationary expectations erring on the side of an economic slowdown.

What to do in the face of these uncertainties is always the same – avoid predictions, continue to rebalance to established strategic allocations, and enjoy the ups and endure the downs 

Market Review

Stocks

Stocks up nicely this quarter with returns from 3% to over 6% for small cap value stocks. Diversification helped this quarter as markets other than the S&P 500 picked up the pace. Year-to-date, however, it’s that market (S&P 500), led by the usual Tech companies (Amazon, Apple, Facebook, Google, Microsoft and Nvidia), that turned in returns better than 20%. Nvidia, perhaps the most popular way to jump on the AI bandwagon, more than doubled since the beginning of the year. Other stock markets turned in returns nearing 10% over the year-to-date period.

Bonds

Yields were up resulting in essentially flat bond returns (price reductions offsetting coupon payments) this month. This pickup in yields is consistent with the Fed’s 0.25% increase in its Target Interest Rate.

The Yield Curve (pattern of Treasury yields across several maturities) continues to slope downward, suggesting reduced yields ahead. The jury is still out as to whether this signals a future need for the Fed to reduce rates in response to a recession or reduced inflation expectations. The market’s expectation for inflation, as evidenced by the spread between 5-year nominal and inflation adjusted bond yields, remained at just above 2%. This number is consistent with the Fed’s target and a seemingly positive implication for inflation ahead.

Predicting Future Prices

If we could predict future prices for financial assets, then investing would present no problems. As Will Rogers tells us: “Don’t gamble; take all your savings and buy some good stock and hold it till it goes up, then sell it. If it don’t go up, don’t buy it.”  Unfortunately, it doesn’t work that way.

The observed market price, which consolidates the predictions of all participants from available information, is usually the best price. Because new information comes randomly, prices will fluctuate unpredictably – investors need confidence to make decisions using only observed market prices.

Instead of predicting the future, we can use past data to construct an average and, importantly, a range.  Using this description of the future allows us to consider investment alternatives objectively. Relying on predictions to make these decisions, while it can be comforting, rarely pays off.

Market Review

Stocks

Stocks were up this quarter and six months, helped by significant advances in a few large tech companies. The S&P 500, which is over-weighted by these stocks, was up almost 9% for the quarter.  Other market indices were up between 1% and 5%. The story is much the same for the year-to-date numbers. While over this period international developed markets (EAFE), domestic small cap stocks (Russell 2000) and emerging markets (MSCI emerging markets) were up a comfortable12%, 8% and 5%, respectively – they were well below the 15% return of the S&P 500. The equally weighted portfolio of the six largest tech stocks (Apple, Microsoft, Google, Amazon, Nivida and Facebook) was up 27% over the quarter and 83% year-to-date. Nvidia, a software company engaged in the manufacture and distribution of chips for AI (Artificial Intelligence) headquartered in Santa Clara, CA, is new to this group. It was up over 50% for the quarter, and has nearly doubled in value since the first of the year. These numbers tell us the market’s enthusiasm for AI. We’ll see whether it is misplaced.

The Consumer Price Index (CPI) is up 2.7% over the trailing twelve months, close to the Fed’s long-term objective. While the Fed has paused its drive to increase interest rates, inflation remains a concern and there are no declarations of victory, only discussions of the difficulty of interpreting the data. Regardless, we are in a better place than a year ago, which helps to explain the positive stock market.

Bonds – Yields Versus Returns

Over the June quarter, bond returns are negative, reflecting rising yields. The Yield Curve (pattern of bond yields for various maturities) shows a parallel shift upward of about 0.5%, which is consistent with the increase in the Fed’s Target Federal Funds rate. Bond prices (returns) move inversely to yields – yields up, prices down.

Today’s Yield Curve is unusual. The typical curve slopes upward, showing yields increasing with maturity.  The downward sloping curve we see today anticipates falling interest rates. We earn 5.4% annualized, investing for 3 months versus 4.3% for three years.

However, taking advantage of today’s short-term interest rates is not without risk, as proceeds from short-term bonds must be reinvested at an unknown rate at maturity. Today’s Yield Curve tells us this rate will be lower and in fact, one explanation (Expectations Hypothesis) of the observed shape of the Yield Curve is that you will end up at the same place by taking advantage of the higher short-term rates and “rolling over” the proceeds over three years as you would by earning the three-year rate. Market predictions of future yields are embedded in the observed Yield Curve.

Stocks

Stock markets are volatile waiting for some resolution of today’s uncertainties, which include not only the Debt Ceiling, but also the banking system, the trajectory of interest rates and the Fed’s perseverance, inflation expectations and the prospect for a recession.  Monthly stock returns are mixed – Domestic stocks are little changed; international stocks are down.  The year-to-date numbers look better driven by the largest US Tech Companies and developed international markets.  The EAFE is up 7% and the S&P 500 is up nearly 10%, almost all of which is explained by Apple, Microsoft, Google, Amazon and Facebook.

Bonds

Over the past thirty days yields for shorter-term bonds were up, especially for one-month maturities.  Yields for bonds that mature beyond two years were little changed.  The shorter-term yields shot up due to the uncertainty in the resolution of the US debt ceiling negotiations.

The yield curve continues to slope downward – usually a sign of lower interest rates ahead, which is consistent with expectations for a more accommodative monetary policy to combat a recession and reduced inflation.  The spread between 5 and 10-year nominal and inflation-adjusted yields, a reasonable measure of market expectations for inflation over these periods, remains just above the Fed’s 2% objective.

Diversification

The year-to-date stock market numbers show us some of the short-term costs of maintaining a well-diversified portfolio.  Recently large company stocks traded in both domestic (S&P 500) and international (EAFE) markets, earned returns well above those of other markets making it uncomfortable to remain committed to a diversification strategy.  Yet, it is well known that diversification increases a portfolio’s expected return without assuming more risk – a “free lunch.”

Allocations to value stocks (value effect) and stocks of small companies (size effect) have been shown to produce diversification benefits.  It is reasonable to expect premiums of 1% to 1.5% but with considerable short-term variability.  This variability is especially evident in recent periods. While over the previous three years a portfolio geared to take advantage of this value and size effect has matched the returns of broad market indices, recently it has lagged by an uncomfortable 3% margin.  However, because shortfalls will not last forever and turnarounds can happen quickly, it is important to remain committed to these markets.

Monitoring Results

Monitoring results is an important role of fiduciaries. While at first glance this process seems straightforward, it is not.  Two problems loom – (1) using short-term results to monitor long-term expectations, and (2) random noise in the data. To deal with the first problem fiduciaries construct and maintain benchmarks that reflect appropriate risk profiles.  Periodic results are measured against these benchmarks and nothing else.

The second problem means that periodic results will not always match even a well-constructed benchmark – sometimes they will be above, other times below (tracking error).  Regardless of whether positive or negative, tracking errors must be investigated, and explanations understood.

Monitoring periodic results and maintaining diversification strategies can be hard, yet is key to investment success.

Emotional decision-making fueled by fear or greed can cloud our judgment and lead to irrational investment choices. Reacting to short-term market fluctuations or making impulsive trades based on attention-seeking headlines often leads to poor investment performance. By staying in your seat and focusing on your long-term investment strategy, you can mitigate the influence of emotions.

A disciplined investment strategy is designed to withstand market fluctuations and align with your long-term goals. Deviating from your strategy based on short-term market movements and the constant barrage of headlines can disrupt your financial plan and hinder your progress toward achieving your financial objectives.

2023 has been a year filled with recurring pessimistic headlines, tempting investors to revisit their investment strategy and take money out of the market. The Philadelphia Federal Reserve’s survey-based Business Outlook suggests some manufacturers have a very pessimistic expectation of the economy. The index is more negative than at any time since the onset of the Covid pandemic and on par with the Global Financial Crisis in 2008. In general, negative spikes in this index have closely aligned with economic downturns. But investors shouldn’t let this ominous sign deter them from stocks.

Since the index’s start in May 1968, the outlook was negative in 165 out of 648 months. The return of the S&P 500 Index over the next 12 months was positive for 76% of these 165 observations. To put that in perspective, the frequency of positive S&P 500 returns over any 12-month span during the period was 78%. And the average magnitude of the return following negative months, 13.4%, was higher than the unconditional average of 11.5%. Just another reminder that markets price in changes in economic states before they come to fruition.

The below chart from JPMorgan Chase tracks the Consumer Sentiment Index at its peaks and troughs and compares how the S&P 500 performed in the 12 months following. On 8 separate occasions since 1971, the Consumer Sentiment Index has been recorded as in a trough, the average S&P 500 index return for the 12 months following that trough was +24.9%. Comparatively, on 9 separate occasions when investor confidence was high and the Consumer Sentiment Index was documented as a peak, the average S&P 500 index return for the 12 months following that peak was just +3.5%.

Historically, disciplined investors who resisted the urge to react to pessimistic headlines have allowed their investments time to capitalize on market recovery and minimize transaction costs and taxes. Remember, successful investing requires patience, discipline, and a focus on the long term.

Stocks

Large cap stocks, traded in both international and domestic markets, were up in April; emerging market stocks and stocks of small companies, on the other hand, were down. Year-to-date stocks produce positive returns that range from 1% in small cap stocks to almost 12% for developed international markets. Year-to-date stocks have performed reasonably well with a globally diversified stock portfolio, earning 4%.

Bonds

Since the beginning of the year bond yields were up at the short end, but down across maturities beyond 90 days, resulting in positive bond returns (bond prices move inversely with yields). The pattern of yields across various maturities peaks at three-months and falls off steadily before beginning to move up at about ten years. This shape is consistent with expected lower interest rates, which might be explained by the Fed “taking its foot off the gas,” lower expected inflation, or an expected economic slowdown – take your pick. The spread between nominal and inflation-adjusted five-year yields, a reasonably good indication of expected inflation over that period, stayed at about 2.5%.

Uncertainty

The trajectory of inflation, the path of interest rates, expectations for a “soft landing,” the banking system and a looming debt ceiling are some of the sources of uncertainty today. While we can be concerned about what inflation has been, current numbers tell an improving story – the Consumer Price Index (CPI) was flat for the month and under 1% year-to-date. The Fed seems to be committed to keeping interest rates high. However, keeping them there too long and triggering a recession is a worry. While there could be surprises ahead, markets seem to be taking today’s unknowns in stride. We’ll see.

The Wonders of Compound Interest

Einstein referred to compound interest as the eighth wonder of the world! He went on to say: “he who understands it – earns it, he who doesn’t – pays it.” To profit from compound interest investors must establish and maintain commitments to risky markets through thick and thin. It is especially important to avoid the common urge to move into the asset class with the best recent results. While diversification means always looking back with regret from commitments to some markets, the fruits of compound interest come from enduring this short-term regret and looking ahead.

The wonder of compound interest lies in its ability to turn small amounts into significant sums over time (playing golf for $1.00 that doubles every hole means playing the 18th hole for more $260,000!). It is the process of earning interest on both the principal amount and reinvested interest that accumulate over time. It means that the longer the portfolio is left untouched, the more it will grow due to this compounding. It is a powerful tool to leverage time to achieve investment goals and weather market volatility.

Investors seeking to build wealth know they must endure risk to achieve growth. Maintaining a diversified portfolio throughout the inevitable market ups and downs is the best way to navigate an uncertain path to growth and realize the wonder of compound interest.

Stocks

After enduring ups and downs due to the uncertainty in the financial system and the Fed’s response triggered by the collapse of Silicon Valley and Signature banks, stocks ended the first quarter in positive territory. Domestic large cap stocks, International developed markets and emerging markets were up between 4% and 8%, small cap stocks and REITs up just under 3%. Over the trailing twelve months, on the other hand, except for International developed markets, stocks were down significantly because of rising interest rates and inflation uncertainty.

While the past year was not kind to stocks, the story has been mostly positive over longer periods. The past three years saw a portfolio diversified among several markets earning about 15%. Although with considerable variability among individual markets, a diversified stock portfolio earned about 4% and 7% over the last five and ten years, respectively.


Bonds

Recent turmoil in the banking system drove bond yields down, especially for longer maturities. Since prices move inversely to yields, this downward trajectory in yields pushed first quarter bond returns up between 1.5% and 2.8% depending on maturity. The Yield Curves below show the extent to which yields have climbed since March 2022. The primary culprit is the Fed increasing its Federal Funds rate to dampen inflation. While yields fell back a little this quarter, with the recent 0.25% increase in the Federal Funds rate, the Fed seems committed to keeping rates high for the immediate future.

The spread between nominal- and inflation-adjusted five- and ten-year yields, which is a reasonable measure of the market’s expectation for inflation over these periods, is close to the Fed’s inflation target. The shape of the yield curve can be a harbinger of future interest rates – today’s downward sloping shape implies reduced rates ahead. These signals are positive for future inflation.


Failure of Silicon Valley and Signature Banks

The turmoil in banking brought on by the collapse of Silicon Valley and Signature Banks has not only unsettled markets, but also increased uncertainty in the financial system associated with rapidly rising interest rates and the fight to dampen inflation. These two banks failed because after being accustomed to low interest rates, management lost track of the impact of rising interest rates on bond values. It was surprised by the prices at which its bonds had to be liquidated to meet unanticipated depositor withdrawals, causing sharp losses and eventual failure.

Further exacerbating this interest rate risk, these banks had a concentrated base of large depositors. In response, the Fed has stepped in to protect all depositors. While this intervention has lessened the impact of this crisis, the extent to which it creates a moral hazard that distorts future economic decisions is a downside.

While the implications of the failure of these two banks appear to be well-known and somewhat manageable, it brings heightened uncertainty, not only in the banking system, but also with the Fed’s continued resolve to squeeze out inflation, the availability of credit and economic activity going forward. While the market has absorbed this uncertainty reasonably well so far, we can anticipate continued market volatility.

Stocks

All stock markets were down In February no doubt reflecting the ongoing uncertainty of rising interest rates, inflation and an economic slowdown.  With its 0.25% increase in its Federal Funds Target Rate, the Fed continues to signal its commitment to rein in inflation.  While Consumer Price Index (CPI) increases are looking better recently, no one is declaring victory.  How far the Fed will go with increasing rates and whether it will trigger a recession remains uncertain.  Not only does this uncertainty impact stocks negatively, but also Increased interest rates reduce the present value of future cash flow and stock prices generally.

This ongoing uncertainty helps to explain losses in domestic large cap (S&P 500), small cap (Russell 2000) and international developed markets of about 2% this month.  Emerging markets were off nearly 4%. After a pretty good January, these February results brought the quarter-to-date returns in a global stock portfolio to under 5%.  While short-term stock returns are unpredictable, continued volatility remains a safe bet.

Bonds

Yields for Treasuries maturing beyond a year, yields were up 0.05% in February pushing prices down. An index of 3-to-5-year Treasury securities was off 2% in February.  An index of shorter maturing Treasures was off a little less than 0.1% while those maturing in 7-to-10 years were down over 3%.

While the future path of inflation is far from clear, market predictions over 5- and 10-year periods obtained from the spread between nominal and inflation adjusted yields has remained relatively constant at about 2.5%, which provides some comfort that inflation may be short-lived.  We’ll see.

The Value Premium

After trading at significant discounts in recent years, over the most recent twelve months an index of domestic large cap value stocks traded at a premium of 8% to the S&P 500.  These results prompt an examination of the persistence of value premiums.

Stocks are often divided into two categories – “growth” and “value”.  Expected cash flows from growth stocks reflect future investment opportunities and a steeper trajectory, expected cash flow from value stocks, on the other hand, are from assets in place, and consequently the slope is flatter and more immediate. Growth stocks are distinguished by higher price to earnings (P/E) ratios, value stocks by lower PE’s and higher book to market ratios.  Value investing goes back to 1934 with the publication of Benjamin Graham’s “Security Analysis – Warren Buffett is a disciple.  Metrics that distinguish growth and value stocks are used to build indices and allow us to measure value premiums in past data.

Using indices published by Russell and MSCI we observe an average 1% premium in domestic small cap and international market indices.  We don’t see an average premium in domestic large cap market in Russell indices.  However, an annual average value premium that exceeds 2% with greater volatility is present using the so-called “pure value index” published by Standard & Poor’s. While there is evidence of a value premium over the long run, taking advantage means accepting volatility.

Stocks

Stocks continued to climb in January, with small company and non-domestic stocks earning between 8% and 10% leading the way.  Domestic large cap stocks (S&P 500) returned 6% for the month somewhat less than other markets, which is a change from recent history. A globally diversified stock portfolio was up 8% for the month and 14% over the trailing quarter. International developed markets and emerging markets were up 8% this month and 19% over the trailing quarter reflecting to some extent the decline in the value of the dollar.  These recent numbers demonstrate the benefits of diversification to non-domestic markets.

Bonds

Except for an up-tick in one-month maturities, short-term bond yields did not move much in January.  Yields on longer maturing bonds (beyond two-years), on the other hand, fell a bit resulting in positive returns.  An index of U.S. Treasury securities maturing in 1 – 3 years returned 0.7% in January; the 3 – 5-year index earned 1.7%. Over the trailing 90 days, the shorter-term index posted a 1.8% return; longer-term index returned 3.6%.  These results are significantly better than what we experience the past twelve months.

Inflation as measured by changes in the Consumer Price Index was flat for the month and trailing quarter.  Over the training twelve months the change was 5.7%, well below 8.7% we saw in March 2022.  The spread between 5-year nominal and inflation-adjust yields, a reasonable measure expected inflation over the period, is 2.3% – not far from the Fed’s goal.

A “Soft Landing”?

Since January 2022 the Fed Funds rate increased from 0.25% to 4.5% reflecting the Fed’s effort to dampen inflation.  The goal is to do this without a significant economic slowdown that often accompanies interest rate hikes.  Markets are forward looking.  While surprises could be lurking, generally market signals anticipate a “soft landing” – stocks are up, bond yields look reasonable, and labor markets are robust for now.

Signals from stock markets are positive.  Last quarter and this month stock returns are up with relatively low volatility.  While these markets can change quickly, current prices do not reflect a significant downturn.

Bond market signals are mixed. Current bond yields are constant at 4.7% over the next year but decline to 3.7% at five years. This downward shape of the Yield Curve can be a predictor of recessions as it suggests a future need for the Fed to reduce interest rates to spur growth.  Yet, expected future interest rates (roughly 3%) implied by today’s pattern of yields do not anticipate a need for massive changes in monetary policy.

Current signals from the labor market are positive.  Unemployment levels and rates are about where they were prior to the Pandemic and much anecdotal evidence suggests difficulty in hiring. While the current spate of announced layoffs in large Tech companies is unsettling, labor markets do not seem poised for a sharp recession.

While there is always room for uncertainty, current signals from stock markets, bond markets and labor markets point to any future recession being reasonably mild – a “soft landing”.

Earlier this week we put out a summary of some of the changes that individual investors should be thinking about as a result of Secure Act 2.0 going into law. This article focuses on the changes that we think will be impactful to business owners going forward:

1) Small Business 401(k) Credits: For businesses with 50 employees or less, the credit for starting a new 401(k) plan has been adjusted from 50% to 100% of plan startup costs, up to $5,000/year for the first three years. There will also be a new tax credit starting in 2023 for employer contributions to employee accounts that earn less than $100,000, up to $1,000/employee. For the first two years of a new planning being established, the credit is 100% of employer contributions. Year three uses 75%, year four uses 50%, and the fifth year uses 25%. After five years of having a plan open, the credit goes to 0%.

2) Auto Enrollment and Escalation: For 401(k) and 403(b) plans established in 2023 or later, new employees must be auto enrolled in the employer’s plan, at a 3% minimum contribution amount. From there, the contribution amount will be increased by 1% per year until it reaches 10%, at which point the employer has discretion to limit contributions to 10% or continue increasing contributions up to a cap of 15% of the employee’s income.

3) Roth Catch-Up Contributions: For employed individuals over age 50, and with wages of $145,000 or more, catch-up contributions to an employer sponsored retirement plan must be made in Roth dollars starting in 2024. While having a Roth component has become a common feature for 401(k) plans over the years, there are still plans out there that haven’t made this change. As an employer/business owner, it will be important to make sure your plan has this feature for highly compensated employees over the age of 50.

4) Solo 401(k) Start Date: For the 2022 tax year and prior, if someone opened a solo 401(k) after the end of the calendar year, but prior to their tax filing deadline- they would still be out of luck for making employee contributions to the plan. Starting with the 2023 tax year, this is no longer the case. As long as your account is open prior to your tax filing deadline, you’ll be able to make your employee contribution for that tax year.

5) Roth Matching Contributions: Prior to Secure Act 2.0, all matching contributions in employer sponsored retirement plans had to be made pre-tax. Going forward, employees can opt to have their matching contributions be made as Roth contributions. Employers making nonelective contributions to their employees can also now do so in Roth dollars. However, these employer contributions can’t be subject to a vesting schedule and will be reported as income to the employee for taxation purposes.

6) Student Loan Matching: Starting in 2024, employers will be able to make matching contributions to their employees on the basis of how much they’re paying in student loans. For example, if a company offers a 100% match on up to 3% of employee contributions- if an employee can prove they’ve contributed 3% of their income to student loans, the employer can still provide the match. However, this provision will not be a requirement by the employer, but it will be subject to nondiscrimination testing to ensure that not only the business owners/highly compensated employees get this benefit.

7) Roth Simples & SEPs: SIMPLE & SEP IRA plans have always been pre-tax savings vehicles for small businesses and self-employed individuals. Starting in 2023, Roth contributions will be allowed in both of these plan types.

8) Simplifying Hardship Withdrawals: Starting in 2023, employees will have the ability to self-certify that their need for taking a distribution falls into one of the approved categories. Formerly, the plan administrator (typically the employer or someone who works at the company) would have had to sign off their approval for the reason. Hardship withdraws can also be taken out of employee AND employer contributions starting in 2024. Prior, only employee contributions have been eligible for these types of distributions.

Again, this isn’t a complete list of all of the changes brought forward by Secure Act 2.0, but a good starting point in terms of things that business owners might need to start thinking about. If you have questions about how any of these provisions might impact you, contact your Rockbridge advisor.

Just before the close of 2022, Congress passed a $1.7 trillion government spending bill. Within that 4,000+ page document was Secure Act 2.0, which introduced ~90 new provisions regarding retirement savings. We’re tracking the details of this bill as additional information becomes available, but here are some of the highlights for individual investors:

1) New RMD Age: Starting in 2023, the age for Required Minimum Distributions from retirement accounts will increase to 73. Individuals who have already started taking RMDs, will not be impacted and you will still be required to take your RMD in 2023. For those who turn 72 in 2023, you now have an extra year before you need to start taking your RMDs. An additional provision in the bill is to further increase the RMD age to 75, starting in 2033.

2) Roth Catch-Up Contributions: For employed individuals over age 50, and with wages of $145,000 or more, catch-up contributions to an employer sponsored retirement plan must be made in Roth dollars starting in 2024. This means that your catch-up contribution will be made using after-tax dollars and will no longer be deductible.

3) Employer Plan Catch-Up Amounts: Secure Act 2.0 is also adding a new age group for catch-up contributions starting in 2025. For employees aged 60-63 who participate in a 401(k) plan, you’ll have the ability to contribute the greater of $10,000 or 150% of the “standard” catch-up contribution for 2024. The standard catch-up for 401(k) participants age 50+ in 2023 will be $7,500. Simple IRA plans have a similar provision that will allow for catch-up contributions of $5,000/year for ages 60-63, up from $3,500 for participants aged 50+.

4) IRA Catch-Up Amounts: While catch-up amounts in employer sponsored retirement plans like 401(k)s have been indexed to inflation, increasing steadily over the years, IRA catch-up amounts have remained stagnant at $1,000 for those aged 50+. Starting in 2024, IRA catch-up contribution amounts will also be indexed to inflation.

5) Employer Matching Student Loans: For a lot of young professionals just starting their careers after college, you have the tough choice of deciding between paying down student loans or contributing to your employer retirement plan. Going forward, Secure Act 2.0 will allow your employer to put “matching contributions” into your work retirement plan in the amount in which you’ve paid down your student debt for the year. This is not required, but it might be worth having a conversation with your employer if you fall into this situation.

6) Retirement Savings Lost and Found: Within two years, the Department of Labor will establish an online data base for retirement plan participants and/or their beneficiaries. If you ever have difficulty finding a retirement account from an old employer, or finding a retirement account as a beneficiary, this service will help simplify the process.

7) Auto Enrollment and Escalation: For 401(k) and 403(b) plans established in 2023 or later, new employees must be auto enrolled in the employer’s plan, at a 3% minimum contribution amount. From there, the contribution amount will be increased by 1% per year until it reaches 10%, at which point the employer has discretion to limit contributions to 10% or continue increasing contributions up to a cap of 15% of the employee’s income.

This isn’t an exhaustive list of all of the changes brought forward by Secure Act 2.0, but a summary of the ones that we think will have the largest impact on the individuals we work with. If you have questions about how any of these provisions might impact you, contact your Rockbridge advisor.

Stock buyback have been getting negative press lately. The recently signed Inflation Reduction Act calls for a 1% excise tax on these transactions. Many proponents of this tax hope it will dampen the enthusiasm for stock buybacks.  It is not clear why.

Stock buybacks are a legitimate technique for value maximizing managers to distribute excess cash to shareholders. Cash is a nonproductive asset. Theoretically, if a firm has productive uses for cash, it should undertake them, if not, surplus cash should be distributed to shareholders.  This excess cash could come from a reduction in taxes.  If there are no good uses in the company for this cash, a stock buyback is a legitimate way to return it to shareholders.

Stock buybacks do not create value – fewer shares are offset by reduced cash.  Repurchasing shares that are priced in a well-functioning market is a “zero-sum” transaction.  Observed increases in stock price might reflect reduced tax rates, signaling new information, or other factors but not buybacks per se. It is not productive for management to keep unnecessary cash in the company to avoid criticism of a stock buyback.

The Federal Reserve has significantly altered their guidance in the last few months. The biggest change is the increase in the expected number of rate hikes this year. In December, the Fed was expecting three rate hikes in 2022. Three weeks ago, they increased that forecast to 7, and the market is now expecting 8. In 2022, that means short-term interest rates could increase from 0.12% to 2.12%.

The Federal Reserve has a “dual mandate.” The two things they are focused on are keeping the population at full employment and keeping inflation in check. Economists generally view full employment as an unemployment rate of 5% or lower and the Fed targets long-term inflation as 2%.

The rate hikes are expected to be modestly harmful to asset prices and represent action meant to cool an economy that is overheating. There is good reason for this; in March, the unemployment rate dropped to 3.6%. At the same time, the Federal Reserve is expecting inflation of 4.3% for 2022.

What does that mean for us?

Higher Short-Term Interest Rates: Remember a few years ago (2018) when you could actually get some return from a high-yield savings account or a 1-year CD? That’s expected to come back. A year from now we should see yields north of 2%. If the Fed’s longer-term expectations are realized, by the end of 2023 these numbers will be around 2.75%.

Higher Mortgage Rates: Much of this change has already happened. Six months ago, the average 30-year mortgage rate in the US was 3.0%; it now sits at 4.7%. We expect this to either reduce the rate at which home prices are increasing or cause a decrease in prices. This 1.7% increase means the annual mortgage cost of a $400,000 loan is now $4,700 higher.

Lower Realized Returns, but High Expected Returns: So far this year, we’ve seen stocks and bonds both decrease in value. The aggregate bond market is down 6.0%, and both US and International Stocks are down 5%. That’s the bad news, the good news is that expected returns are now higher! Over the last three months, the yield on bonds has gone from 1.5% to 2.5% – that’s a big deal! The math behind stocks isn’t as clean, but some of the price movement this year has come from higher discount rates which is another word for expected returns. Over the last quarter, our internal model has increased long-term expected equity returns by 0.50%.

Rockbridge is excited to welcome Adam Gagas, Sharon Craig, and Jodi DeAugustine of Disciplined Capital Management (DCM) to the Rockbridge team. Rockbridge and DCM decided to consolidate businesses and advisory teams this past October. The combination is a natural fit because the two firms share a common heritage and investment philosophy that dates back three decades to the advisory firm formed by Bob Ryan and Craig Buckhout, originally called Disciplined Capital Management.

In recent years DCM has focused on advising institutions, endowments, and non-profit organizations in the Central New York region and beyond. The combination adds an institutional advisory arm to Rockbridge. Adam Gagas will lead the new Rockbridge institutional team and add valuable expertise to our investment committee.

The integration of DCM into Rockbridge creates a diverse and experienced team of investment professionals that broadens our depth and breadth of service, allowing us to help even more clients achieve their investment goals. Please join us in welcoming Adam, Sharon and Jodi to the Rockbridge team!

As we head into a new year and with it, a new tax season, we wanted to draw attention to a number of scams and schemes to defraud unsuspecting taxpayers. We think it is important that our clients be aware of how these scams work, and what precautions you can take to protect yourself.

How the Scams Work:

One popular method for defrauding taxpayers is to steal their identity using “phishing” techniques, or malware to obtain their victim’s personal information. Phishing scams use fake emails or website links designed to appear to be legitimate. Once accessed these fake links will either ask for information or potentially even infect your computer with software allowing the fraudsters to access personal information.

Recently identity thieves have used this stolen information to file fake tax returns, but using the taxpayer’s actual bank account to deposit the fraudulent refund. Once the refund has been deposited, they will call the taxpayer posing as an IRS agent, debt collector, or law enforcement and demand that the refund be returned.

Taxpayers who receive the refunds should follow the steps outlined by Tax Topic Number 161 – Returning an Erroneous Refund. The tax topic contains full details, including mailing addresses should there be a need to return paper checks. By law, interest may accrue on erroneous refunds.

Telephone scams are another popular way criminals look to defraud taxpayers. These scams involve callers contacting taxpayers claiming to be IRS representatives. The victims are told that they owe the IRS money and that the amount must be paid immediately using either a gift card or wire transfer. Callers posing as the IRS will often become hostile or insulting, and threaten the victims with arrest, suspension of a business or driver’s license, or even deportation if they do not pay. If the phone is not answered, the thieves may leave an urgent callback message.

Scammers do not just operate during tax season. Thieves posing as IRS agents have targeted parents and students during the summer and back-to-school months, by calling and demanding payment of a fake “Federal Student Tax,” or some variation thereof. Just like in the telephone scams previously discussed, these callers will demand payment via gift card or wire transfer, and will threaten to report the student to the police to be arrested if payment is not made.

These are just a few of the most popular scams thieves have engaged in to attempt and defraud innocent taxpayers, and new techniques and tactics are being developed all the time. With that said you can protect yourself by taking the following precautions.

Know What the IRS Will Not Do – The IRS will never:

  • Call to demand immediate payment using a specific payment method such as a prepaid debit card, gift card or wire transfer. Generally, the IRS will first mail a bill to any taxpayer who owes taxes.
  • Threaten to bring in local police, immigration officers or other law-enforcement to have you arrested for not paying. The IRS also cannot revoke your driver’s license, business licenses, or immigration status. Threats like these are common tactics scam artists use to trick victims into buying into their schemes.
  • Demand that taxes be paid without giving the taxpayer the opportunity to question or appeal the amount owed. You should also be advised of your rights as a taxpayer.
  • Ask for credit or debit card numbers over the phone.

Know What the IRS Will Do:

  • Contact you through regular mail delivered by the United States Postal Service. If there is an issue with your tax return, the IRS will issue you a tax “notice” informing you of the issue.
  • Call or come to your home or business. The IRS may call or send an agent to your home or business, but only in special circumstances such as when a taxpayer has an overdue tax bill, to secure a delinquent tax return or a delinquent employment tax payment, or to tour a business as part of an audit or during criminal investigations.

Know Who to Contact:

  • Contact the Treasury Inspector General for Tax Administration to report a phone scam. Use their “IRS Impersonation Scam Reporting” web page. You can also call 800-366-4484.
  • Report phone scams to the Federal Trade Commission. Use the “FTC Complaint Assistant” on FTC.gov. Please add “IRS Telephone Scam” in the notes.
  • Report an unsolicited email claiming to be from the IRS, or an IRS-related component like the Electronic Federal Tax Payment System, to the IRS at phishing@irs.gov.

The bottom line is that if you are contacted by someone claiming to be from the IRS DO NOT give out sensitive information over the phone or via email. If the call does not feel right, hang up and contact the IRS at 800-829-1040, or your Rockbridge advisor.

Every year the IRS reviews a variety of retirement plan contribution limits and other important fiscal boundaries.  Here’s a list of changes made effective January 1st, 2022.

Item 2021 2022
401(k) Employee Max $19,500 $20,500
401(k) Catch Up $6,500 $6,500
401(k) Total Max $58,000 $61,000
HSA (Individual) $3,600 $3,650
SIMPLE IRA $13,500 $14,000
SIMPLE IRA Catch Up $3,000 $3,000
Wages Taxed by Social Security $142,800 $147,000
Traditional/Roth IRA Max $6,000 $6,000
Traditional/Roth IRA Catch Up $1,000 $1,000
Roth Income Limit Single $125,000 $129,000
Roth Income Limit Joint $198,000 $204,000
Standard Deduction Single $12,550 $12,950
Standard Deduction Married $25,100 $25,900
Standard Deduction Both Over 65 $27,900 $28,700
Annual Gift Exclusion $15,000 $16,000
Medicare Part B Premiums $149 $170

As you can see, some changes were more drastic than others. For example, the Medicare Part B premium rose by 14.5%, while other line items didn’t change at all, such as the contribution limits to Traditional/Roth IRA’s (still $6,000).  All standard deductions increased slightly as did employer 401(k) and SIMPLE IRA contribution limits.

If you’re curious as to how these changes might impact your financial plan, please contact your Rockbridge advisor.

We are happy to announce we have joined 34 other Advisory firms from around the country who are labeled “Best Financial Advisors for Physicians” by the White Coat Investor.

Who is the White Coat Investor? Jim Dahle is a practicing emergency physician in Utah. After several bad experiences with financial professionals, he developed a passion for personal finance. He spent much of his free time over the next several years learning about personal finance and how it applies to doctors. Eight years after Medical School he started the White Coat Investor Blog which has developed a large following, especially among younger doctors. Jim’s mission is helping to ensure his peers don’t suffer the same fate he did, being sold an inappropriate whole life policy, buying mutual funds with sales commissions, and receiving generally poor financial advice early on in his career.

What are the criteria for becoming a Recommended Advisor? The White Coat Investor estimates at least 80% of doctors should use a financial advisor. However, there are only a small percentage of those calling themselves “financial advisors” who provide good advice at a fair price. The ones he recommends adhere to the same fee-only fiduciary model Rockbridge has been championing for 12 years. Recommended Advisors follow disciplined, evidence-based, investing. They don’t try timing the market, they don’t push high-cost active management, and they don’t sell products. Instead, Recommended Advisors provide quality investment management, emphasize financial planning, and charge less than the industry average. It makes perfect sense Rockbridge would be on the list.

What can I expect from Rockbridge going forward? We will continue to be the best financial partner we can as you embark on your journey through life. From our experience working with over 100 providers in Syracuse and beyond we understand what is and isn’t unique about being a doctor, dentist, PA, or NP.

If you haven’t spoken to your advisor recently or have a friend who you think could use your help, please reach out. We think we’re a great option for those seeking financial advice and it’s comforting to know experts in the industry, like the White Coat Investor, agree.

Tax planning is all about identifying opportunities that arise because of changes to a person’s tax situation from one year to the next. Many people think they do not need to consider tax planning because the information on their tax return does not change much year-to-year. Since the end of 2017, at least six new laws have been enacted with provisions affecting the tax code – meaning, the tax situation for many people has changed, if only due to an act of Congress.

The Tax Cuts and Jobs Act (TCJA), which was signed into law at the end of 2017 brought about sweeping changes for businesses and individuals. Since then, additional bills such as the SECURE Act, Disaster Act, CARES Act, FFCR Act and the American Rescue Plan have further changed the tax rules (and therefore the planning) for businesses and individuals.

Just in case you thought keeping up to date with the actual law on the books was difficult; there are currently several proposed bills that suggest even more, changes may be right around the corner. As recently as May, revenue raisers discussed as part of the American Jobs Plan and American Families Plan, could greatly impact the tax treatment of capital gains, gifts made to individuals and trusts, and various business tax provisions affecting small business owners, among others.

Additionally, the Setting Every Community Up for Retirement Enhancement (SECURE) Act, which was enacted into law in 2019, maybe the most significant piece of retirement legislation since the Pension Protection Act of 2006. Under the SECURE Act, retirees can now wait until age 72 before they are required to take minimum distributions (RMDs) from their retirement accounts. The new law also changed the distribution options that beneficiaries have when they inherit a retirement account. But the fun doesn’t stop here – there is new legislation before the House of Representatives, dubbed SECURE Act 2.0, that would go even further in changing the rules around retirement accounts.

Staying current on all of these new and complex rules can seem daunting, especially since the changes that are most impactful to someone’s financial plan often do not make headlines. Even when a particular legislative change is well known, it may be unclear how or if it affects you.

An important part of our jobs as advisors is to stay informed on recent and proposed legislation that impacts the advice we give to our clients. We do not know what specific legislative changes we will get in the future – but we will be following the available guidance closely. So if you ever wonder how the “insert latest proposed bill here” affects your situation, all you need to do is ask!

The American Rescue Plan Act of 2021 is now a done deal. Among the items of greatest interest to most Americans is a third round of stimulus checks – or IRS “recovery rebates” – of up to $1,400 for every “eligible individual.”  That’s the quick take. But what’s the fine print?

How Much Will You Receive?

Each eligible individual in your household should receive $1,400. Eligible individuals include:

  1. You, as an individual taxpayer
  2. Your spouse (if you are filing a joint tax return)
  3. Any dependents you are claiming on your tax return, regardless of their age

For example:  A married couple filing jointly and claiming three dependents on their tax return would be eligible for $1,400 x 5 = $7,000. This is the case even if the dependent is, say, an adult child in college, or a parent in assisted living.

The catch? Whether you receive a full, a partial, or no rebate depends on your Adjusted Gross Income (AGI) on your tax return:

All this begs the question:  Which AGI are we talking about? Technically, the stimulus payment is a 2021 Recovery Rebate. But like our Great American Pastime (baseball), you actually get up to three “at bats,” or years in which to qualify for a full or partial rebate.

Pitch #1:  Your 2019 or 2020 Tax Return, Already Filed

Initially, the IRS will look at the AGI reported on the most recent tax return you’ve already filed, whether that’s your 2019 or 2020 return. If your AGI falls within the “full rebate” parameters above, you can expect to receive your full 2021 Recovery Rebate. Where will the money go? If the IRS has a checking account on file for you, they should be able to issue a direct deposit into that account. Otherwise, they should mail you a check or debit card to your address on file.

Note:  Even if you end up reporting higher income in subsequent years, you will get to keep the full amount of any payment you receive from Pitch #1. The IRS will not come after you, asking for you to pay it back.

Pitch #2:  Your 2020 Tax Return, To Be Filed

What if you’ve not yet filed your 2020 tax return, but your 2019 income was too high to qualify you for a full rebate? Good news:  You get another chance once you file your 2020 return. At that time, the IRS will perform an “additional payment determination.” If your 2020 return qualifies you for a higher rebate than your 2019 return did, the IRS will essentially send you the difference, again via direct deposit or mail. You could receive:

  • A full or partial payment:  If you received nothing based on your 2019 return, but you now qualify for one or the other based on your 2020 income.
  • A second partial payment: If you already received a partial payment, but you now qualify for more based on your 2020 income.
  • Nothing: If your AGI is still too high to qualify.

Note:  To qualify for an additional payment determination, be sure to file your 2020 tax return on a timely basis, extended to May 17,2021.

Pitch #3:  Your 2021 Tax Return

What if neither your 2019 tax return nor your 2020 return qualify you for a full rebate? You still have one more chance. If your 2021 income is low enough to qualify, you will be able to file for a credit on your 2021 tax return for any amounts not already received.

Additional Ideas:  What’s a Taxpayer To Do?

You may have noticed, the range for receiving a partial payment is very narrow, which means fewer taxpayers will fall into it. Most of us will either qualify for a full rebate … or none at all.

If you do fall into the partial-rebate range, the amount you’ll receive will be calculated based on a straight percentage.

For example:  A couple filing jointly with no dependents reports an AGI of $155,000, smack in the middle of the $150,000-$160,000 range. This means half of their rebate will be phased out. Instead of receiving $1,400 x 2 = $2,800, they’ll receive half of that, or $1,400.

Also, the squeaky-tight gap between receiving a full payment versus nothing at all means a little tax planning could go a long way between now and year-end. Especially if your annual income is close to qualifying you for a recovery rebate, we should touch base soon to explore any 2020 or 2021 tax-planning opportunities that may help. Even if your income falls well within the “yes” or “no” recovery rebate ranges, please let us know if we can address any additional questions or comments. It’s what we’re here for!

Lockheed Martin announced a change to their current 401(k) plan lineup.  Aside from some funds being renamed, the major changes are:

  • Retiring the Global Real Estate Fund. This eliminates exposure to REIT’s in the plan unless you invest in a Target Date Fund
  • Retiring the Emerging Markets Indexed Equity Fun. This change eliminates exposure to Emerging Markets as a separate asset class, and they will be combining International Developed and Emerging Markets exposure in one fund, to be titled “Global Ex-US Equity Index Fund”

We view this change as favorable to the younger, less sophisticated investor as the options are simplified and streamlined.  However, there are less options available for the clients we build custom 401(k) portfolios for.

The Senate just approved the Paycheck Protection Program Flexibility Act. The Bill, which was passed by the House on May 28th, will ease many of the restrictions on how businesses must use PPP funds in order to have their loan forgiven.

In addition to extending the deadline to apply for a PPP loan from June 30th to December 31st, the Flexibility Act made achieving loan forgiveness easier in the following ways:

  • Congress extended the period over which businesses must use loaned funds for qualified expenses, from 8 weeks to 24 weeks. Those who received loans prior to this Bill may keep the current 8-week time period.
  • The Bill removes the requirement that at least 75% of PPP funds be used for payroll costs. Instead, 60% must go to payroll costs, and the remaining 40% of loan funds may be spent on mortgage/rent payments or utilities.
  • Previously, businesses that were forced to lay off employees, or reduce their salary by more than 25%, between February 15th and April 26th had until June 30th to hire them back, or restore their compensation level, to qualify for full loan forgiveness. The Bill now gives employers until December 31, 2020 to restore their workforce without penalty.
  • Businesses that can document their inability to fully restore their workforce by December 31st, or their inability to return to the same level of business activity because they were complying with Federal COVID-19 safety, sanitization or social distancing guidelines.

Other modifications made under this Bill include changing the minimum loan maturity period from 2 years to 5 years, for loans that will not be forgiven. Also, borrowers may defer loan payments (interest and principal) until the amount of their loan forgiveness is paid by the SBA to the lender. Businesses that do not qualify or apply for loan forgiveness may defer payments for 10 months after the program expires.

Another significant provision of the Flexibility Act is that it allows companies that took a PPP loan to be eligible for payroll tax deferral under the CARES Act. This provision allows taxpayers (including the self-employed) to defer paying the employer portion of certain payroll taxes through the end of 2020, with all 2020 deferred amounts due in two equal installments, one at the end of 2021 and the other at the end of 2022.

Unfortunately, one issue the Flexibility Act did not address is the deductibility of business expenses paid for with PPP loan funds. It is not clear whether this was an oversight, or whether lawmakers are assuming the eventual passage of the HEROS Act, which provides a fix to this issue.

At Rockbridge we have been helping our small business clients navigate this ever-changing regulatory landscape. Continue to check back in for updated information, or reach out to a Rockbridge advisor for help.

Although we believe it is reasonable to say that few of us know much (if anything at all) about the Coronavirus, it has quickly grabbed global headlines. As the viral news has spread, so too has financial uncertainty. What’s going to happen next? Will it infect our economy? So far, U.S. markets have remained relatively immune. But should you try to dodge markets that have been exposed?

Our advice is simple: Do try to avoid this or any other health risk through good hygiene. Wash your hands. Cover your mouth when you cough. Eat well, exercise, and get plenty of sleep.

But do not let the breaking news directly impact your investment stamina.

If you’re already following an evidence-based investment strategy …

  • You’ve already got a globally diversified investment portfolio.
  • It’s already structured to capture a measure of the market’s expected long-term
  • You’ve already accepted (at least in theory!) that tolerating a measure of this sort of risk is essential if you’d like to actually earn those expected long-term
  • You’ve already identified how much market risk you must expect to endure to achieve your personal financial goals; you have allocated your investments accordingly.

In other words, it may feel counterintuitive, but leaving your existing portfolio exposed to the risks wrought by a widespread epidemic is already part of the plan. All you need do is follow it.

Admittedly, that’s often easier said than done. Here are a few reminders on why sticking with your existing investment plan remains your best financial “treatment.”

Markets endure. We by no means wish to downplay the socioeconomic suffering coronavirus has created. But even in relatively recent memory, we’ve endured similar events – from SARS, to Zika, to Ebola. Each is terrible, tragic, and frightening as it plays out. But each time, markets have moved on. Whether coronavirus spreads further or we can quickly tamp it down, overwhelming historical evidence suggests capital markets will once again endure.

“Journalists who reported flights that didn’t crash or crops that didn’t fail would quickly lose their jobs. Stories about gradual improvements rarely make the front page even when they occur on a dramatic scale and impact millions of people.”
Hans Rosling

The risk is already priced in. The latest news on coronavirus is unfolding far too fast for any one investor to react to it … but not nearly fast enough to keep up with highly efficient markets. As each new piece of news is released, markets nearly instantly reflect it in new prices. So, if you decide to sell your holdings in response to bad news, you’ll do so at a price already discounted to reflect it. In short, you’ll lock in a loss, rather than ride out the storm.

“I’m assuming there will be no apocalypse. And that’s almost always, if not quite always, a good assumption.” — John C. Bogle

If you’re not invested, your investments can’t recover. Few of us make it through our days without enduring the occasional moderate to severe ailment. Once we recover, it feels so good to be “normal” again, we often experience a surge of energy. Similarly, markets are going to take a hit now and then. But with historical evidence as our guide, they’ll also often recover dramatically and without warning. If you exit the market to avoid the pain, you’re also quite likely to miss out on portions of the expected gain.

 “[T]he irony of obsessive loss aversion is that our worst fears become realized in our attempts to manage them.” — Daniel Crosby

Bottom line, market risks come in all shapes and sizes. This includes the financial and economic repercussions of a widespread virus, be it real or virtual. While it’s never fun to hunker down and tolerate risks as they play out, it likely remains your best course of action. Please let us know if we can help you maintain your investment plan at this time, or judiciously adjust your plan if you feel it no longer reflects your greater financial goals.

The SECURE Act was passed last month as part of a larger government spending bill. The new law is wide ranging, affecting retirees, heirs, those with 401(k)s, and 529 holders. The following are the most impactful sections of the new law.

New Rules on Inherited IRAs

  • IRAs inherited from people who die after 1/1/2020 can no longer be stretched over the inheritor’s lifetime. Instead, they must be taken out within 10 years.
    • Exceptions are:
      • Surviving spouses
      • Children who are minors. The 10-year rule starts when they turn 18.
      • Disabled people
      • Chronically ill people
      • Anyone not more than 10 years younger than the IRA owner. Many siblings inheriting an IRA will be able to take it over their lifetime.
    • Implications of the new Inherited IRA Rules:
      • Adults near retirement may want to backload Inherited IRA distributions. For example, if you plan on working for another 6 years when you inherit an IRA, it probably makes sense to take no distributions for the next 6 years and then liquidate the account over the following 4 years.
      • For high earners, inheriting an IRA is not as appealing as it was before. For those nearing the end of their lives with high-income children, it may make sense to do Roth IRA conversions as you’ll be converting the IRA in a lower tax bracket than your child will be taking it out once they inherit it. This will be more important for those with large IRAs, fewer children, and high-income children.
    • Inherited IRAs from people who died in 2019 or before are grandfathered into the old rules of a lifetime stretch.


New Required Minimum Distribution Age (RMD) of 72 (was 70.5)

  • For those born January 1st through June 30th, this delays the year of your first RMD by 2 years. For those born in the second half of the year it delays it by 1 year.
  • The distribution schedule does not change. The age 72 factor is 25.6 so the first year distribution is 3.9%.
  • Those who turned 70.5 in 2019 stay under the old rules. The later RMD age is only for those born 7/1/1949 and later.


No age limits to Traditional IRA contributions

  • You still need earned income, but in the past, traditional IRA contributions weren’t allowed after age 70.5. Income rules/limitations still apply.
  • This allows for Backdoor Roth IRA contributions for those over 70.5.


Annuities in 401(k)s

  • Portable annuities may be offered going forward in 401(k)s.
  • Despite its impact not being enormous, this feature is probably the reason the bill became law in the sense that insurance companies lobbied hard for the bill’s passage.
  • We will have to see the kind of imbedded fees associated with the 401(k) annuities, but assuming they are akin to immediate annuities that are bought in the open market, this will be very good for insurance companies and not good for investors who choose annuities in their 401(k)s. We will follow up with another post detailing how bad of an investment purchased annuities are and how high the fees associated with them are.


Expanded 529 uses

  • 529s can now be used to repay student loans. If you have loans and want a state tax deduction (if your state has one), you should run your payments through a 529.
  • 529s can now be used to pay for expenses related to homeschooling.

You may spot the good news in the press sometime soon, but we wanted you to be among the first to hear it, straight from us! Please join us in congratulating Patrick Rohe, CFP® as we name him Chief Executive Officer of Rockbridge Investment Management.

Why the change? It’s an opportunity to recognize Patrick for the contributions he’s already made, as well as for his continued leadership in attracting and mentoring talented new team members.

More than that, you deserve no less from us. Through the decades, our vision has been to help Central New York families enjoy their wealth across generations. For that, we too must evolve and enhance our client care and our participation in the community.

To that end, Patrick will continue to engage directly with clients in his role as a senior financial advisor. As CEO, he’ll also focus on spreading the word about our services and positioning us for growth. Firm founders Craig Buckhout and Anthony Farella will continue as senior advisors and will join Patrick in providing strategic leadership as part of the firm’s management committee.

Had we searched the country over, we could not have found anyone more ideal than Patrick for this newly created position. First, as many of you know, his roots are firmly planted here in Syracuse. Having grown up on his family’s dairy farm just outside of town, he still enjoys spending some of his free time lending a hand at the homestead.

Patrick also has been instrumental in shaping the character of our firm. As he says, “We still want to grow our business here at Rockbridge, but with a deliberate eye toward helping more families and attracting new team members from an incredible pool of local talent. Through thoughtful growth, we look forward to striking that balance for our firm, our growing team, and our community. ”

Please be in touch with us with your questions or comments … and congratulations to Patrick!

In the last year, interest rates have fallen dramatically. At the end of the 3rd quarter in 2018, the yield on a 10-year note from the U.S. Government was 3.05% and today it stands at 1.68%. This decline in interest rates is unusual, but not unprecedented. Given the vast resources of the world’s largest money managers, banks, insurance companies, and universities, surely someone saw this coming.

By and large no one did, and, unless we see a rise in yields in the fourth quarter, no one will be very close. The data above comes from the Wall Street Journal Economic Forecasting Survey. Each month, the WSJ surveys over 50 economists on a wide variety of things, one of which is what they expect the U.S. 10-year Treasury bond will be yielding at a future date. The chart shows what each economist predicted, versus what actually happened.

The difficulty in forecasting rates is well shown by looking at yields at the end of June. Nine months prior, the world’s leading economists’ predictions ranged from 2.75% to 3.94% with an average of 3.40% and a standard deviation of 0.28%. The actual yield on June 30th was 2.00% or 5 standard deviations below expectations. A 5 standard deviation variance should happen 1 out of every 3.5 million times, or effectively never, when events are normally distributed. This reinforces what we already knew:  markets aren’t normal, and people can’t predict them.

As we’ve seen here with interest rates, it is very difficult to time markets, getting in or out at the right time to take advantage of the market’s next move. Smart and highly compensated people who work on large teams with unrivaled access to data spend all day trying to forecast the market. And still, they are wrong as often as they are right.

The best-case scenario for average investors trying to time the market is that it will insert an element of chance into their financial lives. For those willing to accept a materially less comfortable retirement for the chance at having a relatively lavish retirement, market timing may make sense. But that is not most people, and the universe of investors who try to time the market on average underperform for the following reasons:

  1. Excessive Costs: Market timing requires buying and selling positions which comes at a cost. Every time you transact a security you cross a bid/ask spread and some securities come with a fee to trade. While small individually, when done repeatedly these little costs add up. Some use options to time the market. Options are a terrible investment over the long run. Options trading is like playing in the poker room at a casino. With every bet you make, there is someone else on the other side. The only one sure to profit is the house.
  2. Holding Cash: Most who try to beat the market end up holding an unnecessarily large amount of cash for extended periods of time. As cash is a poor long-term investment, this generally reduces returns.
  3. Poor Decisions: Theoretically, every future movement in the market is random, securities are efficiently priced, and investors should not be able to pick winners or losers. Still, there is data that shows the average investor who trades frequently has an uncanny knack of buying high and selling low. The psychology of investing is difficult for anyone to master and frequently instincts work against investors.

The markets future movements are unknown, even to “experts.” Timing the market or picking stocks will usually hurt your wallet, not to mention the mental stress that comes with it. Having a long-term strategy and sticking with it is the best way to build wealth in the long run and to position yourself for an enjoyable retirement.

Stock Markets

It was generally an off quarter for stocks, except for Real Estate Investment Trusts (REITs). The year-to-date numbers look good. Recent periods show variability among individual markets as well as within various time periods – REITs continue to do well, no doubt reflecting declining interest rates. One theme running throughout the past ten years’ stock returns is the better-than-average numbers for domestic stocks versus international stocks.  While this behavior is clear by looking back, investment decisions are made by looking ahead.  Markets have no memory so we can’t bank on superior results from domestic markets continuing.

Another theme in these ten-year numbers is that the domestic large-cap market (S&P 500) returns consistently exceeded those of other benchmarks. Expected earnings and growth drive stock returns, and any surprises that alter these expectations produce volatility.  S&P 500 stocks are well-followed by analysts; there is no reason to think that they will consistently provide positive surprises.  So, what’s going on?  It may be simply that S&P 500 stocks are the default investment when investors desire more risk in the face of anemic returns in other markets.  These results are by and large unrelated to company earnings and investments opportunities – suggesting a “passive management bubble”.  If that explains some of what is happening, then the relative results in this market won’t go on forever.

We know that maintaining a globally diversified stock portfolio has the best chance for long-term success.  However, because domestic markets, especially the S&P 500, are so popular and familiar, it has been especially difficult for investors to maintain strategic commitments among several other markets this time around.

Bond Markets

A yield is what you earn by holding a bond to its maturity. Changes in yields drive returns – falling yields are positive; rising yields negative.  The longer a bond’s maturity, the greater the impact a given change will have on prices and returns. 

The Yield Curve is a picture of how these yields vary across several bond maturities.  Shown to the right are U.S. Treasury securities a year ago (September 2018), at the end of last quarter (June 2019) and today.  Not only can changes help us better understand bond returns, they can also be useful predictors of the direction of interest rates.  The sharp fall-off over the past year means positive bond returns, especially at the longer end – the long-term Treasury benchmark (7-10 yrs.) earned nearly 10% while the short-term benchmark (1-3 yrs. Treasury) earned only 3%. Bond returns were positive over the past quarter reflecting the downward shift in the Yield Curve.

Last year’s curve is typical; the more or less “flat” curve we see today is not.  However, it is consistent with expected lower rates in the future.  The story behind this prediction is that the Fed will continue to reduce rates to fight the upcoming economic decline. However, while there is some indication of a slowdown, neither the stock market, nor labor markets (where unemployment is at historical lows) seem to anticipate much of a slowdown.  The recent cut in interest rates is more in response to political pressure – at these levels the effect of any decrease will be mostly perception.

Recessions and the Tools to Respond

There is a lot of noise about a coming recession.  While the numbers still look reasonable, the tools to respond may not be as potent this time around. The hue and cry for the Fed to reduce interest rates notwithstanding, and with rates at historically low levels and massive Treasury securities on the Fed’s balance sheet, there is not much room for monetary policy to make a difference. As far as fiscal policy is concerned, the Government is already running substantial deficits due to the recent tax cut.  The positive impact may be behind us and with today’s political dysfunction, the opportunity to do more with fiscal policy may not be available.   A lot of uncertainty – little wonder the stock market is volatile.  With the large tax cuts in place and an accommodative Fed, we have enjoyed a nice ten years that may be difficult to repeat.

The word “recession” makes investors feel uneasy and with good reason; the correlation between a bear market and an economic recession is very high. For anyone with money in the stock market, especially those nearing retirement, this can be scary. The “r” word has been making headlines in recent months as investors worry about trade wars, the yield curve inverting, and drops in manufacturing activity. In this piece, we’ll unpack what a recession is, what it means for markets, and what can be done to protect a portfolio against one.

A recession is defined as a period of two consecutive quarters where economic activity declines on an inflation-adjusted basis. The main cause of this is economic activity decreasing; however high inflation and population growth can play a factor as well. For example, Japan has had three recessions in the last 10 years as their population has shrunk by 1.52%.

In the United States, economic activity is measured by the Bureau of Economic Analysis’ calculation of Gross Domestic Product (GDP). This measure takes three months to publish and is then revised each of the next two months before we are given a final reading. Because of the definition and the time it takes to report, we don’t know we’re in a recession until 9 months after it is upon us.

Regarding impact, we analyzed the six recessions we’ve seen over the last 50 years.

For example, in November 1973, a 16-month recession began in the United States which saw GDP shrink by 3.2%. The stock market peaked 11 months prior to the start of the recession (December 1972). It took 21 months to bottom out with a loss of 45.6%. During that time international stocks dropped 29% and five-year government bonds rose 4.5%. Fourteen months after the bottom, a balanced portfolio recovered all it had lost.

A recession’s impact on the market varies. Sometimes the impact is small (the drop we had in Q4 of last year was worse than the market’s reaction in three of the recessions) and other times it is very large. The thing that struck our team was how quickly a balanced portfolio recovers from a recession. A 60% stock portfolio that is diversified among international stocks, and is rebalanced quarterly, recovered on average 9 months after the market bottom. When you’re living through the drop, it can feel like a long time, but for investors whose money has a 30+ year investing horizon, it isn’t that long.

Another thing to remember is we don’t know when/if the next recession is coming. The Wall Street Journal Survey of Economists puts the odds of a recession in 2020 at less than 50%. Australia has gone 28 years since their last recession.

While there is no such thing as an average recession, let’s play one out. Say we begin a recession in January of 2020. We won’t know it’s a recession until next September. The market will have peaked this past July and will drop 31% before bottoming in October of 2020. A diversified 60/40 portfolio will decline 13.3% and recover those losses by July of 2021. Again, it’s not fun, but it’s not the end of the world.

And to reiterate, we don’t know when or if this will happen. We’d bet a lot of money a recession won’t start in January of 2020, not because we think we know what the economy will do, but because it’s a low probability event. In the 48 hours we took to research and write this piece, we’ve had a bit of good data and positive news from trade negotiations. The market is up 2.7% over that time and the headlines talking about a recession have vanished. That could easily change; the only point is that no one knows, and headlines are fickle and sensational.

If the fear of a recession is keeping you up at night, it’s a good idea to reach out to your advisor and discuss your asset allocation. A financial planning best practice is to periodically make sure you’re appropriately allocated for your long-term goals and individual risk tolerance. But alterations that are “short-term” by nature or “tactical” are usually mistakes. As Peter Lynch (one of the most successful investors of all time) once said, “Far more money has been lost by investors preparing for corrections, or trying to anticipate corrections, than has been lost in corrections themselves.” Our job as your fee-only fiduciary advisor is to make sure you don’t prove Peter Lynch right.

Stock Markets

Stocks rebounded nicely. Tech stocks (FANGs – Facebook, Amazon, Netflix, Google) after leading the way down in last year’s fourth quarter (off 22%) led stocks back up (up 23%). A global stock portfolio earned about 12% this quarter and domestic stocks continued in the forefront.

Looking past this quarter, non-domestic markets have fallen short of domestic market returns.  There is no reason to think this pattern will continue. Stock markets seemed to have calmed a bit, and some of the uncertainties that have plagued stocks in the recent past seem to be coming into sharper focus.  Trade negotiations with China are moving along in a more positive vein and stocks continue to respond nicely to positive news about any possible resolution.

Concerns of looming deficits due to tax cuts appear to have moved to the back burner as inflation and interest rates remain at historically low levels. Markets continue to shrug off any dysfunction in Washington.  Yet, concerns remain. How Brexit (Britain leaving the European Union) eventually plays out remains a mystery.

Bond Markets

Bonds, especially longer-term bonds, are up this month, which is consistent with declining yields, at longer maturities.  Look below to see how bond yields beyond a year are below last quarter and a year ago.  The ten-year yields are below one-month yields – the lowest is at the 5-year mark. This pattern is unusual. Perhaps the best explanation is as simple as this: in a world of low and negative interest rates, U.S. Treasuries are the “best deal in town” for safe assets.

Interest Rates

Interest rates are historically low and have confounded many observers – more than a few predictions have gone awry, and crafting a compelling story to explain why there is little difference between short-term and long-term rates remains elusive.  Additionally, by historical standards the Fed has massive levels of Treasuries and Mortgage-backed securities on its balance sheet, which it must deal with, creating even more uncertainty.

Interest rates are important to the economic landscape. They are the price of capital – interest is what must be paid to use someone else’s money. The Fed only controls short-term rates.  Longer-term rates are where supply and demand for capital intersect. Demand depends on the expected payoff for putting capital to work; supply depends on what you expect to earn for giving up the use of your money. The horizon for suppliers and users of capital is distant – slight changes in interest rate’s can have a significant effect.

Stock prices are the present value of all future cash flows, which theoretically go on forever.  Falling interest rates translates into rising values of these cash flows.  The historically low levels and generally downward trend in interest rates help to explain the long-running bull market.

Bond returns are affected by both absolute levels and changes in interest rates – rising rates produce lower bond prices and returns; falling interest rates work in the opposite direction.  The longer the maturity, the greater the impact of changing rates.  Declining yields at the long end mean better returns for longer-maturing bonds.

Where interest rates go from here is anybody’s guess.  However, right now there doesn’t seem to be much pushing rates up, especially with an expected slowdown in worldwide growth.  All indications are for rates to remain low with little difference between short and long rates for a while.

Jack Bogle

Jack Bogle, the godfather of index funds and founder of Vanguard, passed away in January at age 89.  His influence on the investment world over the past forty years is immense; his accolades are well-deserved. Jack Bogle’s unwavering commitment in his ideas alone set him apart.  While the underlying concepts behind index funds are now the mainstream, they surely weren’t when he first championed them.  Jack Bogle clearly did more than anyone for small investors.  The notion behind Index Funds (achieving market results at the lowest cost to have the best chance for long-term success) is equally applicable to all investors – both large and small.

,
Employment in the United States

Employment statistics are considered one of the best (if not the best) indicators of the health of our economy. Last Friday, August 2, the department of labor announced an unemployment rate of 3.7%, slightly higher than the 3.6% in April and May, but essentially the lowest it has been since a 3.5% reading in December of 1969. Most everyone agrees this is positive, though headline unemployment is only one statistic tracked by the department of labor, and probably isn’t the best statistic. In the rest of this piece, we’ll look at where our unemployment statistics come from, and what each of them means as it relates to the health of the economy.

About the Report

To measure unemployment, the government carries out the monthly Current Population Survey (CPS). Each month, the United States Census Bureau contacts approximately 60,000 households, each specifically selected as part of a representative sample of the population of the United States, to be interviewed for the survey. According to the Bureau of Labor Statistics (BLS), highly-trained Census employees “ask about the labor force activities or non-labor force status of the members of these households during the survey reference week.” Some households are contacted four months in a row while others are phased in and out of the survey for shorter periods. In this way, most of the sample is left the same from month to month, to strengthen the reliability of monthly changes in the collected data.

This survey is completely separate from the Establishment Survey which is released at the same time and tells us how many jobs were added each month. In the Establishment Survey, roughly 150,000 employers are contacted by the department of labor to get a sense of the total employment in the United States. The change each month becomes the jobs gained (or lost).

The Unemployment Rate

Over the last 71 years, the unemployment rate has averaged 5.7%, with a low of 2.5% in 1953 and a high of 10.8% in 1982. The current rate of 3.7% is very low by historical standards, with lower readings only observed in 6.7% of surveys. This number tells us what percent of the 60,000 households surveyed said they didn’t have a job and were looking for work. This is a great time to be looking for a job as prospects have improved from the 10.0% reading we saw 10 years ago in 2009.

Labor Force Participation

While this is positive, not all metrics are at 50-year lows. Another number often referenced is the labor force participation rate. A higher participation rate means a greater percentage of the population is looking for work. When this number ticks up, it’s generally viewed as a good thing even if it leads to a higher unemployment rate. Currently, our participation rate is 63.0%, meaning 63% of people age 16 and older are employed or looking for work. This is almost right on top of the average for the last 71 years (62.9%). We saw this number peak in 2000 at 67.3% and bottom in 1954 at 58.1%.

There are two factors that skew this number; the rise of participation by women in the labor force, and people living longer. Women steadily increased their participation from 1948 (32%) to 2000 (60.3%). Since then it has fallen slightly to 57.2%. If you account for this rise and only look at the last 30 years of U.S. Labor Participation you see a bleaker picture. The current 63.0% is near the bottom (62.4% in 2015) and below the 65.4% average of the last 30 years. However, we aren’t accounting for people living longer. Americans living later into their 80s and 90s is a good thing and no one expects them to work (unless they’re in politics).

Employment Ratio

Fortunately, the Bureau of Labor Statistics thought of this and consequently publishes a data set limited to ages 25-54, generally thought of as the prime working years for most Americans. The current rate of 79.5% is a little above normal. Over the last 30 years, we have realized an average of 78.7% with a minimum of 74.8% (2009 & 2010) and a maximum of 81.9% (2000). This better gauge of the current employment situation, the “Employment-Population Ratio: 25-54 Years” (https://data.bls.gov/timeseries/LNS12300060) tells us what percent of working age people are actually working. By not including seniors, it isn’t skewed by people living longer, it also gets around the question of whether workers are discouraged and not actively seeking jobs.

Median Weekly Earnings

Another gauge of the labor market is inflation adjusted weekly earnings. Though hourly wage data is more quoted, we prefer weekly earnings as it takes into account the amount of time worked. If median hourly wages are $100/hour but employers only allow 1 work hour each day, workers won’t have much income to live off. The Bureau of Labor Statistics began tracking weekly wages (for non-supervisory positions) in 1964, when they were $95.50/week. Most recently the number came in at $785.91/week, which seems like a big gain but isn’t because of inflation. If you set 1964 to $1.00/week, and adjust the numbers using the Consumer Price Index (CPI), current weekly earnings stand at $0.99, a bit above the $0.95 average from the past 55 years. The lowest real earnings came in 1996 at $0.84 and the highest was in 1973 at $1.13. Interestingly, earnings peaked right before the crash of 1973 (which saw the S&P 500 drop 48%) and they were the lowest in the lead up to the dot-com boom. Keep in mind, this is a median number that doesn’t include the highest paid members of the workforce. Another thing to note, wages have generally risen while the work week has generally shortened.

Total Wages Being Paid

Overall, the employment situation is very strong. Few people who want jobs aren’t working, and earnings are decent. Some will point to 2000 as a time when the job market was stronger, but on an inflation adjusted basis, earnings are currently 10% higher than they were 19 years ago. Others may point to 1973 as a time when workers were earning more but bear in mind labor was scarcer 46 years ago as less than 44% of women were actively seeking work, and the 25-54 employment ratio was only 71%. The following chart is a metric for total wages being paid as it multiplies the 25-54 employment ratio by an inflation adjusted weekly earnings index. This takes into account inflation and population growth.

Setting the index to 1 in the first year of data, we get a current reading of 1.19, essentially the highest on record. This indicates the labor force is in good shape when accounting for number of people employed and wages being paid. This story shows itself in other data as well; currently there are 7.35 million job openings in America and only 6 million people looking for work. Hopefully the trend of the last decade continues and the American economy stays healthy.

Stocks for this quarter maintained the above-average trend in the year-to-date numbers.  The primary market drivers are the Fed activities and the status of tariff discussions with China and Mexico.  As the prospects for reduced interest rates and resolution of the tariff negotiations wax and wane, stocks move up and down.

The graph below shows returns in several equity markets for various periods ending in June.  A few things stand out:  (1) domestic markets have done better than non-domestic markets; (2) there are significant differences among the various markets and; (3) while volatile, it was a reasonably good period for stocks.  Keep in mind that ten years is a short period and that markets have no short-term memory – what we see here may not be indicative of what the next ten years hold.  Consequently, the need for diversification.

Bond Markets

The yield curves below show what’s earned over several periods from holding U.S. Treasury securities to maturity.  These curves are sometimes indicative of the future direction of interest rates – upward sloping is consistent with a reward for taking interest rate risk and increasing rates; flat and downward sloping for decreasing rates. Note the parallel shift downward over the past quarter – positive for bond returns.  The typical yield curve slopes upward – greater return for longer maturities.  Note the June and March yield curves do not follow this pattern.  Look at the uptick in short-term yields and decline in yields for longer maturities over the past year – positive for long-term bonds, negative for short-term.

Diversification

Diversification can bring short-term uncertainty, but unless you can predict the future consistently, it is still the best strategy for the long run. Holding a diversified portfolio means in most periods, there will be at least one market we wished we avoided.  Recently, value stock returns are well under those in other markets. Yet, to realize the long-run benefits of diversification, we must deal with this short-term regret and uncertainty. There is evidence that over the long run, markets tend to move towards averages – periods of above-average returns are followed by periods of below-average returns.

International Trade

Markets move as the prospects for tariff negotiations wax and wane.  International trade ties world economies together – it’s fundamental to the workings of today’s global economy. Through time the world changes and comparative advantages shift.  International trade continuously affects various industries differently.  Recent volatility in stocks is consistent with ongoing trade negotiations with China and now Mexico.  As the specter of increasing tariffs becomes an issue, markets tend to fall when first introduced, then rise with anticipated resolution. These ups and downs are something we must live with today.

Capital Markets and the Fed

All eyes are on the Fed and the prospect for reduced interest rates.  While this noise is apt to be positive for stocks in the short run, it is hard to put together a compelling story for the longer term.  First, the Fed can only directly affect short-term rates.   Second, there is not much room for rates to fall from today’s historically low levels.  Third, Fed actions only impact long-term rates and borrowing costs to the extent they change market expectations. Finally, the reason for a rate cut is an economic slowdown – generally not positive for stocks.

Stock prices are the present value of expected future cash flows, and so move in sync with an increase’s or decrease’s in expected cash flows and move inversely with interest rates.  For reduced interest rates due to an economic slowdown, the positive impact of falling interest rates would offset the negative effect on expected cash flows.  It appears the market is making that tradeoff today.

The impact the Fed has on the bond market is mostly perception.  It can only affect short-term rates.  A bond’s yield (the amount it will earn if held to maturity) depends to an important extent on expected inflation.  Changes in these yields, which affect periodic returns, follow changes in expected inflation.  This is where the Fed and bond returns come full circle – the Fed watches expected inflation and signals its views by adjusting short-term rates. While it is comforting to have explanations for short-term market behaviour, often it is random noise. This time around the explanation seems to be an anticipated reduction in interest rates by the Fed.

We’d like to welcome to the firm our newest investment advisor, Zach DeBottis, as well as our two summer interns, Joel Farella and Hari Nanthakumar.

Zach joined Rockbridge in a new capacity this past June, having worked for Rockbridge as an intern intermittently throughout his senior year of college at SUNY Geneseo. While working as an intern, Zach found a real appreciation for the approach that Rockbridge takes to improve the financial well-being of their clients. Upon nearing graduation, Zach received several job offers from other Syracuse-area firms within the industry, but he realized very quickly that the values instilled within the framework of Rockbridge resonated with his own values the most.

You can learn more about Zach here.

Joel joins us having just completed his first year at St. Lawrence University, where he intends to major in business and environmental studies. His connection to the firm is through his father, Anthony Farella, one of the founding partners. Joel believes this internship is an appropriate fit for him because he has had an interest in finance for a number of years. Aside from his interest in finance, he also believes that the dynamic of working in the Rockbridge office will provide him with valuable skills and experience for all of his future endeavors.

Hari, like Joel, has also just completed his first year at Columbia University as an economics and philosophy major. He heard about Rockbridge through Ed Barno, one of the advisors of our firm. Hari is hoping to take a deep dive into the world of investment management and explore the complex and sometimes difficult financial issues faced by individuals and institutions. Additionally, Hari is excited to learn about how Rockbridge in particular goes about making decisions to better the financial well-being of their clients.

Welcome Zach, Joel, and Hari!


The financial crisis of 2008 put the financial services industry under significant scrutiny. While the biggest headline grabbers were overleveraged investment banks and practices around mortgage origination, retail investment services also underwent additional regulatory oversight. Specifically, Section 913 of the Dodd-Frank Wall Street Reform and Consumer Protection Act directed the Securities and Exchange Commission (SEC) to rule on the obligations, actions, and standards of brokers, dealers, and investment advisers.

The legislation requiring a ruling came about because the sentiment among average Americans is that their interactions with the investment world tended to benefit those working in the investment world more so than themselves. These feelings were not unfounded. In the 80s and 90s, almost all “retail” (individuals purchasing for their own accounts, not part of a larger group) investing happened through brokers and the only fund offerings were high-cost actively managed accounts. Between advisory fees, sales loads, fund fees, trading commissions, and custodial fees, the cost of investing was often in excess of 3%. Read more

Stock Markets

Stocks rebounded nicely. Tech stocks (FANGs – Facebook, Amazon, Netflix, Google) after leading the way down in last year’s fourth quarter (off 22%) led stocks back up (up 23%). A global stock portfolio earned about 12% this quarter and domestic stocks continued in the forefront.

Looking past this quarter, non-domestic markets have fallen short of domestic market returns.  There is no reason to think this pattern will continue. Stock markets seemed to have calmed a bit, and some of the uncertainties that have plagued stocks in the recent past seem to be coming into sharper focus.  Trade negotiations with China are moving along in a more positive vein and stocks continue to respond nicely to positive news about any possible resolution.

Concerns of looming deficits due to tax cuts appear to have moved to the back burner as inflation and interest rates remain at historically low levels. Markets continue to shrug off any dysfunction in Washington.  Yet, concerns remain. How Brexit (Britain leaving the European Union) eventually plays out remains a mystery.

Bond Markets

Bonds, especially longer-term bonds, are up this month, which is consistent with declining yields, at longer maturities.  Look below to see how bond yields beyond a year are below last quarter and a year ago.  The ten-year yields are below one-month yields – the lowest is at the 5-year mark. This pattern is unusual. Perhaps the best explanation is as simple as this: in a world of low and negative interest rates, U.S. Treasuries are the “best deal in town” for safe assets.

Interest Rates

Interest rates are historically low and have confounded many observers – more than a few predictions have gone awry, and crafting a compelling story to explain why there is little difference between short-term and long-term rates remains elusive.  Additionally, by historical standards the Fed has massive levels of Treasuries and Mortgage-backed securities on its balance sheet, which it must deal with, creating even more uncertainty.

Interest rates are important to the economic landscape. They are the price of capital – interest is what must be paid to use someone else’s money. The Fed only controls short-term rates.  Longer-term rates are where supply and demand for capital intersect. Demand depends on the expected payoff for putting capital to work; supply depends on what you expect to earn for giving up the use of your money. The horizon for suppliers and users of capital is distant – slight changes in interest rate’s can have a significant effect.

Stock prices are the present value of all future cash flows, which theoretically go on forever.  Falling interest rates translates into rising values of these cash flows.  The historically low levels and generally downward trend in interest rates help to explain the long-running bull market.

Bond returns are affected by both absolute levels and changes in interest rates – rising rates produce lower bond prices and returns; falling interest rates work in the opposite direction.  The longer the maturity, the greater the impact of changing rates.  Declining yields at the long end mean better returns for longer-maturing bonds.

Where interest rates go from here is anybody’s guess.  However, right now there doesn’t seem to be much pushing rates up, especially with an expected slowdown in worldwide growth.  All indications are for rates to remain low with little difference between short and long rates for a while.

Jack Bogle

Jack Bogle, the godfather of index funds and founder of Vanguard, passed away in January at age 89.  His influence on the investment world over the past forty years is immense; his accolades are well-deserved. Jack Bogle’s unwavering commitment in his ideas alone set him apart.  While the underlying concepts behind index funds are now the mainstream, they surely weren’t when he first championed them.  Jack Bogle clearly did more than anyone for small investors.  The notion behind Index Funds (achieving market results at the lowest cost to have the best chance for long-term success) is equally applicable to all investors – both large and small.

Over the summer, we had a client ask if there was a place to look for existing accounts or funds they or family members may have accumulated and forgotten about over the years. That sparked Julie’s memory of the New York State Office of Unclaimed Funds (https://ouf.osc.state.ny.us/ouf/?wicket-crypt=8AxvNk1VlCk). You may have noticed the Office puts a kiosk at the NYS Fair every year.

Run by the NY State Comptroller’s Office, the Office of Unclaimed Funds serves as custodian of more than $15 billion in assets. When an entity has money that belongs to someone else and can’t reach that person, they turn the money over to the Office of Unclaimed Funds.

This particular client did not have any funds belonging to the Office of the Comptroller, but it seems like a lot do. A few of us had unclaimed funds, as did family members and friends.

Experiences getting the money back are varied. Some submit online and get paid within three weeks. Ethan had a $175 reimbursement from a Doctor’s visit (the insurance company ended up covering it months after the visit and after I had moved); this took five months to process as the State needed separate confirmations of a previous address and a current address.

When completing the online form, you must submit your Social Security number, and some detailed contact information such as phone number/provider and e-mail. Having the check mailed to the address on your driver’s license can speed up the process.

We encourage everyone to give the search a try. In addition to searching by your first and last name, we have found it useful to search by last name and city. As always, reach out to your advisor with questions.

2018 was a woeful year for investing. All major stock market indexes were down, bonds enjoyed a year-end rally to finish flat, and commodities such as gold and oil fell. Seeing all asset classes drop in unison is unusual and unlikely to continue.

Stocks

Stocks began the year on solid footing, but fortunes quickly changed as early February saw a 10% drop in equities. Markets steadied over the spring and summer, with domestic stocks reaching new highs in the early fall. And then the 4th quarter happened. All equities suffered substantial losses. In aggregate, U.S. Large Caps and REITs were the best performers of 2018, followed by U.S. Small Caps, and then International Stocks.

2018 was a poor year for International Stocks, but Emerging Markets are still the best performer over the last two years (after being up 38% in 2017). December was a reminder of why we stay diversified. While U.S Stocks were down 10%, International Developed lost 4.8% and Emerging Markets lost 2.6%. Again, we see diversification help to dampen volatility.

Bonds

Yields rose in 2018 and the curve flattened substantially. The Federal Reserve hiked rates four times last year as they viewed a strong economy and a tightening labor market reason enough to aggressively unwind their accommodative monetary policy. The U.S. 5-Year Treasury, a good proxy for our Bond holdings, began the year with a yield of 2.25%, before selling off to reach a high of 3.09% in early November. At that point, the aggregate bond market was down 3% for the year and it looked certain we’d finish the year negative for the 4th time in the index’s 43-year history. But a 58 basis point rally in the final two months spared Bonds, allowing them to finish 2018 with a positive return of 0.01%.

The yield curve is now the flattest it’s been in a decade. The 1-Year Treasury Bill is yielding more than the notes maturing in 2-7 years. It appears the market is pricing in one more hike in interest rates, followed by a few cuts from the Federal Reserve. These cuts could come as a result of a recession or simply because global growth slows (but doesn’t contract) and inflation softens below the Fed’s goal of 2%.

Near Bear Market

On Christmas Eve, the S&P 500 closed down 2.7%, ending a 7-day stretch where stocks lost 11.3% of their value. That selloff put us on the cusp of a “bear market” meaning a drop-in price of 20% or greater from a previous high.

The causes of the selloff are numerous. America and China are involved in a growing trade war, the Fed is raising interest rates, analysts lowered global GDP growth estimates, manufacturing activity is below expectations and our government is in a shutdown with no end in sight.

On top of that, we’ve had a record long 10-year run of strong stock market performance and economic expansion that is the second longest in history. It seems there is plenty to be fearful of. Our cognitive biases aren’t helping. Some of us may be experiencing  recency bias. In the last 30 years, the only two times the market has dropped more than 20% were because of the dot-com bubble and the financial crisis. In those instances, we saw the market sell-off 49% and 57% respectively. Being 20% off the highs investors think, “I know what happens next.” The next logical question is– shouldn’t we sell out of stocks now, wait until the market falls 50% and buy back in? But just because that’s how the last two drops have happened doesn’t mean this one will be the same. It’s possible the bottom of the market will be a 21% selloff, or 23%, or 27%, or 32%. Or it’s possible that the bottom was the 19.78% we saw on December 24th.

Some of us also suffer from negativity bias; we remember the things that ended poorly but forget instances where things turned out well. In 2011, the market was in the middle of its recovery from the financial crisis when cracks began to appear. Greece was heading towards bankruptcy and there were concerns the Eurozone would break apart. Bank of America was experiencing extreme volatility, and some feared they may be insolvent. High-profile investors such as Ray Dalio, who predicted the 2008 crash, were warning of a “double-dip” recession, pushing markets back to levels in 2008 & 2009. In the five months from May until October, the market sold off 17%. But the crash never came. Greece and the rest of the EU didn’t implode, Bank of America got a $5 billion investment from Warren Buffet, and the economy kept chugging along.

The same fear investors feel about the market today they could have felt in 2011. But we forget 2011 and remember 2008, though there is no reason to think that 2019 will be like 2008 and not 2011 (throughout history there have been a lot more 20l1’s than 2008’s).

2019 and Beyond

We do not know what the stock market will do in 2019, and neither does anyone else. Despite the pessimism in the markets and in the media, there are plenty of reasons to feel good about stocks. America’s economy is expected to grow at 2.3% and the broader world is expected to grow at 3.0%. 2018 ended with a very strong jobs report as wages and hiring continues to be robust. Perhaps most promising of all was an increase in the labor force as those who had previously not been looking for jobs re-entered the market.

Every Wall Street Bank that puts out a price target for the S&P 500 is predicting a positive year in 2019. The average earnings for the S&P 500 are expected to be $173. With a 2018 close of $2,507, that works out to a forward P/E of 14.5, which is low by historical standards meaning stocks are currently a good value. This puts equities on par with where they were at the start of 2013 – that year the market rallied 34%.

We don’t know what next year and beyond have in store for stocks, but we do know over time it pays to be invested. Investing in the market isn’t easy which is why it pays so well in the long-run. Volatility like we saw in the last quarter causes people to sell out of stocks. This is beneficial to the disciplined investor as there are fewer people with whom he or she has to share corporate profits.

The best thing a person can do is find the right mix of stocks and bonds that fits their individual needs and then stay the course. And lastly, if the market closes next year right where it started at $2,507, your return won’t be 0, you’ll have made 2.2% because companies pay dividends!


Stock Markets

December’s market reminds us that risk is real – even after the uptick at the end of the month, a global stock portfolio is down about 15% for the quarter and 12% for the year. Technology stocks (Amazon, Apple, Microsoft, Google, Facebook, Netflix), which have been driving the market to new heights in recent years, were off nearly 20% this quarter.

Future returns depend on news, which, of course, can’t be predicted. (If it could it wouldn’t be news!) Maybe markets have exaggerated today’s concerns or maybe there is more to go.  For sure, increased volatility lies ahead.  We have been lulled into a stock market that has provided a mostly smooth ride upward over the past few years.  That pattern is not typical – risk matters.

Up until now, the market has shrugged off the myriad of issues that have been plaguing us for a while. These include:  international trade wars and tariffs, rising interest rates, privacy and social media concerns, impact of last year’s Tax Bill, resolution of Brexit, slowdown in global growth, sliding oil prices, political dysfunction and Government shutdowns.  Market prices reflect a continuing forecast of the eventual economic impact of these issues.  In December, these forecasts turned negative.

The ten-year numbers above tell us there is a reward for enduring the normal ups and downs of stock markets, including recent results.

Bond Markets

Bonds earned positive returns for the quarter, fulfilling their role of reducing the overall risk of a diversified portfolio. 

The shape of bond yields across various maturities is unusual.  Even as the Fed increased interest rates, the market-determined yields on longer-term bonds fell.  This pattern can be a harbinger of a difficult economic environment ahead. On the other hand, it is also consistent with an overall move to reduce exposure to risky assets.

We are now dealing with the risk side of investing, which we can divide into two categories:  (1) the impact of factors that affect all securities, and (2) the impact of what affects only an individual security.  By diversifying, the effect of any individual security becomes minimal.  Expected return is the reward for enduring the variability of market-wide uncertainties.

Stock markets are risky, but what about the eventual reward?  Do investors eventually earn what they expect?  We look for answers in two places:  (1) If market participants, who are constantly buying and selling, didn’t eventually earn what they expect, they wouldn’t play, and (2) There is evidence that over the long run, returns tend toward long-term averages.  But long-term means long and succumbing to short-term variability ensures failure.  It’s why risk matters.  It’s why the urge to give up makes success hard to achieve.

Depending on the news you read, you may have come across headlines talking about bear markets and stock market corrections. The following is a guide to what they mean and how to put them in the context of history.

The conventional definition of a bear market is a price drop in a stock market index of 20% or greater from its high. The most quoted stock market index in America’s investment community is the S&P 500. When people reference our being in a “bear market,” they are likely talking about the S&P 500.

With Monday’s close at 2,351.10, the S&P 500 is 19.78% off its close of 2,930.75 set on September 20th of this year. That means we are a 0.28% drop away from entering a bear market. However, other markets are already in bear territory:

A 20% drop feels pretty bad and it is. Since 1950, we’ve witnessed 9 bear markets:

Nine bear markets over 68 years works out to one every 7.5 years. And it has been nearly 10 years since our last bear market bottom. Are we due? Maybe…

Another term in the news is market “corrections.” A market correction is generally defined as a drop of 10% or more. The following table shows all the stock market corrections since 1950 that never became bear markets:

When looking at the current correction compared to all drops of 10% or greater since 1950, we see:

Our last two bear markets (2002, 2009) have been big ones, the two largest since the great depression. In the last 30 years, the only times the market has dropped more than 20% it’s kept falling, eventually being cut in half. Our recency bias tells us once we’re 20% off market highs we have much pain ahead, but that is not certain. It is imperative we remind ourselves that twice doesn’t make a trend and is woefully short of being statistically significant.

Maybe stocks will continue to drop, reaching a 40%+ bear market, or maybe 2018 will be a repeat of 1990. In 1990, we had a correction that barely eclipsed 10% very early in the year, followed by a larger drop at the end of the year that came within 0.1% of being a bear market. But if you had temporarily reduced your equity exposure it would have been to your detriment. For the rest of that decade, the S&P 500 appreciated at an annualized 20.9% over that 9-year span.

No one knows what the market will do next, but we do know it’s folly to try and time it. $10,000 invested in the S&P 500 in 1950 would have grown to $14,000,000 today for an annualized return of 11.1%.  One way to think of it is that every day you are in the market you are earning nearly 0.03%. If only it were that easy…


Stock Markets

For the last quarter, stocks are up except for Emerging Markets, which were close to flat. Domestic stocks are seemingly shrugging off the uncertainties of increasing interest rates, trade wars and tariffs.

Year to date, an Emerging Market stock portfolio would be down almost 9%. It is not surprising that today’s uncertainties are having a greater impact on developing economies as they tend to have larger debt levels denominated in dollars and exports are a bigger part of their economies.  Consequently, the value of the dollar is increasing, interest rates are rising, and tariffs will have a greater impact.

Non-U.S. markets have not kept pace with U.S. markets over the periods presented. Subsequently, stock returns from a globally diversified portfolio over these periods would be below those of the popular domestic indices (e.g. S&P 500).  This environment makes maintaining commitments across all markets especially hard.  The benefits of diversification are clear, but it often means enduring periods of below average results in various markets for extended periods of time. For example, since 1971 the annualized ten-year return for the S&P 500 has varied between 5% and 17%.  It is reasonable to think markets will eventually earn their expected returns (in the “long-term”), but this variability gets in the way of considering ten years the “long-term”, as we would expect a much tighter range in these results if it were indeed the long-term.  So, when we see non-U.S. stocks underperform in every period reported in the chart above, we do not conclude they will always underperform, but instead that more patience is required to reach the “long-term” and achieve expected returns.


Bond Markets

The Yield Curves to the right shows that bond yields ticked up for all maturities over the past year and quarter.  The Fed recently affirmed its commitment to increase interest rates and the change in yields is consistent with that objective.

How much room is left for bond yields to move?  The yield on the 10-year Treasury is currently about 3.1%.  Theoretically, a bond’s yield should include a premium for (1) the time value of money, (2) risk and (3) expected inflation. For example, let’s pick 2% as a premium for investing instead of spending money.  Note the difference in yield between one-year and ten-year bonds is 0.5%.  This leaves 0.6% as expected inflation over the next ten years. If this expected inflation number is reasonable, then today’s yields might be about right – if this number for expected inflation over the next ten years feels low, then yields might have some ways to go.  While these observations are not a prediction, they are intended to provide some context for what we see in today’s bond markets.

As we think about the recent bull market in U.S. stocks, below-average results in non-U.S. markets, and historical low interest rates, keep in mind that markets have no memory.  Remember that prices are based on expectations not the past.

Interest rates are rising, and yet you may not be earning much on your cash.  As financial markets finally begin to reflect a recovery from the crisis of 2008-09, the brokerage industry is changing the way they handle customers’ cash, and investors need to pay attention.

Over the past ten years we have become accustomed to earning nothing on our cash.  The Federal Reserve kept rates at essentially zero for so long that investors came to expect no return on uninvested funds.  It has been a difficult time for savers.  Bank CD rates are generally very close to U.S. Treasury rates, and until mid-2016 a 3-month treasury security yielded less than 0.25%.  In fact, the Fed dropped rates effectively to zero in December 2008 and finally began to raise them again in December 2015.  The 3-month treasury yield has steadily risen along with the Fed Funds rate, from 0.25% in 2016 to over 2% today.  By historical standards interest rates are still low, but the increase from zero to 2% is significant for savers and investors of short-term cash.

So why am I still not earning anything on cash?

The short answer is that the brokerage industry is keeping most of the interest earned in sweep accounts for themselves and forcing investors to deliberately invest cash to earn a competitive rate.

Borrowers who compete for funds are compelled by market forces to pay similar rates – otherwise they don’t get the funding they need.  So banks selling CDs in the open market have seen rates rise along with treasury yields.

Not all borrowers are forced to compete.  Bank deposits and cash balances in brokerage accounts represent something of a captive audience.  Years ago, when interest rates were high, and the market was competitive, banks and brokers began offering sweep accounts, where excess cash was automatically swept into an interest-bearing account each night.  This arrangement was an important source of profit for banks and brokers as they were able to invest the cash and earn a positive spread, or margin, above what they paid the customer.

When the Fed dropped short-term rates to zero in 2008, the profit margin disappeared from sweep accounts, along with the return to savers and investors.

Fast forward to 2018 and we see that short-term rates have crept back to 2%.  At the same time brokers and investment firms have continued to experience competition in other areas of their business; $19.95 was once thought to be an incredible bargain for a brokerage trade.  Many brokers now offer trading on an electronic platform with rates below $10, and certain transactions are free.  Likewise, the internal management fees or expense ratios for mutual funds and ETFs have been driven downward to the point that Fidelity recently announced some index ETFs with an expense ratio of zero.

In their search for profits, brokerage firms have seized on the sweep accounts as a way for them to make money.  Most have transitioned to where excess cash is swept to a bank deposit fund that earns something, but very little.  Profits flow back to the brokerage firm because they either own the bank or have some affiliation that returns profit to the brokerage firm.  This arrangement has at least one advantage for investors because the bank sweep funds are FDIC insured, but returns are substantially below what we would historically expect from money market funds.

So, what am I supposed to do?

Well the good news is that investors have alternatives.  The first strategy is to reduce cash balances where practical.  Schwab for example explains that their sweep account is only intended for the minimal cash balances required for near-term transactions.  Cash held for a longer period, where the investor wants a return without taking investment risk in stocks or bonds, can be invested in a purchased money market mutual fund.  Money invested in these funds is available next-day, rather than same-day in a sweep account.

For Rockbridge clients we are implementing a tighter cash management protocol to reduce balances held in sweep accounts and using money market mutual funds or ultra-short bond funds to generate some return on funds that are not allocated to long-term investment risk.

It is also important to keep this issue in perspective.  Our target is to keep cash balances at 1% (now less than 1%), so a $1 million account would have a cash balance of $10,000 or less.  If left in the sweep account rather than a fund with 2% returns, the lost income would amount to less than $200 per year.

The terminology and nuances of sweep accounts and purchased money funds can be confusing, so if you have any questions, please give us a call to discuss.

We had several clients this year reach out to ask how bonds were performing in their portfolios. These are great questions, so we created a few items to address what you see in your statements.  Some people notice they have held bonds for several years but seem to have a loss with their holding. This may come from their monthly statement from the custodian. Below is an example of how that looks:

From looking at this statement, it seems this investor has lost almost $9,000 from their bond holdings in the last 2.5 years (1/25/16 to 7/31/18). However, if you look at the returns from the bond funds over that period you see they were positive.

This is possible because the bond funds pay interest every month. That interest goes into the account as a monthly cash deposit and is used when we rebalance the portfolio. Interest paid in cash does not increase the market value column. Despite showing an unrealized loss, the investor did make money through these holdings.

All that said, bonds can lose money. When interest rates rise, the value of existing bonds goes down, and returns can be negative even when accounting for interest payments.

Real life application of interest rates:
  1. How it’s playing out this year (numbers from 1/1/2018 to 9/26/2018):An aggregate bond fund holds thousands of bonds. In their entirety, they have an average weighted life (duration) of 6 years. This number tells us how sensitive they are to interest rate changes.At the start of the year, an aggregate bond fund was yielding 2.57%. It is now yielding 3.22%. That means it had an interest rate increase of 0.65%. If you multiply that increase by the bond duration, Sabine’s blog you get the change in value of the underlying bonds. In this case, 6 x 0.65% = 3.90%, so the bonds’ market value dropped by 3.90% from January through September 2018.However, the bonds are paying interest. If you average the yield at the start of the year and currently, you get 2.90%. For roughly 9 months in the year, 2.90% x 9 / 12 = 2.13% of earned interest. This nets out to a loss of 1.77% so far this year.
  2. This isn’t a bad thing! Rising interest rates generally aren’t a problem for the following reasons:
    1. Your returns going forward will be higher! If bond yields start at 2.57% and never change, you’ll earn 2.57% for the rest of your life. If they start at 2.57%, jump to 3.22% and then never change you’ll eventually have more money because of it. Remember, the 3.90% drop in principal came because yields went up 0.65%. Every year from now on you’ll be getting 0.65% more in return. 3.90% / 0.65% = 6. In six years, you’ll have made up the lost principal in extra interest. From that point on you’ll be getting more in yield, leaving you better off in the long run!
    2. Usually, bonds and stocks have an inverse relationship. Historically, the price of stocks and bonds move inversely with each other. This means when stocks are falling, interest rates go down and the value of existing bonds goes up. The opposite is true as well; if the economy is doing well and stocks are rising, interest rates are also going up and the value of existing bonds goes down. Quantitative easing by the Federal Reserve has skewed this some, but overtime we expect this to continue. For a balanced investor who holds both stocks and bonds – when bonds are losing value for an extended period, the stock portion of the portfolio is likely going up. Remember, a few months, quarters or even years is a relatively short time when it comes to investing. And for most of our clients, our time horizon is decades not years.

In summary, we feel bonds add value to most individuals’ portfolios. Over the long run they provide a positive return and have much less volatility than stocks. Additionally, they usually move in the opposite direction of stocks which limits large fluctuations in portfolio value and amplifies the benefit of rebalancing.


“Give, but give until it hurts.”
– Mother Teresa – 


I don’t think Mother Teresa paid much attention to the tax code, but her quote is unusually prescient for 2018 taxpayers.  The changes have made it unlikely to get a tax break on money given to your favorite charities.

When the Tax Cuts and Jobs Act was signed into law late last year, the intent was to reduce taxes and simplify the tax code for all Americans.  Some of the more significant provisions were the increase of the standard deduction along with the elimination of many itemized deductions.

The standard deduction has nearly doubled to $24,000 for married couples filing jointly ($12,000 for single filers).  The non-partisan Tax Policy Center estimates that more than 90% of tax filers will no longer need to itemize their deductions.  Therefore, taxpayers who use the standard deduction would not get any tax savings from making charitable donations.

How the New Tax Law Reduces or Eliminates Charitable Deductions:

For example, let’s say that a married couple pays at least $10,000 (maximum deductible amount) in state and local property taxes, has mortgage interest of $5,000 and makes $5,000 in charitable contributions. This adds up to $20,000 in deductions, which is lower than the $24,000 standard deduction. The higher standard deduction eliminates the tax deductibility of charitable contributions.

How Bundling Restores your Charitable Deduction:

One way to get a tax break on your charitable donations is to bundle them into one year.  For example, if you are likely to give $5,000 to charity each year, then making a one-time donation that covers the next 3-5 years to a Donor-Advised fund will allow you to get the tax break back.

Bundling Works Like This:

Say you make a $15,000 contribution to a Donor-Advised fund in 2018.  Using the above example your total itemized deductions are now $30,000. ($10,000 state tax, $5,000 mortgage interest and $15,000 charity).  The additional $6,000 in itemized deductions over the $24,000 standard deduction would be worth 24%-37% of the difference depending on your own marginal tax rate.

Additionally, you can use the Donor-Advised fund to make distributions to your favorite charities anytime (ie. spread equally over 3, 4 or 5 years or in any other timeframe you choose).

There are many Donor-Advised funds to choose from including ones offered by Charles Schwab and TD Ameritrade.  You can contact your Rockbridge advisor, or check out these Step-by-Step Instructions to Set Up a Donor Advised Fund.


It’s simple. Don’t.

A common question we receive is “how do I prepare for the inevitable stock correction?”  There are two answers to this question: the one you want to hear (which is wrong), and the one you don’t want to hear (which is right).

Mainstream media wants you to believe that you can outsmart the market.  Everything you read and hear from news sources and financial “experts” will make you think this (almost) 10 year bull run is coming to an end.  “Trump, North Korea, inflated stock prices, interest rates, trade wars, Trump (again), etc.” is blasted through your television sets every day of the week followed by “sell stocks, buy bonds, no don’t buy bonds because of interest rates, buy bitcoin, no sell bitcoin and buy Alibaba.”  Here’s the million dollar question: “With all this information and all this uncertainty, what should I do?!”

Nothing.  Often times in the face of fear, the best course of action is to stand still.  The problem is that this type of “inactivity” is perceived as unintelligent behavior when actually the opposite is true. This is proven by math and science.  This is a fact.  Mainstream media won’t tell you this for a simple reason; If Jim Cramer got on the air and told his viewers to hold a diversified portfolio and not to worry about the uncertainty in the markets, he wouldn’t have a whole lot of viewers.   It’s boring, it’s not entertaining, but it is the best way to build wealth.  Ignore these expert opinions.  They don’t know any more than you do.

Market returns typically come in short and unpredictable bursts.  We don’t know when these bursts will happen, but it’s of crucial importance that you are there for them.   You must be there when opportunity knocks, whenever that may be.

I’ll bore you with some facts: If we look at the last 1,100 months (90 years) and removed the best performing 91 months, the average return of the remaining ~1,000 months is practically zero.  In other words, 8.50% of the months provided almost 100% of the returns over the last 90 years!  We don’t know when these months will come, but we must participate in them!

Legendary investor Peter Lynch said it best – “Far more money has been lost preparing for corrections, or anticipating corrections,  than has been lost in the corrections themselves.” Stay invested, construct a plan, and stick to your plan through good and bad times.  And most importantly, focus your time and energy on factors you can control; how much risk to take, what mix of investments, and how much the investments cost to name a few.

Stock Markets

Returns from various stock market indices over several periods ending June 30, 2018 are shown to the right.  Here are a few highlights:

  • Domestic stocks continue to lead the way. REITs were up nicely for the quarter, but non-domestic stocks were down.  Due to political turmoil and the specter of a trade war, stocks traded in developed international markets are reflecting uncertainty.
  • Emerging markets gave back much of their positive result of recent periods. This is driven by increasing interest rates and the strength of the dollar.
  • Returns from domestic small-cap stocks have done well over these periods.
  • Look at the variability among the different markets over the shorter periods and how it tends to even out over longer periods. Keep in mind:  ten years in capital markets is a short period over which there can be plenty of anomalies.

Bond Markets


The Yield Curves graph to the right shows the yield to maturity of U.S. Treasury securities, from short-term (one month) to the long-term (twenty years).  Recent changes in these curves are presented below.  Note:

  • Look how short-term yields have climbed over the past year with little change in longer-term yields. As yields move up, prices and returns go down.
  • There is not much change over the quarter. Notice the flatness of today’s yield curve – hardly any difference between 5-year and 10-year yields.  A flat yield curve is generally an indicator of a difficult economic environment ahead.
  • While there is no sign of it yet, it seems reasonable to expect increasing inflation due to the introduction of tariffs, plus today’s robust economy and low unemployment.  Expectations of increasing inflation should produce higher yields for longer-term bonds.

Stock Markets

Returns from various stock market indices over several periods ending March 31, 2018 are shown to the right. Here are a few highlights:

  • While not observed in these graphs, volatility seems to have come back, which is normally how stock markets work.
  • Except for emerging markets, stocks were down over the past quarter – REITs continue to lag.
  • Even with the off quarter (with the exception of REITs), stocks were up nicely over the past twelve months.
  • Note that over the past five and ten years, returns from stocks traded in domestic markets were well above those in non-domestic markets. However, don’t let these results fool you. Diversification to non-domestic markets is still important to long-term success.


Bond Markets

The Yield Curves to the right show the yield to maturity of U.S. Treasury securities over several maturities, from the short term (one month) to the long term (twenty years).

  • Look at how the curve has moved since the beginning of the year. It is essentially showing a parallel shift upward. As yields move up, prices and returns go down.  Consequently, we realized negative bond returns this past quarter – the longer the maturity, the greater the loss.
  • Now look at the changes since a year ago. Yields for longer maturities did not change much over the past year and, in fact, fell between March and December.  Notice how yields on shorter-term Treasury securities moved up.  These shifts explain the negative annual returns on bonds of shorter maturities and positive returns on bonds of longer maturities.
  • The Yield Curve got flatter over the past year.  The Fed’s activities have increased short-term yields without much effect on longer-term bond yields.  Generally, longer yields are driven by the expectation of future short-term interest rates and inflation.  Today’s Yield Curve implies lower interest rates in the future – quite different from both the announced goal of the Fed and what is usually experienced in a robust economy.


As another tax season comes to a close, we wanted to draw attention to a number of scams and schemes to defraud unsuspecting taxpayers. We think it is important that our clients be aware of how these scams work, and what precautions you can take to protect yourself.

How the Scams Work:

One popular method for defrauding taxpayers is to steal their identity using “phishing” techniques, or malware to obtain their victim’s personal information. Phishing scams use fake emails or website links designed to appear to be legitimate. Once accessed, these fake links will either ask for information or potentially even infect your computer with software allowing the fraudsters to access personal information.

Recently, identity thieves have used this stolen information to file fake tax returns, but use the taxpayer’s actual bank account to deposit the fraudulent refund. Once the refund has been deposited, they will call the taxpayer posing as an IRS agent, debt collector, or law enforcement and demand that the refund be returned.

Taxpayers who receive the refunds should follow the steps outlined by Tax Topic Number 161 – Returning an Erroneous Refund. The tax topic contains full details, including mailing addresses should there be a need to return paper checks. By law, interest may accrue on erroneous refunds.

Telephone scams are another popular way criminals look to defraud taxpayers. These scams involve callers contacting taxpayers claiming to be IRS representatives. The victims are told that they owe the IRS money and that the amount must be paid immediately using either a gift card or wire transfer. Callers posing as the IRS will often become hostile or insulting, and threaten the victims with arrest, suspension of a business or driver’s license, or even deportation if they do not pay. If the phone is not answered, the thieves may leave an urgent callback message.

Scammers do not just operate during tax season. Thieves posing as IRS agents have targeted parents and students during the summer and back-to-school months, by calling and demanding payment of a fake “Federal Student Tax,” or some variation thereof. Just like in the telephone scams previously discussed, these callers will demand payment via gift card or wire transfer, and will threaten to report the student to the police to be arrested if payment is not made.

These are just a few of the most popular scams thieves have engaged in to attempt to defraud innocent taxpayers, and new techniques and tactics are being developed all the time. With that said you can protect yourself by taking the following precautions.

Know What the IRS Will Not Do – The IRS will never:

  • Call to demand immediate payment using a specific payment method such as a prepaid debit card, gift card or wire transfer. Generally, the IRS will first mail a bill to any taxpayer who owes taxes.
  • Threaten to bring in local police, immigration officers or other law-enforcement to have you arrested for not paying. The IRS also cannot revoke your driver’s license, business licenses, or immigration status. Threats like these are common tactics scam artists use to trick victims into buying into their schemes.
  • Demand that taxes be paid without giving the taxpayer the opportunity to question or appeal the amount owed. You should also be advised of your rights as a taxpayer.
  • Ask for credit or debit card numbers over the phone.

Know What the IRS Will Do:

  • Contact you through regular mail delivered by the United States Postal Service. If there is an issue with your tax return, the IRS will issue you a tax “notice” informing you of the issue.
  • Call or come to your home or business. The IRS may call or send an agent to your home or business, but only in special circumstances such as when a taxpayer has an overdue tax bill, to secure a delinquent tax return or a delinquent employment tax payment, or to tour a business as part of an audit or during criminal investigations

Know Whom to Contact:

  • Contact the Treasury Inspector General for Tax Administration to report a phone scam. Use their “IRS Impersonation Scam Reporting” web page. You can also call 800-366-4484.
  • Report phone scams to the Federal Trade Commission. Use the “FTC Complaint Assistant” on FTC.gov. Please add “IRS Telephone Scam” in the notes.
  • Report an unsolicited email claiming to be from the IRS, or an IRS-related component like the Electronic Federal Tax Payment System, to the IRS at phishing@irs.gov.

The bottom line is that if you are contacted by someone claiming to be from the IRS, DO NOT give out sensitive information over the phone or via email. If the call does not feel right, hang up and contact the IRS at 800-829-1040, or your advisor.

Yesterday evening, Rockbridge’s own Ethan Gilbert, CFA was featured on our local Spectrum news network. Check out the interview below where Ethan discusses the recent market shifts, how these swings can affect your retirement accounts, and how to protect your accounts from this volatility.


Click here to learn more about Ethan!

This past weekend, the New England Patriots did it again. Down 10 in the 4th, star quarterback Tom Brady orchestrated two scoring drives to pull off another comeback victory. In two weekends, the Pats will try to win their 3rd Super Bowl in 4 years – headlining a host of impressive statistics dating back to 2001.

But as loyal CNYers, we know this run will come to an end. Brady, already 40 years old, will age, coach Belichik will retire, and the Bills and Giants will once again meet in the Super Bowl.

We’ve seen it in other sports: The UCLA Bruins under Wooden, the Celtics with Bill Russell, and the Yankees in the 1950s. Teams have great runs, but sooner or later they have losing records. This pattern transcends most facets of life. When we perceive something to be at a peak, we say it’s only a matter of time before it’s worse than it is today.

The stock market doesn’t play by these rules. It’s normal to think because the market is at an all-time high it must go down, but it mustn’t. The stock market and the Patriots have enjoyed similar recent success, but they will have different futures.

Markets go up over time. Since 1978, we’ve had 40 “year-ends.” Money invested in the S&P 500 has hit a new end-of-year-high in 27 of those 40 years. Having the stock market trading at or near an all-time high isn’t cause for panic; it’s common!

We just hit our sixth consecutive year of a new high. This is a great stretch, but in the 80s and 90s we saw runs of eight and nine years respectively. The current run could last for 12 years, or it could end this next year.

No one knows for sure what the market will do, but cash is a poor long-term investment and the stock market has rewarded those who stuck with it through the ups and downs. $1 invested 40 years ago is worth $80 today.

While markets go up over time, they do have temporary periods of declines. As investors, we need to determine the right diversified mix of stocks and bonds that allows us to benefit from being invested while protecting us when times are bad.

And when the stock market inevitably performs poorly, Tom Brady will be jealous. For unlike Mr. Brady, the stock market’s best days are still to come, but Brady is better now than he will be at 45. Well it’s Tom Brady, let’s say 50 to be safe.

As you are likely aware, Congress has recently passed significant changes to the tax law. These changes are effective beginning in tax year 2018, with many of the changes for individuals set to sunset after 2025. The summary below is a high-level overview of many of the most relevant changes that will impact people’s taxes. If you have questions relating to your specific situation, please contact your Rockbridge advisor. Also, keep an eye out on our blog for upcoming articles discussing our income tax planning process, and for more in-depth reviews of these new changes to the tax law.

Have you caught cryptocurrency fever, or are you at least wondering what it’s all about? Odds are, you hadn’t even heard the term until recently. Now, it seems as if everybody and their cousin are getting in on it.

Psychologists have assigned a term to the angst you might be feeling in the heat of the moment. It’s called “FoMO” or Fear of Missing Out. Education is the best first step toward facing FoMo and making informed financial choices that are right for you. So before you make any leaps, let’s take a closer look.

What is cryptocurrency?

Crytpocurrency is essentially a kind of money – or currency. Thanks to electronic security – or encryption – it exists in a presumably secure, sound and limited supply. Pair the “encryption” with the “currency,” and you’ve got a new kind of digital asset, or electronic exchange.

Well, sort of new. Cryptocurrency was introduced in 2009, supposedly by a fellow named Satoshi Nakamoto. His Wikipedia entry suggests he may not actually be who he says he is, but minor mysteries aside, he (or possibly “they”) is credited with designing and implementing bitcoin as the first and most familiar cryptocurrency. Ethereum is currently its second-closest competitor, with plenty of others vying for space as well (more than 1,300 as of early December 2017), and plenty more likely to come.

Unlike a dollar bill or your pocket change, cryptocurrency exists strictly as computer code. You can’t touch it or feel it. You can’t flip it, heads or tails. But increasingly, holders are receiving, saving and spending their cryptocurrency in ways that emulate the things you can do with “regular” money.

How does cryptocurrency differ from “regular” money?

In comparing cryptocurrency to regulated fiat currency – or most countries’ legal tender – there are a few observations of note.

First, since neither fiat nor cryptocurrency are still directly connected to the value of an underlying commodity like gold or silver, both must have another way to maintain their spending power in the face of inflation.

For legal tender, most countries’ central banks keep their currency’s spending power relatively stable. For cryptocurrency, there is no central bank, or any other centralized repository or regulator. Its stability is essentially backed by the strength of its underlying ledger, or blockchain, where balances and transactions are verified and then publicly reported.

The notion of limited supply factors in as well. Obviously, if everyone had an endless supply of money, it would cease to have any value to anyone. That’s why central banks (such as the U.S. Federal Reserve, the Bank of Canada, and the Bank of England) are in charge of stabilizing the value of their nation’s legal tender, regularly seeking to limit supply without strangling demand.

While cryptocurrency fans offer explanations for how its supply and demand will be managed, it’s not yet known how effective the processes will be in sustaining this delicate balance, especially when exuberance or panic-driven runs might outpace otherwise orderly procedures. (If you’re technically inclined and you’d like to take a deep dive into how the financial technology operates, here’s one source to start with.)

Why would anyone want to use cryptocurrency instead of legal tender?  

For anyone who may not be a big fan of government oversight, the processes are essentially driven “by and for the people” as direct peer-to-peer exchanges with no central authorities in charge. At least in theory, this is supposed to allow the currency to flow more freely, with less regulation, restriction, taxation, fee extraction, limitations and similar machinations. Moreover, cryptocurrency transactions are anonymous.

If the world were filled with only good, honest people, cryptocurrency and its related technologies could represent a better, more “boundary-less” system for more freely doing business with one another, with fewer of the hassles associated with international commerce.

Unfortunately, in real life, this sort of unchecked exchange can also be used for all sorts of mischief – like dodging taxes, laundering money or funding terrorism, to name a few.

In short, cryptocurrency, blockchain technology, and/or their next-generations could evolve into universal tools with far wider application. Indeed, such explorations already are under way. In December 2017, Vanguard announced collaborative efforts to harness blockchain technology for improved index data sharing.

That said, many equally promising prospects have ended up discarded in the dustbin of interesting ideas that might have been. Time will tell which of the many possibilities that might happen actually do.

Even if I don’t plan to use cryptocurrency, should I hold some as an investment? 

If you do jump in at this time, know you are more likely speculating than investing, with current pricing resembling a fast-forming bubble destined for collapse.

Bubble or not, there are at least two compelling reasons you may want to sit this one out for now. First, there are a lot of risks inherent to the cryptocurrency craze. Second, cryptocurrency simply doesn’t fit into our principles of evidence-based investing … at least not yet.

Let’s take a look at the risks.

Regulatory Risks – First, there’s the very real possibility that governments may decide to pile mountains of regulatory road blocks in front of this currently free-wheeling freight train. Some countries have already banned cryptocurrency. Others may require extra reporting or onerous taxes. These and other regulations could severely impact the liquidity and value of your coinage.

Security Risks – There’s also the ever-present threat of being pickpocketed by cyberthieves. It’s already happened several times, with millions of dollars of value swiped into thin air. Granted, the same thing can happen to your legal tender, but there is typically far more government protection and insurance coverage in place for your regulated accounts.

Technological Risks – As we touched on above, a system that was working pretty well in its development days has been facing some serious scaling challenges. As demand races ahead of supply, the human, technical and electric capital required to keep everything humming along is under stress. One recent post estimated that if bitcoin technology alone continues to grow apace, by February 2020, it will suck away more electricity than the entire world uses today.

That’s a lot of potential buzzkill for your happily-ever-after bitcoin holdings, and one reason you might want to think twice before you pile your life’s savings into them.

Then again, every investment carries some risk. If there were no risk, there’d be no expected return. That’s why we also need to address what evidence-based investing looks like. It begins with how investors (versus speculators) evaluate the markets.

What’s a bitcoin worth? A dollar? $100? $100,000? The answer to that has been one of the most volatile bouncing balls the market has seen since tulip mania in the 1600s.

In his ETF.com column “Bitcoin & Its Risks,” financial author Larry Swedroe summarizes how market valuations occur. “With stocks,” he says, “we can look at valuation metrics, like earnings yield. With bonds, we can use the current yield-to-maturity. And with assets like reinsurance or lending … we have historical evidence to make the appropriate estimates.”

You can’t do any of these things with cryptocurrency. Swedroe explains: “There simply is no tangible relationship between any economic or financial parameters and bitcoin prices.” Instead, there are several ways buying cryptocurrency differs from investing:

  • Evidence-based investing calls for estimating an asset’s expected return, based on these kinds of informed fundamentals.
  • Evidence-based investing also calls for us to factor in how different asset classes interact with one another. This helps us fit each piece into a unified portfolio that we can manage according to individual goals and risk tolerances.
  • Evidence-based investing calls for a long-term, buy, hold and rebalance strategy.

Cryptocurrency simply doesn’t yet synch well with these parameters. It does have a price, but it can’t be effectively valued for planning purposes, especially amidst the extreme price swings we’re seeing of late.

What if I decide to buy some cryptocurrency anyway?

We get it. Even if it’s far more of a speculative than investment endeavor, you may still decide to give cryptocurrency a go, for fun or potential profit. If you do, here are some tips to consider:

  • Think of it as being on par with an entertaining trip to the casino. Nothing ventured, nothing gained – but don’t venture any more than you can readily afford to lose!
  • Use only “fun money,” outside the investments you’re managing to fund your ongoing lifestyle.
  • Educate yourself first, and try to pick a reputable platform from which to play. (CoinDesk offers a pretty good bitcoin primer.)
  • If you do strike it rich, regularly remove a good chunk of the gains off the table to invest in your managed portfolio. That way, if the bubble bursts, you won’t lose everything you’ve “won.” (Also set aside enough to pay any taxes that may be incurred.)

Last but not least, good luck. Whether you win or lose a little or a lot with cryptocurrency – or you choose to only watch it from afar for now – we remain available to assist with your total wealth, come what may.


Stock Markets

Equity market returns over several periods ending September 30, 2017 are shown on the graph to the right. Here are a few highlights:

  • Stocks provided above-average returns over the past quarter – REITs lagged.
  • Non-domestic markets led the way in recent periods; over longer periods it was domestic markets.  While it would be nice to know which will do best in the future, no one does. We have to remain committed to all markets.
  • Note how after falling short previously, emerging market stocks have snapped back in recent periods.

Bond Markets

Yield Curves show the yield of U.S. Treasury securities over several maturities, from the short term (one month) to the long term (twenty years).  How these curves have changed over the recent past is shown below.

  • Since September 2016 yields have increased across all maturities, which is not surprising given the announced goals of Fed officials. Yields and bond prices are inversely related (when yields go up, prices come down and vice versa), which explains negative bond returns over the past year.
  • Today’s Yield Curve is flatter than what we saw at the beginning of the year.  The Fed can control only short-term rates; long-term yields generally reflect market results.  A flat yield curve can indicate that the market doesn’t believe the Fed can increase rates down the road in a more difficult economic environment.  Look how yields on longer-term securities have fallen slightly even though short-term yields increased.


On August 2, 2017, the Dow Jones Industrial Average set a record, closing above 22,000 for the first time. People will debate the cause of the rally and how long it will last, but there is only one answer that matters to the prudent investor – time.

Markets go up over time. Over the last 90 years, the S&P 500 (a better gauge of the U.S. stock market than the Dow) has seen 11 “bear markets” during which the index fell by more than 20% of its value. In four of these instances, the index fell by 48% or more, with the largest fall (86%) coming during the Great Depression. Despite these large declines in value, if you had bought and held from 1927 through today, you would have realized an annualized 9.9% return. The biggest losers were not people who failed to foresee Black Tuesday, the 1973 oil embargo, the dot-com bubble, or the financial crisis. They were people who were not invested.

The stock market is notoriously difficult to predict. On August 13, 1979, Businessweek ran a famous cover story titled “The Death of Equities.” Businessweek cited inflation, changing regulation, and an increase in investment alternatives as the reason America should “regard the death of equities as a near-permanent condition.” Over the next 20 years, the Dow would grow from 839 to 11,497, and investors in the S&P 500 would receive a 17.7% annualized return.

Twenty years after the Businessweek story, Kevin Hassett and James Glassman wrote Dow 36,000, a book articulating why the Dow would triple by 2005. Hassett and Glassman argued the cost of equity should be on par with treasury yields, leading them to conclude the “single most important fact about stocks at the dawn of the twenty-first century: They are cheap… If you’re worried about missing the market’s big move upward, you will discover that it is not too late.” In January 2005, the Dow closed at 10,490. Dow 36,000 now sells used for $0.01 on Amazon.

In addition to being unprofitable, market timing is also mentally punishing. If you were to sell out of your position now and, in a year, the market was 10% higher (Dow 24,200), would you get back in or keep waiting for the fall? If, instead, it was 10% lower in a year (Dow 19,800), would you stay on the sidelines in anticipation of more declines, or would you conclude the market had bottomed out? The challenge with market timing is that you need to be right twice – when you sell and when you buy back in. And remember, these price changes don’t count the 2% annual dividend large-cap stocks are paying.

Is today’s market overvalued? Your conclusion depends on your perspective. Over the last 7.5 years the S&P 500 has seen 13.3% annualized appreciation, suggesting today’s market is overvalued. However, since 2000, it has returned 4.9%, suggesting it’s undervalued. Since 1990, the market has returned 9.6%, on par with its 90-year average.

You can play the same game with price-to-earnings (P/E) ratios. Currently, the P/E ratio of the S&P 500 is high by historical standards, suggesting the market is overvalued. However, stocks look forward, not backwards, and the forward-looking P/E ratio is slightly overvalued but much closer to “normal.” Lastly, the earnings yield of equities (P/E’s inverse) relative to yields on long-term bonds actually makes stocks look cheap. Are stocks overvalued? It’s anyone’s guess.

The Dow has reached a new high because markets go up over time. However, there are periods where they go down. If you can’t financially afford or mentally stomach a 40% or greater decline in your portfolio, you shouldn’t be 100% invested in stocks. Find a risk profile that matches your needs, diversify from the S&P 500 to other markets such as small cap stocks, international stocks, and bonds, and stick with your allocation. Trying to outsmart the market leaves most people feeling foolish.

This article by Ethan was featured in the Central New York Business Journal.

While the Equifax security breach only recently became public knowledge on September 8, in many ways, it was a lifetime ago.

We were already on high alert for instances of identity theft. But the source, scope, and what seems like a justified feeling of betrayal associated with this particular breach have ushered in a new era of cybersecurity. There was before the Equifax breach; now there’s after.

What does “after” look like, and how can we help you navigate it? You’ve no doubt noticed a barrage of articles covering what has happened and what others suggest you should do about it. Unfortunately, there is no one-size-fits-all regimen, but here are some of the most frequently cited actions we’ve seen, along with our commentary on them:

Check your credit reports using annualcreditreport.com. Keeping an eye on your credit reports has long been a best practice, and should continue to be, today more than ever. Be sure to only use annualcreditreport.com. As the website says, it is the only provider authorized by Federal law to provide you with the free annual reports that already are rightfully yours. Also, so you can obtain a free credit report more than annually, consider staggering the three primary agencies’ reports, selecting one to review every four months.

Consider placing a fraud alert or a freeze on your credit. Deciding which (if either) of these actions makes sense for you depends on your personal circumstances. For example, if you’re frequently applying for credit, placing a freeze may be impractical. On the other hand, if you have been a victim of identity theft, an alert might not suffice. In this instance, it’s worth reading through the advantages and disadvantages before determining your next steps. We’re here for you as well, to serve as an additional sounding board.

Consider enrolling in a credit monitoring service. Equifax has offered to provide a year of free credit monitoring and identity theft protection via TrustedID Premier. We’ve seen mixed reviews on whether it makes sense to accept Equifax’s offer. First, there’s the whole trust issue raised by the recent breach. Plus, identity thieves have nearly endless patience, so one year of monitoring is only the beginning. That said, other independent services can be costly (especially if you’ve got an entire family to cover), and they may not ultimately offer much that you cannot do on your own if you so choose. It comes down to a cost/benefit analysis unique to you.

Regularly change the passwords and PINs on your financial accounts. Like regularly monitoring your credit reports, periodically changing your financial account login information has been and remains a best practice. Quarterly or at least twice a year makes good sense to us.

File your tax returns as early as you’re able. Filing early minimizes the opportunity for an identity thief to file a bogus return on your behalf.

We’ve seen other tips and pointers besides these, some of which may be advisable as well. To avoid informational overload, here are three guiding lights:

  • Pace yourself. As with any seemingly insurmountable challenge, it may be best to take things one step at a time, lest you lock up and end up doing nothing at all.
  • Patiently prevail. Approach your security as an ongoing process rather than a quick fix. After determining which actions make sense for you, set up a routine and a schedule for implementing them. Write down your plans, and then follow them.
  • Partner with us. We won’t go into sensitive specifics here but, as financial advisors, we have long been taking strong measures at our end to protect against hackers and identity thieves. That said, no system is impregnable. The more aggressively we join forces to thwart cybercriminals, the more likely we will ultimately prevail.

So, how can we help you moving forward? If you’d like to consult with us as you think through some of the points we’ve touched on above, we welcome the conversation. We also ask you to be responsive when we reach out to you with security-related questions or suggestions. For example, earlier this year, we produced a quick-reference and more detailed overview, “Avoiding Financial Scams and Identity Theft Slams,” filled with perennial information and best practices. We’d be delighted to share (or re-share) those materials with you.

As this wise educator observed in reflecting on the Equifax breach, “Security isn’t a product. It’s a process.” Just as sensible investing involves taking appropriate near-term steps in the context of an ongoing, personalized plan, so too do we find it increasingly imperative to respond to this and future cyberattacks with upfront planning, well-reasoned action and continued best practices. Let us know how else we can assist with that!

Stock Markets

The chart at right shows stocks performing well in the past quarter and six-month periods.  Year to date, domestic large-cap stocks were up about 9% while small-cap stocks were up 5%.  Stocks traded in international developed markets and emerging markets were up 14% and about 19%, respectively.

Over three, five and ten years, domestic markets (both large-cap and small-cap) were especially strong.  These results are starting to give rise to concerns of “irrational exuberance” and over-valuation in these markets.  Keep in mind, however, we could be observing a bounce off the sharp decline of 2008, one of the worst periods in stock market history.  So, what do we have now – “over-valuation” or “regression to the mean”?  Not so much exuberance in other markets.

The usual proxy for the domestic large-cap stock market is the S&P 500, a well-worn index that many consider representative of the total stock market.  Today the S&P 500 is skewed by well-known technology companies – Apple, Microsoft, Alphabet (Google) and Amazon make up the top four stocks, with Facebook coming in at number six.  Thus, the S&P 500 is more indicative of how the largest technology stocks fared versus stocks in general.

The chart shows the extent that markets fall in and out of favor through time, which provides an incentive to try and predict.  However, this is not something we recommend.  Instead, maintain commitments to each asset class and reap the benefits of diversification.  In any event, recent periods have been generally good for stocks.

Bond Markets

The Yield Curves chart at the right yields of U.S. Treasury securities across various maturities as of June 2017, June 2016 and December 2016.  Today’s curve is more pronounced and shown in green.  Notice how it has “flattened” – long rates are down and short rates are up.  Yields have increased over the past year resulting in a negative impact on bond returns over that period.

The rise in short-term rates is consistent with recent Fed activity.  Yields on bonds of longer maturities are market determined.  It has been, and continues to be, widely anticipated that the Fed will continue to increase interest rates.  Yet, longer-term bond yields have not increased.  This flattening of the Yield Curve can be a harbinger of difficult times ahead as the market may be telling us they don’t expect the Fed will be able to increase rates.  We’ll see.

Stock values have been climbing almost uninterruptedly over the recent past.  Bonds have not.  This record is consistent with the long-held maxim that if you can stand the heat, stocks will eventually outperform bonds.  The recent track record, along with this widely held belief, has some wondering why hold bonds at all.

While stocks look good, there are still reasons to hold bonds.  First, bonds reduce volatility, which can make it easier to remain committed to a given risk strategy over the long term.  Failing to do so means not realizing the positive long-term returns of stocks.  In some periods, maintaining an allocation to bonds provides a better outcome.  (A portfolio with a 30% allocation to bonds did better than an all stock portfolio in 27% of the ten-year periods since 1926.)  Prudence means not taking unnecessary risks and matching a portfolio’s profile to established long-term goals – bonds help do that.

Young or old, wealthy or poor, online or in person … Nobody is immune from financial scams and identity theft slams. No matter who you are or how well-informed you may be, the bad guys are out there, daily devising new tricks for every fraud we fix.

Who Are They? Fraudsters and Thieves

  • Financial fraudsters are after your assets.
  • Identity thieves want to steal your personal information – usually, so they can commit financial fraud by posing as you and breaching your security.

What Do They Want? Your Money and Your Life

Some of your most treasured personal information includes:

  • Social Security Numbers, passports, driver’s licenses and similar identifying information.
  • Financial account and credit card numbers.
  • Passwords (or insights about you that help them guess at weak ones).
  • Your and family members’ contact information (name, address, phone, email).
  • Your and family members’ birth dates.
  • Details about your life (interests, travel plans, relationships, your alma maters, etc.).

How Will They Get It? However They Can!

Criminals come in all shapes and sizes, and will use anything and everything that might work:

  • Most mayhem occurs the same, old ways: the real or virtual equivalent of strong-arm theft; breaking and entering; and increasingly, scams that trick you into giving your goods away.
  • They may be strangers. They may pose as someone you know. Unfortunately, they can be someone you do (Elder abuse, for example, is often perpetrated by family members.)
  • They may commit their crimes online, by phone, in the mail (to a lesser extent) or in person.
  • Phishing emails and deceitful or compromised websites try to trick you into clicking on bad links or opening infected attachments. This exposes you to malware which infects your device with anything from harmless pranks to damaging viruses to serious security breaches.

What Should You Look For? Ten Red Flags

Criminal techniques may be new-fangled, but the tactics – the red flags to look for – are mostly unchanged. Whether online, in the mail, on the phone or in person, be on extra alert whenever:

  1. An offer sounds too good to be true.
  2. A stranger wants to be your real or virtual best friend.
  3. Someone you know is behaving oddly, especially via email or phone. (This may mean it’s an identity thief, posing as someone you know.)
  4. Someone claiming to represent a government agency, financial or legal firm, police department or other authority contacts you out of the blue, demanding money or information.
  5. You’re feeling pressured or tricked into responding RIGHT AWAY to a threat, a temptation or a curiosity.
  6. You’re prioritizing easy access over solid security (weak or absent locks and passwords).
  7. You’re sharing personal information in a public venue (including social media).
  8. Facts or figures aren’t adding up; bank statements, reports or other info is missing entirely.
  9. Your defenses are down: You’re ill, injured, grieving, experiencing dementia or feeling blue.
  10. Your gut feel is warning you: Something seems off.


An Action Plan (Hint: It’s a Lot Like Evidence-Based Investing)

The more of these sorts of alarm bells are sounding off, the more suspicious you should be. What then? The hardest part may be deciding where to begin. We recommend approaching your personal security the same way you approach investing: Instead of feeling you must immediately chase every defensive action out there, start with a plan.

  • Base your plan on how and why identity theft and financial fraud occurs, as described above.
  • Include broad strokes as well as specific action items.
  • Pay extra attention to the risks that pose the greatest threats to you and your lifestyle.
  • Whenever new tricks, techniques and technologies emerge, refer to your plan as a dependable framework in which to consider your next best steps.

What Else Can You Do? Quite a Lot!

While criminals are forever finding new ways to foil our defenses, there are still plenty of sensible steps you can take to protect yourself and your money.

Online Protection

  • Virus software: Install anti-malware and anti-spyware software on all of your devices. Keep it and your operating system current!
  • Backups: Use backup software for system and/or file recovery as needed. Allow for multiple version backups, in case you need to go back in time for a safe recovery.
  • Passwords: Create strong, unique passwords for each of your devices and accounts (long, random combinations). Periodically change them, especially on financial and other sensitive accounts, and whenever you may “smell a rat.” Consider using password management software to securely track them. An application we like to use is LastPass.
  • Extra security: Employ extra security when available, such as two-step verification or biometrics (fingerprints). Starting June 10, 2017, the Social Security Administration will require a second method of authentication in the form of a text message or email code when logging into your ssa.gov account. This will help better protect your account from unauthorized use and potential identity fraud.
  • Hyperlinks and attachments: In emails or on websites, be incredibly cautious about clicking on links or opening attachments, especially from unfamiliar sources. Refer to our “Ten Red Flags” to help spot the most suspicious ones.
  • Social media: Privatize your social media profiles and activities so only those you allow in can see them.
  • WiFi: Be extra careful on public WiFi connections outside of your home or business. Don’t conduct sensitive transactions on them; assume the world can see anything you’re doing.

Suspicious Phone Calls

  • Identify: Whenever a stranger calls you out of the blue demanding or enticing you into sending money or sharing information, it’s probably a scam. Even when a caller claims to be someone you know, if their requests seem urgent, unusual, or emotionally charged – watch out. It’s probably an identity thief in disguise.
  • End the call: Your best line of defense is to immediately hang up. Don’t engage in conversation; you may accidentally divulge information a con artist can then use against you.
  • Don’t cooperate: Unless you initiated the call, never share your credit card number or any other sensitive information, especially in response to an urgent threat or enticing “prize.”
  • Investigate: Do what you can to verify the caller’s legitimacy. For example, if they claim to be from the IRS, end the call and contact the agency directly to inquire further. If they claim to be a family member in distress, tell them you’ll call them back and then call a close relative to double check. Google the suspicious number to see if others have reported it.
  • Report: Report the suspicious number to federal authorities.

Credit and Records Management

  • Watch for inconsistencies: Whether you’re receiving banking, credit card and investment statements online or in the mail, scan each one for odd or unfamiliar transactions.
  • Watch for missing statements: If statements you were expecting to receive suddenly stop arriving, a financial fraudster might have pirated your account and redirected it elsewhere.
  • Monitor your credit reports: Take advantage of your right to request free annual credit reports from AnnualCreditReport.com. Review them carefully for inaccuracies.
  • Consider a credit freeze: If you rarely apply for loans, you may want to freeze your credit, unlocking it only when needed. It costs a bit, but shuts out identity thieves cold.
  • Follow up promptly: If something seems “off,” immediately change any login passwords, and promptly contact the service provider and appropriate federal authorities.

Personal Security

  • Remain on guard: Don’t assume you’re safe just because you’re not online. There is still plenty of old-fashioned theft going on.
  • Secure it: Secure any paperwork you must keep. Lock up your home, desk, file cabinets, car, mailbox and trash bins. (Identity thieves will “dumpster dive” to steal your stuff.)
  • Shred it: Use a shredder to destroy any paperwork you do not need to keep.
  • When you’re out and about: Keep a close eye on your purse or wallet (at work and social events, in the gym and stores, and so on). Avoid keeping personal identification in your car.
  • Filling in forms: When filling out medical forms, credit card applications and similar paperwork, only provide what is essential. Don’t provide your Social Security Number on initial request, and push back if pressed for it. It’s rarely actually required.
  • Banking: When using an ATM machine, be aware of others around you and avoid using one that looks like it might have been tampered with.

What If They Succeed? Act Promptly

If you believe you’ve been exposed to identity theft or financial fraud, time is of the essence.

  • Online: If it’s an online event, immediately change the passwords on any affected accounts. It may help, and it certainly can’t hurt. Your multi-version backups might come in handy too.
  • In general: Check in with any bank or other institution involved, and the government agency responsible for overseeing the breach: the IRS for tax fraud, or the FTC for anything else.
  • Financial: If you feel your financial security has been compromised, we’ll want to hear from you as well! We’ll do all we can to help you fix the breach and minimize any damage done.


Stock MarketsThe Diversification Story April 17

The accompanying chart illustrates the diversification story. It shows returns in several markets over both the March and December quarters. The upward sloping blue columns of the December 2016 quarter show an increase from the low (4% loss) in emerging markets to the high (14%) for the market of small-cap value stocks. Note the variability of returns in these different markets. Now, look at the gray columns of the March quarter and how they decrease across the same markets from a high (13%) for emerging markets to a low (1% loss) for small-cap value stocks. Just the opposite is happening. If you couldn’t predict how these different markets would fare, then to achieve the positive returns stock markets provided over the last two quarters, you had to have commitments to each. This is the diversification story.

A longer perspective is provided in the accompanying Equity Market Returns chart. As you can see, the variability among the different markets tends to lessen over longer periods. Yet, even over the ten years, variability remains. Generally speaking, ten years is a short period in capital markets, and it takes courage to remaEquity Returns 3 31 17in committed to markets that have produced below average returns for ten years. The fact that international developed markets have languished over the past ten years tells us very little about the future in this market sector. Yield Curves 3 31 2017

Bond Markets

A Yield Curve shows bond yields across a spectrum of time to maturity. These curves can be useful for both providing some sense of what is expected for future interest rates and understanding recent changes. One thing we see this time is a persistent increase in yields across shorter maturities over the three periods. These changes reflect what the Fed has been doing to increase rates. While yields of longer-term bonds have increased since March 2016, primarily in response to the Election, there is little change over the last quarter even in the face of increasing short-term rates. Changing expectations for future inflation helps to explain this lack of movement in longer-term yields.

On March 15, 2017, the Federal Reserve increased interest rates for just the third time since the financial crisis in 2008-2009. Investment theory tells us when interest rates rise, bond prices fall, so rising interest rates are bad for bond returns. However, bonds have performed well since the Fed raised rates a few weeks ago… WHY?

Looking closer, we see that most interest rates fell after the Fed raised rates:

Yield Numbers 4 2017

Fed Controls Short End of the Curve

If you plot this data on a graph, you will see the yield curve – an upward sloping line that shows higher rates for longer maturities. When the Fed raised rates, the curve “flattened,” meaning short-term rates rose slightly while long-term rates dropped slightly. The yield curve is constantly changing shape, and is not always upward sloping – it is referred to as inverted when short-term rates are higher than long-term rates.

Markets Anticipate

The Fed raised rates by 0.25% and the one-month treasury rate went up 0.06% because everybody knew that the Fed was planning to raise rates; the change was already factored in almost entirely. There was some small chance the increase would be delayed, so there was still room for a small increase when the change became certain.

Inflation Expectations Drive Long-Term Rates

What markets did not anticipate was a Trump Presidency, so there was a significant jump in longer-term rates immediately following the Election last Fall. Inflation expectations drive long rates, and President Trump’s proposals to cut taxes and spend billions on infrastructure are perceived as inflationary. Inflation happens when there are too many dollars chasing too few goods, and prices rise.

Monetary Policy

Theory suggests that cheap money promotes economic growth, which creates more jobs. However, as the economy approaches capacity and full employment, demand for goods and services exceeds supply; the result is unwanted inflation. The mission of the Federal Reserve is to maintain the ideal equilibrium between full employment and price stability through monetary policy.

If the Fed is too slow to raise rates and cool down rapid economic expansion, the market can push long-term rates up in anticipation of higher inflation. This is driven by the fact that investors want an interest return that exceeds inflation and compensates them for taking risk. So even if risk stays the same, they demand a higher rate when inflation expectations rise.

In the current economy the opposite seems to be true. The market is concerned that any increase in rates will dampen an already sluggish economy, putting even less pressure on rising prices. So the Fed raised rates… but interest rates went down.

Conclusion

It is important to remember, as recent events illustrate, bond returns are not directly impacted by the Fed Funds Rate. Through monetary policy the Fed can influence economic growth, and inflation expectations, but the linkage is not very solid. In the aftermath of the financial crisis they were left “pushing a string” – the Fed Funds Rate went to zero, they pumped up money supply, and economic growth and employment still collapsed. Similarly in today’s economy, monetary policy may be important, but its impact can be easily overshadowed by fiscal policy (taxes and government spending). The bottom line – Do not necessarily assume that bond returns will suffer every time the Fed raises rates.

Stock Markets

While markets were down early in the quarter, most, but not all, have bounced back since the Election with small company stocks and value stocks leading the way.  Stocks trEquity Returns 12 31 16aded in international markets and emerging markets have not fared as well in this period, reflecting a strengthening of the dollar. This means a globally diversified stock portfolio would not have done as well as what might be implied by the media hype.

While not everyone looks back at 2016 with delight, the past year was not bad for stocks – especially domestic stocks.  These stocks, as well as emerging market stocks, were up over 12% (small cap stocks up 21%) for the year.  Stocks traded in international developed markets lagged, earning just 1.5% for the year.

The accompanying chart that displays not only recent, but also longer-term results, is a picture of the effects of diversification.  Look at how some markets are up and others are down, but they tend to even out over longer periods.

Bond Markets

The accompanying chart of Yield Curves tells us a couple of things.  First, look at how yields for maturities greater than five years jumped nearly 1% since September 30, 2016.  Increasing yields will drive bond returns down – the longer the time to maturity, the bigger the drop.  This means we have losses from bond investments this quarter, especially from bonds with longer periods to maturity.  Increased yielYield Curves 12 31 16ds at the short end are consistent with the Fed’s recent vote to increase short-term rates; the increases over longer periods have more to do with expectations for economic growth and inflation.

Second, these Yield Curves show a relatively minor year-over-year change.  While in 2016 long-term bonds did earn over 4%, reflecting the drop in yields earlier in the year, returns from both intermediate-term and short-term bonds were about flat. Bond market allocations just haven’t contributed much in recent periods – stocks have carried the day.  This will not always be the case.

There is much talk and concern about increasing interest rates, which will not be good for bond performance.  Below are responses to some of the specific questions we have received from clients.

Q:  Why have interest rates increased since the election?

A:  Many of the ideas put forth by President-elect Trump are perceived to be inflationary. Spending more on infrastructure and defense while cutting taxes would increase the federal deficit and create inflationary pressure.

Q:  The Federal Reserve recently increased the federal funds rate and says it will likely do so again in 2017. Is this the beginning of a long-term upward movement in interest rates?

A:  Not necessarily. The Fed has limited control over interest rates, particularly longer-term rates.  The Fed sets the federal funds rate, which determines the cost for banks to borrow and lend money overnight.  Other interest rates are determined by investors in the market.  When markets expect higher inflation, there is upward pressure on interest rates, and because markets anticipate the future, the increase in rates can occur well before the deficits or actual inflation appears.  The longer-term trend depends on how those expectations change in the future.

Q:  What are “normal” interest rates, and when might we see them again?

A:  Historically, short-term rates tend toward a level that offsets inflation, so an investor leaving money in a money market account does not earn much, but avoids the loss of purchasing power due to inflation. If inflation is around 2%, normal short-term rates might be 2-3%, which is consistent with Fed expectations.  Minutes from the December meeting of the Federal Open Market Committee say members expect “that the appropriate level of the federal funds rate in 2019 would be close to their estimates of its longer-run normal level” and their projections were 2-3%.  Investors need an incentive to tie up their funds for longer periods, and they tend to expect 2-3% more than money market returns, so “normal” for ten-year treasury bonds might be 4-6% when inflation is around 2%.

Q:  Why have some of my bond funds lost more value than other bond funds?

A:  The value of long-term bonds is affected more than the value of short-term bonds when interest rates change. This is a simple economic reflection of opportunity cost – if your money is in cash when rates rise, you can take advantage of higher rates right away, but if your money is tied up in a long-term bond, you have to wait for it to mature.  The fact that you will earn less while waiting for the bond to mature is reflected in the immediate change in value.  If another investor buys the bond from you at the reduced market price, their return reflects the new higher interest rate.  Bond funds reflect the change in market value so investors can get in and out of the fund without harming other shareholders.

Q:  Do the recent declines in value reflect a permanent loss in the value of my bond funds?

A:  Not really. Like in the example above, the bond fund is just a collection of individual bonds with different maturities.  If one of the underlying bonds is held to maturity, it still returns the face value and the interest earned is equal to the amount originally “bargained for.”  The lower market value reflects the fact that new investors demand a higher return over the remaining life of the bond because interest rates are now higher.  The past year provides an interesting example.  On January 1, 2016, the yield on a total bond market index fund was around 2.5%.  Rates dropped, and by the end of September, bond funds were reporting year-to-date returns of 6%, because bond prices had increased.  Post-election interest rates jumped, bond values dropped, and bond funds ended the year with returns of about 2.5% for the year.  For long-term investors the unrealized gains and losses are not permanent – they are just a reflection of the changing opportunity cost of holding bonds rather than cash that can be reinvested immediately.

Q:  Given that we don’t know where interest rates are headed, or how soon we might get back to “normal,” how should my fixed income portfolio be structured?

A:  The specific answer always depends on your specific situation, but generally we think markets are still the best prediction of the future – sometimes a poor prediction, but the best we have.  So we think investing in bonds is important to provide stability to your portfolio, and taking the interest rate risk of the total bond market is likely to provide modest, positive returns, with reasonable levels of volatility.

In 2016, Rockbridge welcomed 145 new families to our community of clients.  We ended the year helping clients manage $552 million of investment assets.  This represents an increase of 12.4% over last year.  We continue to evaluate our staffing to provide the high level of service that our clients have come to expect from our firm.

Building a Sustainable Business for Our Clients

Last year, we continued to explore ways to strengthen our partnership and build a sustainable business that our clients can rely on for many generations.  During the first half of the year we worked with The Leading Element, a local consulting firm, which provided valuable insights on leadership and strategic planning for our leadership team.

The People of Rockbridge

Kevin Sullivan joined the firm in 2016 as a lead advisor.  Kevin brings 25 years of experience in the financial services industry.  We look forward to Kevin’s success within the firm.

Claire Ariglio and Dave Carroll spent a good portion of the year studying for the Certified Financial Planner (CFP®) exam.  They both plan on sitting for the test in early 2017.

We continue to invest in professional development:  specifically, attending the NAPFA fee-only advisors conference in Washington, D.C. and contributing to our advisor study group that meets quarterly in New York City.

Ongoing Awareness Campaign

Our growth can be traced directly to two main sources:  referrals from clients and web searches for fee-only advisors.  Delighted clients often refer friends and family to our firm, and prospective clients looking for advice find our website while researching advisors.

Our marketing plan includes improvements to our website which ranks #1 in the Syracuse market for investment advisors and financial planners.

We also advertise our fiduciary advisor services on local radio and television, including a billboard ad in the Syracuse Hancock International Airport.  Many of our new clients now know our name when they decide to come in for an initial consultation.  We plan on continuing our modest allocation of resources to more of the same advertising in 2017.

Who We Are

At Rockbridge, our business is built around our commitment to client care.  We start each planning engagement with our clients by focusing on what they want:

Fiduciary– We’re legally obligated to advise strictly and exclusively in your highest interest, period.

Fee-only– Our sole compensation comes from clearly disclosed fees that are a percentage of the wealth we manage for you.  We reject all commissions or other forms of outside compensation.  You are the only person who compensates us for our advice to you, and we think that’s in your best interest.

Right-sized– We’ve grown our firm to complement our clients’ needs with a sensible balance of investment advisors, financial and retirement planners, service support, and office administration designed to fully address client needs.

We continue to remain focused on providing the best experience for our clients, and we sincerely thank you for your trust and confidence.

Markets in November

The campaign is finally over and Donald Trump won.  Markets respond to surprises and this result was one.  Tuesday night I, along with many others, anticipated a starkly negative response.  Yet, most, but not all, stocks went up and have generally stayed there.  Domestic small company stocks and value stocks responded big – up in the neighborhood of 15% for November.  On the other hand International stocks and especially stocks traded in Emerging Markets were off.  Bond yields shot up producing a drop in prices and negative bond returns for the month.  Surprising many, domestic markets seem to expect a Trump administration will be positive for stocks.

Expectations from a Trump Administration

Expectations about the future drive stock prices; surprises produce changes.  So, what’s the market expecting from the election of Donald Trump?  Here are some thoughts:

Expectations for increased government spending as well as tax cuts.  These changes could not only increase expected inflation, but also provide cover for the Fed to raise interest rates.  An increase in expected inflation explains the rise in bond yields producing a falloff in bond prices and negative returns.  Increases in domestic interest rates can drive up the value of the dollar, which helps to explain negative returns across international markets.

Expectations for an improved domestic manufacturing environment from a review of trade policy, immigration policy and globalization – “bringing back jobs”.  An expected improvement in basic industries would help to explain the sharp rise in stocks of smaller and value companies traded in U.S. Markets.  On the other hand, a more restrictive domestic trade policy is apt to hurt companies with stocks trading in Emerging Markets.

Expectations for a more benign regulatory environment, which is apt to have a positive impact on the stocks of most companies traded in domestic markets, especially those of large financial companies.  A portfolio of the largest U.S. banks was up 18% in November.

While these expectations produced positive environment for domestic stocks today, no doubt, there will be surprises along the way.  While the Republicans have both Houses of Congress and the Presidency, there are still Democrats.  Donald Trump has no clear mandate to implement given polices, except to upset the status quo.   No one knows what that means.  A more or less clean slate gives people the opportunity to make their own interpretation about how he will govern, which is apt to lead to disappointment as the future unfolds.  We’ll see.

Whether you find the election results exciting or shocking, we are now faced with the question, “What’s next?”

With respect to your investments, here’s a quick reminder of how we feel about that:  Ample evidence informs us that it is unwise to alter your long-term investment strategy in reaction to breaking news, no matter how exciting or grim that news may seem, or how the markets are immediately responding. Markets constantly process information, and security prices incorporate new or changing risks. Markets have proven far better than others in pricing these risks and determining fair value at any point in time. As we saw with the unexpected outcome of this summer’s Brexit referendum, the biggest surprise may be how resilient markets tend to be, as long as you give them your time and your patience.

In other words, if you feel you want to make changes to your investment portfolio in the aftermath of Tuesday’s election results, please be in touch with us first, so we can do the job you hired us to do. Specifically, you can count on us to advise and assist you based on our professional insights, your personal goals and – above all – your highest financial interests.

In the meantime, consider these words by billionaire businessman and “stay put” investor Warren Buffett, from his 2012 letter to Berkshire Hathaway shareholders:

“America has faced the unknown since 1776. It’s just that sometimes people focus on the myriad of uncertainties that always exist while at other times they ignore them (usually because the recent past has been uneventful). American business will do fine over time. And stocks will do well just as certainly, since their fate is tied to business performance. Periodic setbacks will occur, yes, but investors and managers are in a game that is heavily stacked in their favor…The risks of being out of the game are huge compared to the risks of being in it.”

Buffett published these sentiments on March 1, 2013, shortly after the last presidential election cycle. If you review the volume of his writings, you’ll find that he has expressed similar viewpoints on many occasions and through many markets, fair and foul.

Presidential terms are four years long. Your investment portfolio has been structured to last a lifetime. Remember that as you consider your personal “What’s next?” … and please call us if we can assist.

Stock Markets

It was a pretty good quarter for stocks, with the riskier small-cap and emerging market stocks leading the way.  REIT’s gave back some of their robust returns of prior periods.  The year-to-date numbers for stocks are solid as well.equity-market-returns-9-30-16

The riskier markets have done better this quarter, which is consistent with an increased appetite for risk.  One concern is that much of the recent returns can be explained by the need to reach for risk to expect any sort of return. This can lead to a general mispricing of risk.  Consequently, these excess returns are apt to be temporary.

The grey bar showing international markets in the above chart, except for the most recent quarter, hasn’t reached the heights of other market returns.  It shows that this market has not kept pace with others over these periods.  However, be careful as it says nothing about future returns from international markets.

Bond Marketsyield-curves-10-2016

The accompanying yield curves chart shows the yield to maturity of Treasury securities of various maturities.  Note the little change over the September quarter, which is consistent with a more or less flat bond market.  Yields for longer maturities have fallen since the beginning of the year, which reflects the relative attractiveness of U.S. Treasury securities in a world of negative interest rates.

Credit spreads (the difference between yields on corporate bonds versus comparable Treasury securities) have declined over the past quarter resulting in positive returns from investment grade corporate and especially high yield bonds.  These declines are consistent with our theme of an increased appetite for risk.

The Value of Capital

I am usually skeptical of suggestions that we are entering a “new normal.”  Yet, a case might be made that this time it’s different.  The axiom that capital has value can be questioned – Central Banks can’t seem to give it away!   Interest rates are the “price” of capital – it’s what’s paid to use capital.  Interest rates near zero and, in some places, negative provides an indication of the value of capital today.

Central Banks worldwide, including the Fed, are not shy at providing capital at little or no cost.  Banks are holding massive amounts of reserves; there is little appetite for rebuilding infrastructure and many corporations are finding the best use of capital is to buy back stock.  Furthermore, in developed economies, human capital – not physical capital – is more of a driver of economic growth today.  Apple, Microsoft, Facebook, Google and Amazon are relatively new names among today’s largest corporations, each of which is engaged in managing human capital primarily.  This shift away from physical capital helps to explain the decline in demand and is consistent with a lower price of capital into the future.  Perhaps a new normal.

This apparent reduced value for capital has implications for investors.  First, is this really a new normal or is it temporary?  Second, what is the impact on the price of risk going forward?  Third, can we earn the returns of the past by judiciously managing risk, or will we have to accept reduced expected returns going forward?  Fourth, are markets signaling deflation ahead?

As I said, I am generally skeptical of paradigm shifts and suggestions of a new normal.  We have to deal with a lot of random behavior, and capital markets can be out of whack for extended periods.  The current distortion could simply be the result of Central Banks acting alone without changes in fiscal policy to produce economic growth.  Consequently, we must be careful about shifting our ideas about how the world works in response to what could turn out to be temporary aberrations.


With less than a month to go before the Presidential election, many clients and friends have asked me how the markets will respond to the voters’ choice.  While there will be no shortage of prognostications in the media, investors would be well served to avoid speculating.

Trying to outguess the market is often a losing game.  All of the current information and polling on the election is baked into current stock market prices.  Major market fluctuations usually occur when unexpected events happen.  As of today, we expect either Clinton or Trump to be our next President.  So stock prices reflect that reality to a large degree.

History tells us that markets provide substantial returns over long time periods regardless of which party holds the Presidency.  So for “buy and hold” investors, the best advice is to “do nothing” and let the markets work for you.  The underlying reasons for investing your wealth in the stock market have not changed.

presidents-stock-market

Generating excess returns or limiting losses based on the election results will likely be the result of random luck.  However, those decisions can be very costly to the long-term investor who may make the wrong moves based on the short-term news cycle.

The highest probability of long-term investment success remains the same: identifying your personal goals and objectives; creating and sticking to a diversified asset allocation plan using low-cost evidence-based investments; and rebalancing regularly.

October is National Cyber Security Awareness Month.  With more and more financial transactions happening online, we wanted to share a very helpful infographic (shown below).  Please be mindful of the personal information you provide online!

How to Recognize and Avoid Phishing Attacks Infographic

Infographic by Digital Guardian

Back in August, the Social Security Administration added a new step in order to protect the privacy of those who use my Social Security, the online platform to view personal Social Security information.

When you sign in at www.ssa.gov/myaccount, you will now be asked to add your text-enabled cell phone number. You will then receive a text with a one-time security code that you must enter in order to access your account. Each time you log in to your account, you will have to complete two steps going forward:

Step 1: Enter your username and password

Step 2: Enter the security code Social Security texts to your cell phone

The new requirement is the result of an executive order for federal agencies to provide more secure authentication for their online services, such as “multi-factor authentication.” Using a one-time security code in conjunction with your username and password is an example of multi-factor authentication. This extra layer a security is just another step in proving that you are the actual owner of the account so your private information is kept safe.

Unfortunately, if you do not have a cell phone or do not wish to give out your cell phone number, you will not be able to access your my Social Security account under this new method. If you need to contact Social Security for any reason, you can do so here.

To learn more, please review the Frequently Asked Questions page.

It’s no surprise that this year’s U.S. presidential race has become a subject of conversation around the globe. In “Why Our Social Feeds are Full of Politics,” Canadian digital marketing executive Tara Hunt observes, “American politics, it seems, makes for high-intensity emotions far and wide.” The intensity will probably only increase as the November 8 election date nears.

We are by no means endorsing that you ignore what is going on in the world around you. Politics and politicians regularly and directly affect many aspects of our lives and our pocketbooks. But as you think through this year’s raucous race, remember this:

The more heated the politics, the more important it is to establish and maintain
a well-planned, long-term approach to managing your investments.

So go ahead and talk politics all you please – and if you are an American, be sure to vote. But when it comes to your investments, it’s best to ignore any intense emotions and the dire or ebullient predictions that spring from them, as dangerous distractions to your financial resolve.

THINKING IN STAGES

Have you ever heard of stage-one and stage-two thinking? They’re terms popularized by economist Thomas Sowell in his book, “Applied Economics: Thinking Beyond Stage One.” Basically, before acting on an event’s initial (stage one) anticipated results, it’s best to engage in stage-two thinking, by first asking a very simple question:

“And then what will happen?”

By asking this question again and again, you can more objectively consider what Sowell refers to as the “long-run repercussions to decisions and policies.”

INVESTING IN STAGES

In investing, we see stage-one thinking in action whenever undisciplined dollars are flooding into hot holdings or fleeing immediately risky business. Stage-two thinking reminds us how often the relationship between an event and the world’s response to that event is anybody’s guess and nobody’s certain bet. A recent Investopedia article, “Does Rainfall in Ethiopia Impact the U.S. Market?” reminds us how market pricing works:

“No one knows how any of these events will impact markets. No one. That includes financial advisors who have access to complex computer models and investment strategists in the home office with cool British accents. They don’t know, but their livelihood depends upon appearing to know. Few of them are ever held accountable for the innumerable predictions they got wrong. They simply move on to the next prediction, the next tactical move.”

Investors should avoid trying to predict future market pricing based on current market news.

REFLECTIONS ON PRESIDENTIAL ELECTIONS

Stage-two thinking is especially handy when considering the proliferation of predictions for anything from financial ruin to unprecedented prosperity, depending on who will next occupy the Oval Office.

Again, the problem with the vast majority of these predictions is that they represent stage-one thinking. As financial author Larry Swedroe describes in a US News & World Report piece, “Stage one thinking occurs when something bad happens, you catastrophize and assume things will continue to get worse. … Stage two thinking can help you move beyond catastrophizing. … [so you can] consider why everything may not be as bad as it seems. Think about previous similar circumstances to disprove your catastrophic fears.”

In the current presidential race, we’re seeing prime examples of stage-one thinking by certain pundits who are recommending that investors exit the market, and sit on huge piles of cash until the voting results are in. At least one speculator has suggested that investors should move as much as 50 percent of their portfolio to cash!

And then what will happen?

Here are some stage-two thoughts to bear in mind:

  • Regardless of the outcome of the election, there’s no telling whether the markets will move up, down or stay the same in response. By the time they do make their move, the good/bad news will already be priced in, too late to profit from or avoid.
  • In the long run, the market has moved more upward, more often than it moves downward, and it often does so dramatically and when you least expect it.
  • Moving to cash would generate trading costs and potentially enormous tax bills. Worse, it would run contrary to having a sensible plan, optimized to capture the market’s unpredictable returns when they occur, while minimizing the costs and manageable risks involved.

In this or any election, stage-two thinking should help you recognize the folly of trying to tie your investment hopes, dreams, fears and trading decisions to one or another candidate. Politics matter – a lot – but not when it comes to second-guessing your well-planned portfolio.

Stock Markets

Just look at the short-term variability in the various equity indices shown in the accompanying chart.  It shows how markets behave through time – some markets are up substantially while others are down.  Of course, this variability is reduced by holding a commitment to each, but it means periodically enduring down markets while appreciating the positive results of others.

Look at the ten-year period where all equity indices are positive.  Even in this relatively long period, proxies for international developedEquity Returns 6 30 16 
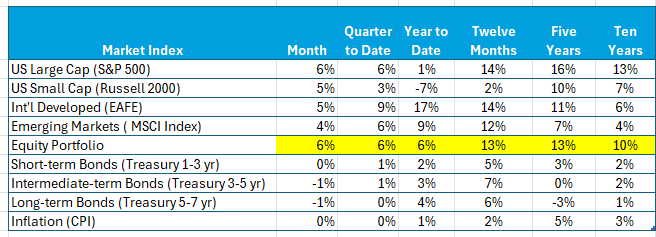
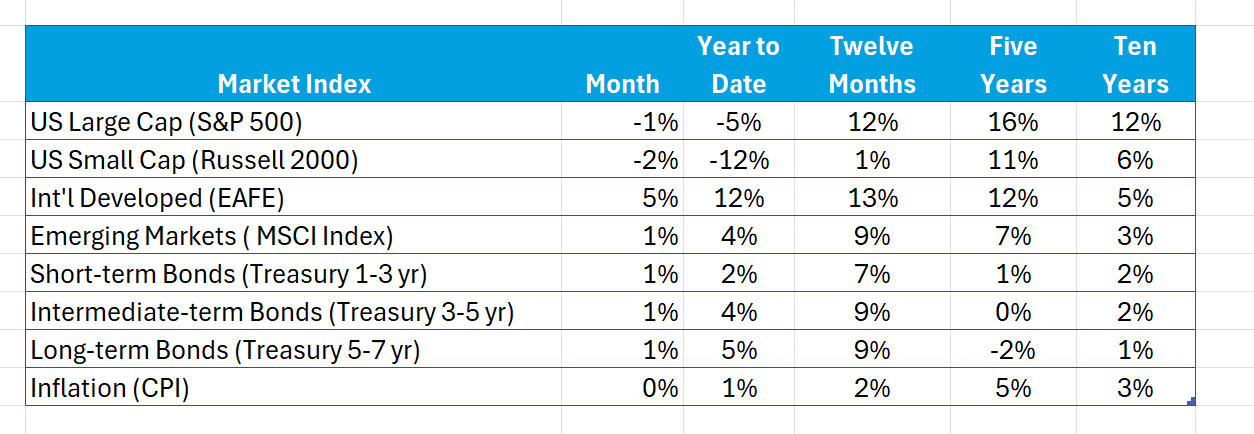
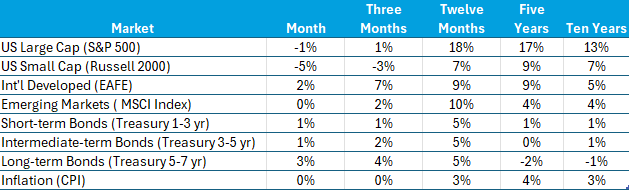
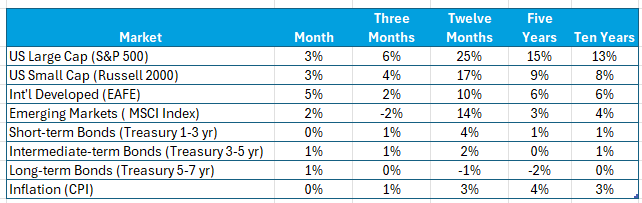
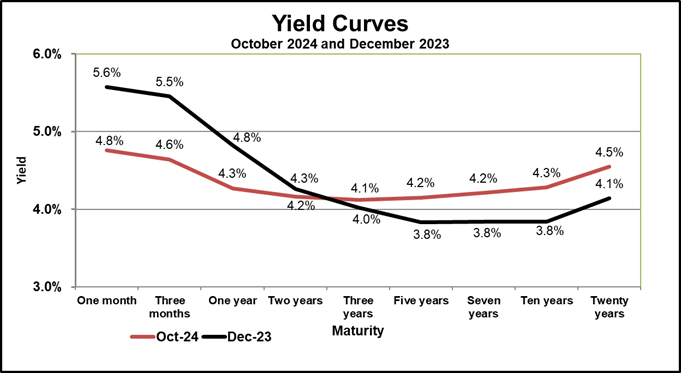
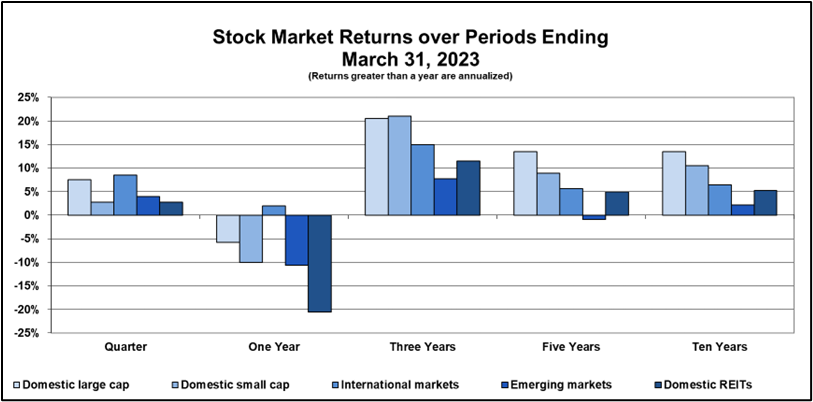
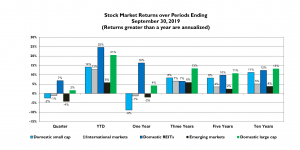
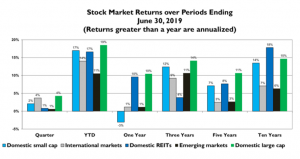
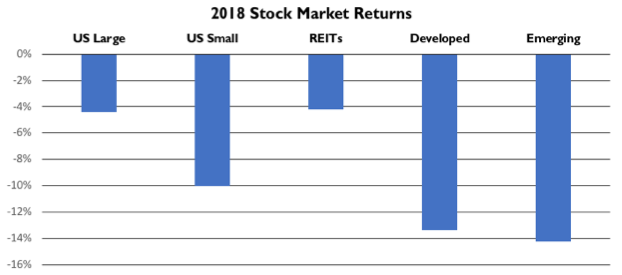
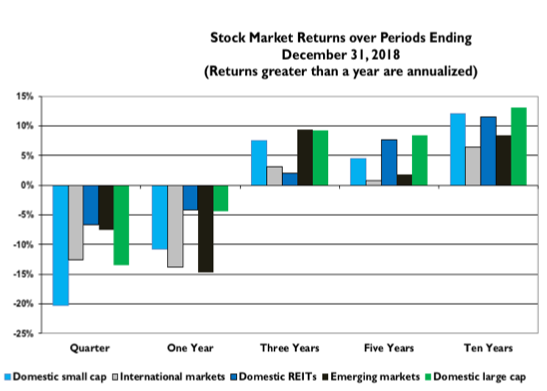
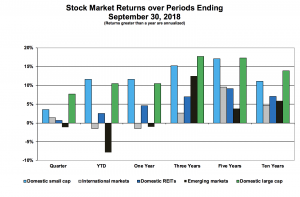
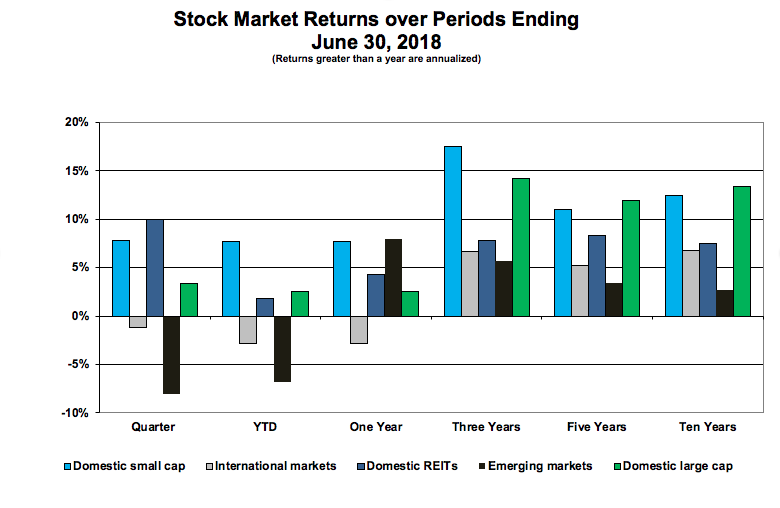
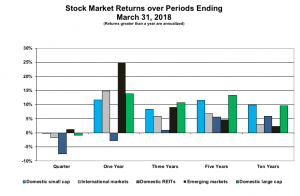
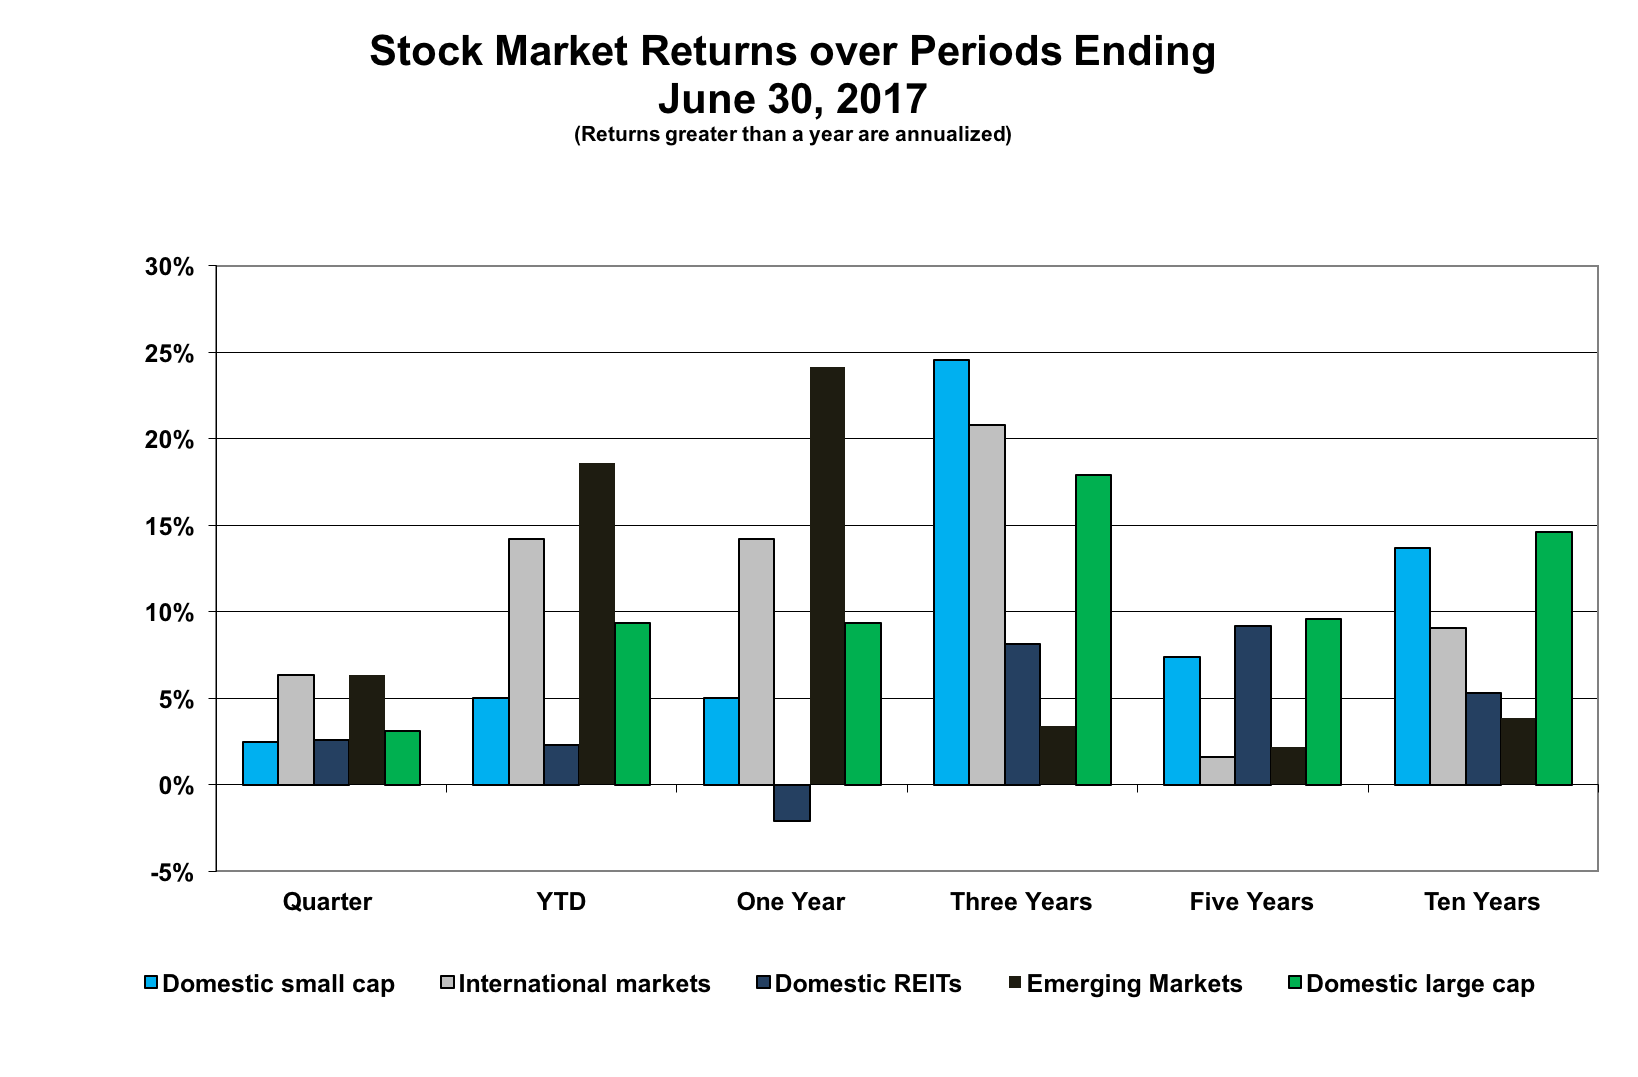
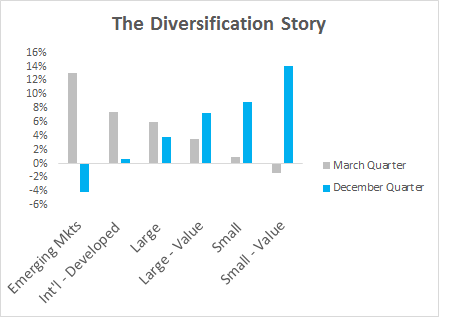
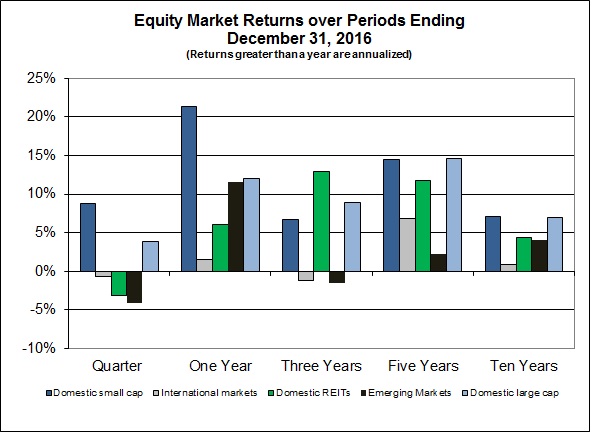
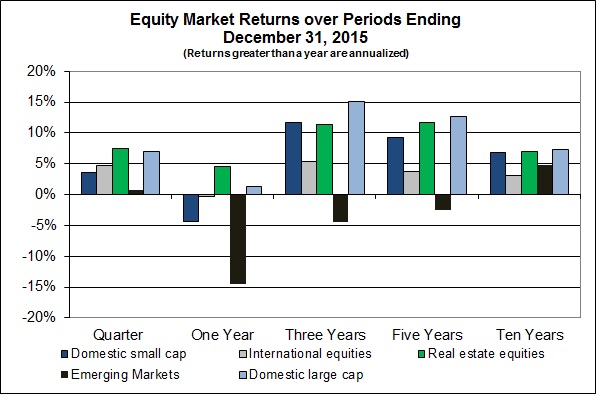
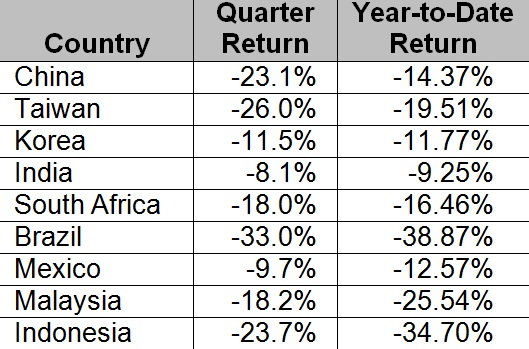
markets and emerging markets stand out as below average.  While we have had to deal with an extended down period in these markets, it is not indicative of what the future holds.

Financial markets continue to deal with the turmoil from Britain voting to exit the European Union.  First lurching down on the news, then, except for British markets, back up to where it now seems that financial markets have generally incorporated the initial shock in a reasonable fashion.  Domestic stocks ended the quarter up about 3%; stocks traded in developed international markets down 1%; emerging markets up nearly 2%.   Year to date a globally diversified stock portfolio would not have fared too badly either – gains in emerging markets generally offset losses in international developed markets.  This time around diversification to emerging markets, REITs and bonds cushioned the immediate impact of today’s uncertainties.

Bond Markets

The bond market story is told in the yield curves chart.  Look at how short-term yields have generally increased, while yields of longer maturities have dropped.  The change in short-term yields reflects the Fed’s beginning to increase interest rates, and longer-term yields are consistent with the so-called “flight to safety” in the face of global uncertainties and negative interest rates. (U.S. Treasuries are still providing a positive return, increasing their demand.)Yield Curves 6 30 16

Once again, the Fed announced that they would delay their program to increase interest rates – too much uncertainty in global markets they say.  I wonder when global uncertainty will dissipate – there will always be something.

Credit spreads – the difference in yield between corporate bonds and Treasury securities – narrowed over the quarter explaining a premium for bearing the credit risk of corporate bonds versus Treasury securities.  While narrowing credit spreads is contrary to the reduced appetite for risk, it is consistent with market participants searching for yield in today’s low (negative) interest rate environment.

Brexit

On June 23rd, 52% of British voters thumbed their nose at the European Union to say:  “We’re out of here!”  This action is going to usher in change.  Of course, anytime the status quo is upended, get ready for a lot of uncertainty as things get sorted out.  As always, the best strategy to deal with this turmoil is to periodically rebalance allocations back to an established risk profile – taking advantage of “buying low and selling high.”

The British vote surprised many.  Now we start the process of “putting as much of the toothpaste as possible back into the tube.”  This will produce more surprises – some positive, others negative – all independent of the Brexit vote.  So far, financial markets seem to have handled the uncertainty reasonably well.

While Brexit didn’t seem to have much of an impact on financial markets, the vote is important nonetheless.  Brexit is a first cousin to the Trump phenomenon here.  Both reflect a repudiation of the ideas and programs of the so-called “Establishment.”  The data is reasonably clear that not everyone has shared the benefits of globalization, technological change, immigration, etc.  A lesson of the Brexit vote as well as the success of Donald Trump and Bernie Sanders is that there is an underlying discontent with economic and cultural changes that better not be ignored

The recent vote in Britain to exit the European Union is yet another reminder of how markets often react negatively to surprises. We cannot help but ask ourselves, “Is it different this time? Maybe this is the event that upends markets as we know them, and I would be stupid not to react!”

As it turned out, markets settled down quickly after this latest surprise, but it reminds us that long-term investors must endure these market downturns because no one has the crystal ball that would allow us to avoid them.

Sometimes surprises have profound and long-lasting effects. Those of us who have been saving for retirement for the past thirty years or so have seen plenty of surprises, and I think it is helpful to put some of the results in perspective. Looking back from 2016, it is interesting to note how disappointing our recent experience has been. Since 1940:

• The worst 3-year performance for the S&P 500 ended in March of 2003 (-16.09% annualized).
• The worst 5-year performance for the S&P 500 began a year later in March 2004 (-6.64% annualized).
• And the worst 15-year performance for the S&P 500 ended in August 2015 (+3.76% annualized).

In other words, the technology/dot-com bubble that ended in March 2000, and the financial crisis of 2008, were back-to-back disastrous surprises for the stock market. The fallout has consumed more than half the working career of anyone much under 50 years old, and had a negative impact on those who are older and trying to save for retirement in their peak earning years.

Another interesting fact: If we add the previous ten years to that worst 15-year period (25 years beginning in September 1990), the S&P 500 realized annualized returns of 9.8% – very close to longer-term averages.

Some conclusions we can draw from these observations:

• Time horizon matters – 15 years is not a long time for a long-term investor, and anyone planning for retirement should be a long-term investor.
• It’s different every time – the cause of the surprise is almost always different than the last time markets were shaken, but long-term investors must be ready to endure the inevitable downturn.
• The best reaction is almost always the same – check your risk profile to be sure it is appropriate for your situation, then rebalance to your targets, buying stocks at discounted prices.
• Staying the course makes sense – the major market run-up in the 1990’s was as unforeseeable as the subsequent downturns.

Events like the Brexit vote test our patience and tolerance for risk. Maintaining a long view to the future, and keeping history in perspective, can help us make better investment decisions.

Rockbridge is pleased to announce that Kevin R. Sullivan joined the firm in April after spending 25+ years in the trust & investment management divisions of local banks.  Kevin is a graduate of St. John Fisher College and brings to Rockbridge experience with trust and estate planning issues, portfolio management and business development for both personal, trust and retirement account situations.

While Kevin has spent years working within the ‘actively-managed’ portfolio approach, he is grateful to join a firm whose philosophy and process is built on the evidenced-based method employed by Rockbridge Investment Management.

Months prior to joining Rockbridge, Kevin enrolled in the Certified Financial Planner (CFP) and expects to be completed with his studies within the next several months.  Based on his interactions and first-hand experience in working with pre- & post-retirement clients, as well as generational issues affecting local families, Kevin is focused on bringing additional value and elevating the conversation with his clients on a number of financial topics here at Rockbridge.

You can learn more about Kevin here.

Believe me, we get it. After yesterday’s Brexit referendum and its startling outcome, it’s hard to view today’s news without feeling your stomach twist over what in the world is going on. Whenever the markets scream bloody murder, your instincts deliver a sense of unrest ranging from discontent to desperation.

Financial author Larry Swedroe has called this your GMO response: Get me out! The Wall Street Journal personal finance columnist Jason Zweig explains it this way: “Losing money can ignite the same fundamental fears you would feel if you encountered a charging tiger, got caught in a burning forest, or stood on the crumbling edge of a cliff.”

Basically, you can’t help it. These sorts of responses are being generated by the amygdala lodged deep inside your brain, over which you literally have no control.

What’s Next?

So, first, take a breath. Now another one. Next, remember that there is a fine line between remaining informed about global goings on, versus letting an onslaught of news take over your brainwaves and trick you into rash reactions.

In that context, it doesn’t take long to realize that the breaking Brexit news raises myriad questions, with few swift and comforting answers currently available.

In lieu of fixating on the bounty of in-depth analyses (when in reality the answer to exactly what is coming next is: “Who knows?”) it’s worth remembering that capital markets have been encountering and absorbing startling news for centuries. When viewed close up, the mechanics can be ear-piercingly loud, but they actually have a history of working marvelously well in the long run – at least for those who heed the evidence on how to participate in the upside rewards while managing the inevitable downside risks.

What Should You Be Doing?

In short, very little at this time … which we understand, can be one of the very hardest things to (not) do. So let’s talk about that.

In your portfolio, if we’ve accurately positioned you for withstanding high market risk when it occurs, you can congratulate yourself for having already prepared as best you’re able.

While the outcome of the Brexit referendum is certainly new and different, its impact on the market is old hat. These are the sorts of events we have in mind when we prepare and manage you and your portfolio. Using global diversification, effective asset allocation and careful cost management, the goal has been – and remains – the same. Our aim is to expose you to the market risks and expected returns you need for building or preserving your wealth, while minimizing over-concentration in any one holding. That way, you are best positioned to avoid bearing the “Ground Zero” worst of it when market crises do occur.

Even so, perhaps the unfolding events are causing you to realize that you aren’t as keen as you thought you were on bearing market risk. Real life is very different from theoretical exercise.

If this is the case, we get that too. Still, we would strongly suggest that this is no time to act on those insights. In fact, it’s likely to be the worst time to do a “GMO.” First, it is likely to incur significant avoidable financial loss. Plus, while it may temporarily feel better to have “done something,” it leaves you with no plan for the future. That can generate more chronic unhappiness than it briefly relieves. Life is too short for that!

If you’re having your doubts, consider your current feelings an important and valuable insight about yourself, but please, please sit tight for now. Do give us a call right away, though, and we’ll explore how best to ratchet down your investment risk sensibly and deliberately.

In short, as your advisor, we’re all in on safeguarding your best financial interests. We remain as here for you as ever. We hope you’ll let us know how you are holding up, and what questions we can answer about the unfolding news. Market analyses aside, we are living in “interesting” times, and would love to chat further with you about them, one on one.

Thanks in part to our evidence-based approach to investing, we don’t have to eat our words or advice very often. But recently, we discovered that we stand corrected on one point. Fortunately, it’s a point we’re happy to concede:

Evidence-based investing doesn’t have to be such a boring subject after all.

In his recent “Last Week Tonight” HBO segment on retirement plans, John Oliver showed the world that even the typically eye-rolling conversation on why fiduciary advice matters to your investments can be delivered so effectively that it goes viral … or at least as viral as financial planning is ever likely to get, with nearly 3.5 million views, and counting.

Oliver’s masterful combination of wit and wisdom is worth watching first-hand. If you’ve not yet taken the 20-minute coffee break to check it out, we highly recommend that you do so.

The best part? It’s hard to say. He covers so many of our favorite subjects: avoiding conflicted financial advice, reducing the damaging effects of excessive fees, and participating sensibly in expected market growth.

We also are hopeful that Oliver’s segment will help strengthen the impact of the Department of Labor’s recent rule, requiring all retirement advice to strictly serve the investor’s best interests. We can’t quite bring ourselves to share the analogy that Oliver used to bring that particular point home, but here are a couple of our other favorite zingers (pardon his French):

On stay-the-course investing: “There is growing evidence that over the long term, most managed funds do no better, and often do worse, than the market. It’s basically the plot of ‘Charlie and the Chocolate Factory.’ If you stick around, doing nothing while everyone around you f**ks up, you’re going to win big.”

On hidden fees: “Think of fees like termites. They’re tiny, they’re barely noticeable, and they can eat away your f**king future.”

Lacking Oliver’s comedic timing, our own frequent conversations on these same subjects are unlikely to ever reach 15 million viewers. But that doesn’t diminish our equal levels of passion and enthusiasm for how important it is to safeguard your financial interests by embracing the few relatively simple, but powerful principles that Oliver shared.

One thing we do have over Oliver: We are quite serious about actually serving as a fiduciary advisor, protecting and promoting your highest financial interests. As always, we deeply appreciate your business. If you are aware of other investors who could use a similar helping hand, why not share Oliver’s video with them? We hope you’ll also offer them our name along with it, in case they’d like to continue the conversation.

The default investment option for the Lockheed Martin Salaried Savings Plan (SSP) and the Capital Accumulation Plan (CAP) is the managed Target Date funds.  A Target Date fund is designed to capture the entire investment market in a single fund.  In addition, as you approach retirement, the Target Date fund becomes less and less risky.  While this sounds good in theory, there are some significant downsides to using Target Date funds, especially the ones available in the LM retirement plan.

Benefits

For new investors, there are some significant advantages to holding the LM Target Date Funds, the primary of which is simplification.  For an employee in their 20s and 30s, savings rate is by far the most important factor in retirement success.   Focusing on savings rate and simplifying the investment selection with a Target Date fund is a good approach during these years.  Another benefit is that the Target Date funds automatically rebalance on at least an annual basis.   Finally, the Target Date funds decrease in risk over time which could benefit an investor that is disengaged from their accounts.

Risks

It is important to consider how much risk you are truly taking with a Target Date fund.  There is no standard for how much stock market risk a particular Target Date fund holds, so two different funds that have the same retirement year (Target Date 2040) could have drastically different holdings inside of them.    By investing in individual asset classes instead of a single fund, you have the ability to better control the risk taken in the portfolio.  In addition, the risk can be controlled better for other facets of your individual retirement picture.   The ideal risk level may be different if you have a LM pension as well as the SSP.

Costs

The Target Date funds in the LM 401(k) plan are actively managed by Lockheed Martin Investment Management Company (LMIMCo).  On any given day, the LMIMCo can change the internal account managers in the fund which can change the price.

For example, the annual expense ratio on LM Target Date funds can vary between 0.15% and 0.82% at any given time.  That is quite a broad range.  It would be good to know to a more accurate detail if the annual expenses were either $150/year or $820/year (on a $100,000 account).

In contrast, selecting individual index based funds in the plan would have a lower expense ratio of around 0.04%.   Knowing that you are only paying $40/year instead of $820/year (on a $100,000 account) is a big incentive to re-evaluate your investment selection within your account.

Active vs. Evidence-Based Investment Management

At Rockbridge, we fundamentally believe in the evidence-based or index-based investing approach.  The goal of most investors should be to capture the returns of the entire market for the lowest possible cost.   Unfortunately, the Lockheed Martin Target Date funds fall under a category of active management.   The concept of active management means that a fund is making specific investment decisions in an attempt to outperform their benchmark investment.  While the word “active” sounds like a positive characteristic for an investment manager, academic evidence shows that over the long run, a large majority of active managers have lower returns after fees compared to using an evidence-based approach.  Many of the Lockheed Target Date funds also show this performance lag on their Morningstar reports.

Holdings

Although the Lockheed Martin Target Date funds hold many different asset classes, there are several that Rockbridge does not believe adds long-term value for clients.  These asset classes include commodities, alternative investments, futures, and Treasury Inflation Protected Securities (TIPS).  In addition, each target date fund held approximately 9% in cash at the end of 2015.  With the goal of long-term investing, holding cash in a retirement account could decrease your expected return, and thus, your retirement account balance.

Solution

As you can see, the Target Date funds within the Lockheed Martin 401(k) have both benefits and pitfalls.   The main benefit is simple broad diversification, however this comes with increased costs and risk factors for the investor.

At Rockbridge, we prefer to control the risk in your portfolio and reduce the unneeded costs associated with investing.  As mentioned above, the Lockheed Martin plan does have well diversified, evidenced-based funds that are available.  Please reach out to us for an allocation unique to you.

Lockheed Martin MST recently announced the upcoming Voluntary Layoff Program with the goal of reducing the divisional workforce by 1,500 employees.  If you are considering retirement and are eligible for the Voluntary Layoff Program, it may make sense to deeply consider the options.

As with all retirement and transition decisions, there are two main components: the financial aspects and the non-financial aspects.   Often, the non-financial considerations far outweigh any detailed financial analysis.

Financial Considerations

  • Have you reached the savings level where you can comfortably retire the way you envisioned in the past?
  • Do you have major upcoming costs such as college tuition for children that would hurt your early retirement decision?
  • How will this program affect your taxes this year and future income streams like Social Security?
  • If you are not 65 years old, how does this impact your medical insurance coverage?

Non-Financial Considerations

  • Are you truly ready to retire from day-to-day work? What would that look like?
  • Do you have other career ambitions outside of Lockheed Martin?
  • What does your spouse think of the prospect of you no longer working?
  • Are your primary friends retired or still working?
  • If needed, how will you replace the sense of daily accomplishment that work provides?

Start with a Financial Plan

When considering a major life decision, it makes sense to first take a step back and figure out your priorities and long-term goals in life.   The best way to do this from both the analytical and emotional level is to have a comprehensive financial plan in place.  This living document can help frame the Voluntary Layoff Program decision as well as open the discussion for other missed financial opportunities going forward.  Rockbridge is here to help facilitate the discussion and frame the key decisions for you at this critical time in your career.   We are here when you are ready.

If you qualify for the Voluntary Layoff Program and are interested in applying, the following are some key dates to keep in mind:

  • May 11: Final day to submit application for the Voluntary Layoff Program
  • May 26: Employee notified if application is accepted and the applicable exit date
  • June 9: Date majority of the employees will exit the business; additional dates will continue quarterly through June 8, 2017

When evaluating a financial advisor, the most important factor is that they truly understand you as a person and your personal situation.  At Rockbridge, we have a dedicated focus in working with clients that are employees of Lockheed Martin.  Because of this, we already have an expertise in all employee benefits plans and how each one interacts with other benefits such as Social Security.  This allows us to optimize your retirement plan and gives you the reassurance and confidence that you are not leaving anything on the table.

Over the next several weeks, we will be writing our thoughts on different facets of Lockheed Martin employee benefits.  We hope that you are able to take away some new information that will help you better save and be prepared for when retirement comes.  We are always here to answer your questions as they arise.

Lockheed Martin Retirement Plans

As you well know, there are several different pension and retirement programs offered through Lockheed Martin via Voya.  Each one has their own unique benefits and quirks.   In addition, between now and 2020, the retirement program landscape will change with the pension benefits being frozen for all employees.   We will address each of these items in detail to help eliminate confusion regarding terminology and acronyms.

Salaried Savings Plan (SSP) – This is the company’s 401(k) plan.  Employees are allowed to contribute between 1%-25% of their salary with a max contribution of $18,000/year ($24,000/year for employees 50 and over) for 2016.  In addition to the employee contribution which is always yours, the company will match 50% of your contributions up to 8%.  This means that if you put in 8% of your salary, the company with contribute 4% of your salary toward the plan.

Capital Appreciation Plan (CAP) – For employees that are not part of the Lockheed Martin Pension Plan (hired 1/1/2006 or later), the company will contribute an additional 3%-4% of your salary toward retirement savings.   The CAP will transition fully in 2020 to the new Lockheed Martin Retirement Savings Account (RSA) where the employer will automatically contribute 6% of your salary toward retirement.

Retirement Savings Account (RSA) – A new retirement plan benefit that will function for all employees in place of previous pension benefits.  LM will contribute an automatic 2% of your salary to this program from 2016-2019, and in 2020, that percentage will merge with the CAP and increase to an automatic 6%.

Pension Benefits – The LM pension plan was discontinued for new employees starting 1/1/2006.  Beginning 1/1/2016, the LM pension plan has a locked annuity value for your average pay formula.  Any additional raises will not be factored into the pension formula.  Beginning 1/1/2020, the pension plan will stop accruing additional years of service.  On 1/1/2020, the final pension figure will be 100% fixed.

Lockheed Martin Executive Compensation Plans

In addition to the standard employee plans offered, Rockbridge is well versed in the various executive compensation plans available to highly compensated employees.   With each employee having unique supplemental benefits, we plan individually to optimize every available option.   We have detailed experience working with the Lockheed Non-Qualified Supplemental Savings Plan (NQSSP), the Non-Qualified Pension Plan (NQPP), Deferred Management Incentive Compensation Plan (DMICP), Long-Term Incentive Cash and Restricted Stock Bonuses as well as other legacy compensation plans.

How Plans Interact in Retirement

Understanding the complexities of each Lockheed Martin retirement plan is important, but even more critical is understanding how these plans function together with outside assets (brokerage accounts) and pensions (Social Security).   Using advanced planning software, Rockbridge can make sure your hard earned savings are maximized for your goals.

Framing Solutions

Outside of pure investment management, one of the most valuable services that Rockbridge provides is goal and decision framing.   Unlike simple math problems (1+1=2), retirement decisions are a combination of analytical and emotional decisions.   For many retirement questions, there is no right or wrong answer, but Rockbridge can help frame the decisions so that you are able to select the best solution for YOU.  Having an unbiased and objective third party look over your entire financial picture will give you the peace of mind that the transition to retirement will go smoothly.

First Step

The first step forward is always the most difficult.   When you are ready, Rockbridge would be happy to walk you through the path to retirement to make sure you are making the best decisions going forward.  We offer complimentary discovery meetings so that you can get to know us and see if we are a good fit.   We also offer second-look services to see if your current advisor is maximizing all of your available investment resources.   Your life savings and retirement happiness are always worth a second look.

Stock MarketsEquity Market Returns (2) 3 31 16

After January’s rough start, stock markets bounced back nicely in March, bringing most numbers into the black for the quarter.  Domestic Small Cap and International Developed Markets are the exception – down about 1.5% and 2%, respectively.  Notice from the accompanying chart that it was Emerging Markets that led the way, earning nearly 8% for the quarter.  While not nearly enough to bring longer-period returns into the black, it does give some sense of how diversification works.

The uptick in stock returns in March seems to reflect a more or less positive resolution to some of the recent economic uncertainty – commodity prices have rebounded, figures from China appear better than expected and the domestic economy shows signs of continued improvement with fourth quarter GDP numbers revised upwards.  Also, markets have calmed down a bit – daily volatility of the S&P 500 is below average in March.

While certainly dominating the airwaves, markets don’t seem to be paying much attention to the goings on in the Presidential election.  Don’t let expected political environment cloud investment decisions – assessing not only the probability, but also the impact of the eventual election of any of the current contenders, is tricky indeed.

Market prices are based on the future – today’s prices reflect a set of expectations, which may or may not be realized.  Prices are set expecting a positive return.  The possibility for short-run losses, while not expected, is risk.  It’s what we endure to earn the long-run positive returns.  For sure, however, there will be lots of unpredictable ups and downs along the way as the markets digest the news of the day.

Bond MarketsYield Curves 3 16

The yield on the bellwether 10-year U.S. Treasury security fell about 0.5% to 1.8% by the end of the quarter reflecting positive returns in Domestic Bond Markets.  Note the changes in the accompany Yield Curves chart – short-term rates increasing due to the Fed’s tightening, yet rates over longer periods falling.  The Fed can impact short-term rates; the market sets longer-term rates.

We are in the midst of an environment of historically low interest rates.  In fact, as a component of current monetary policy, the Central Banks of Japan and some European countries have begun to charge member banks a negative interest rate to hold reserves.  Also, the market determined rate on five-year inflation protected U.S. Treasury securities is a negative 0.3%.  Yields on the ten-year security have fallen to under 1.8%, which if inflation over the next ten years is expected to exceed 2%, also produces a negative yield.

While this interest rate environment has persisted for some time, markets can be out of whack for extended periods. However, expected deflation over longer periods could make negative yields rational.   Still, I would be hard pressed to argue that negative interest rates are the “new normal” and are here to stay.  Negative interest rates can’t go on forever, and Stein’s Law (Herbert Stein, Chairman of the Council of Economic Advisors in the Nixon and Ford Administrations) tells us that “If something can’t go on forever, it will stop.”

As you may have heard, there have been some drastic changes to Social Security regarding the file-and-suspend and restricted application methods of filing. These changes were announced back in October 2015 when Congress passed their 2016 budget. (You can read more about the specifics of these changes in this article.)

As expected, there has been much confusion surrounding the changes – from Social Security recipients and Social Security Administration employees alike. The criteria regarding who is still eligible for these strategies is specific and complex, which leads people to discuss their eligibility with a professional. However, according to a recent Wall Street Journal article, there have been several instances where people have been given incorrect information regarding their eligibility from the Social Security Administration.

“People who turn 66 by April 29 can still file for Social Security and suspend their benefits to allow a spouse to file a restricted application, as long as they act by that date. Doing so can make sense if your spouse was 62 or older by January 1 of this year because people in that age group will continue to be able to file a restricted application for only a spousal benefit once they turn 66. With such a coordinated strategy, one spouse can pocket the spousal benefit while both delay claiming their own benefits to take advantage of the delayed retirement credits that increase monthly payments by 6% to 8% for each year in which claiming is deferred between ages 66 and 70.”

The article sites one case where a couple – the husband is 66 and the wife is 64 – was told by a Social Security office in California that they could not participate in the strategy because they both needed to be 66 years old. Since this is incorrect, the couple’s financial advisor told them to be persistent. The couple filed-and-suspended the husband’s benefit over the objections of the Social Security agent and were accepted. According to their advisor, the couple could have lost over $100,000 in lifetime benefits if they had not insisted.

The Social Security Administration says that it has made an effort to inform the over 30,000 employees through manuals, training and other methods of instruction since the beginning of 2016. They recommend that if you are having trouble at an office to ask for a supervisor or a technical officer. Filing online is a great option as well.

You can always contact your advisor at Rockbridge with any questions regarding Social Security. Below is a chart of the claiming deadlines, and different scenarios regarding eligibility.

claiming deadlines

Source of chart: Michael Kitces at Nerd’s Eye View. You can read Michael’s article regarding the Social Security changes here.

Stock Markets

In 2015, domestic large cap stocks (S&P 500) and REITs were up while other markets were down – emerging markets were off big!  The positive results in the S&P 500 were driven by just two stocks – Amazon and Google.  Otherwise it would have looked like other market indices.  These results, I think, reflect ongoing economic uncertainty throughout 2015, much of which is still unresolved.  Examples include:  (1) Where is the bottom for commodity prices?  (2) What is the strength of the dollar as Europe eases its monetary policy and U.S. tightens it?  (3) Are interest rates withering?  The lack of resolution of much of this uncertainty will contribute to continued stock price volatility, which has certainly been the case so far in 2016.  The first week in January has the feel of panic – we’ll see.

Daily volatility of stock prices was up in 2015. This is especially apparent over the last couple of months and into the beginning of 2016.  Yet, the 2015 experience was pretty much in line with how stock markets have behaved historically.  We have become used to above-average returns with less volatility from the widely followed domestic markets in the recent past.  The 2015 story was different – below-average returns with greater volatility.

Bond Markets

After keeping us in suspense most of the year, the Fed voted to increase the rate on Fed Funds (rate at which banks lend excess reserves to one another overnight) by 0.25%.  This much anticipated change was met with a loud ho-hum – surprises are what move markets.  The accompanying Yield Curves chart, which shows yield to maturity from U.S. Treasury securities Yield Curves 12 2015
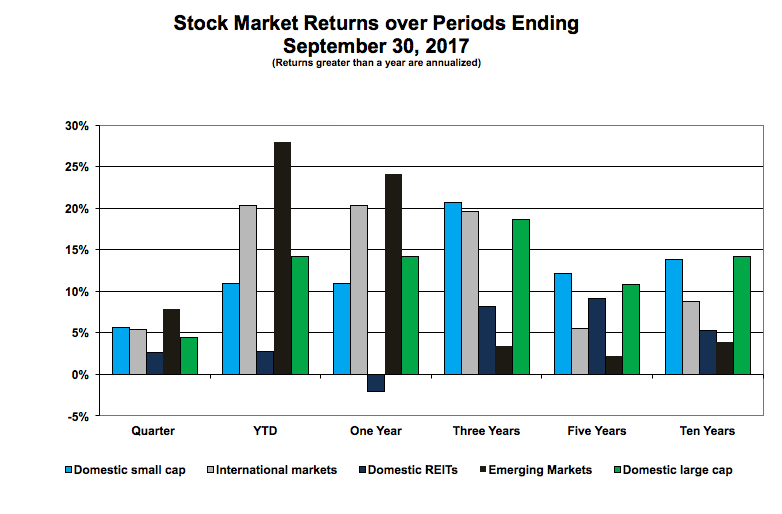
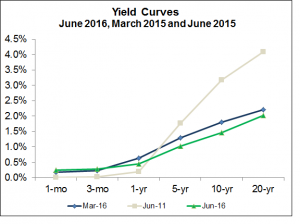
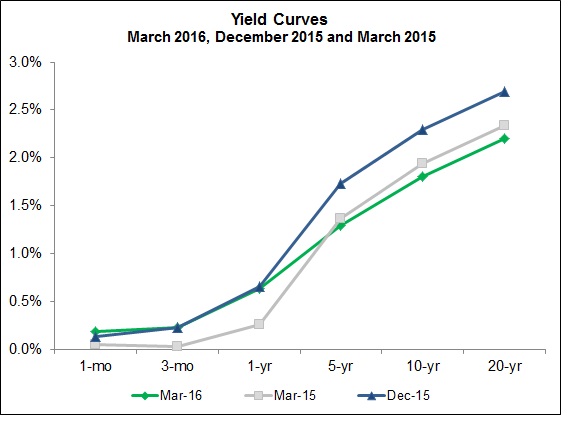
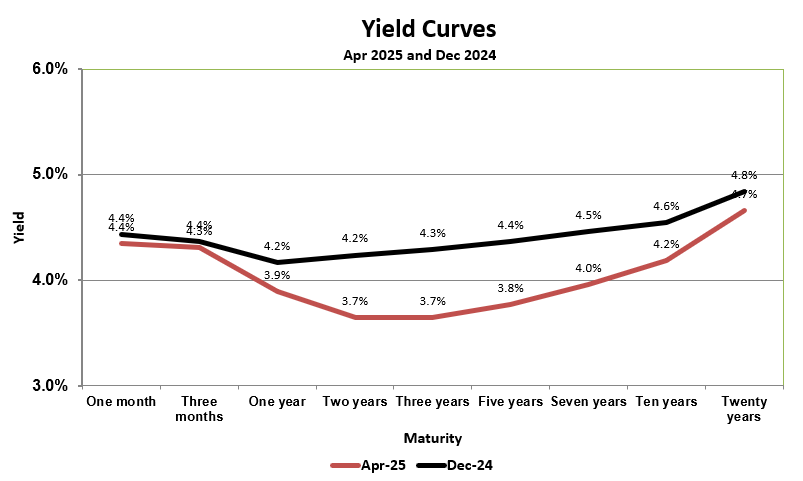
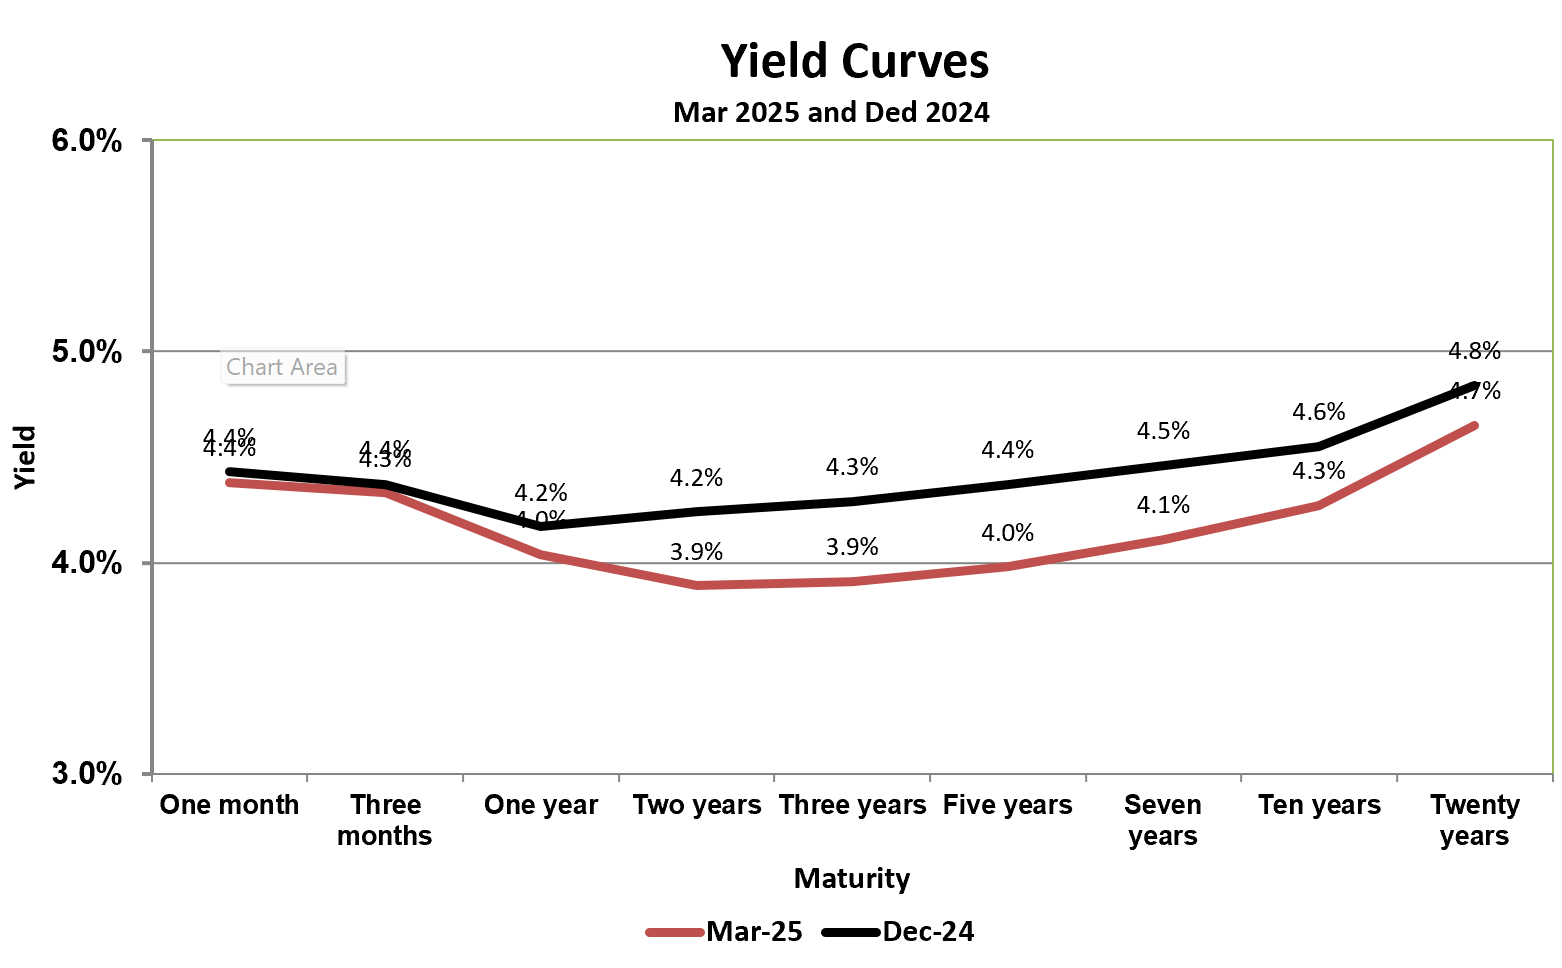
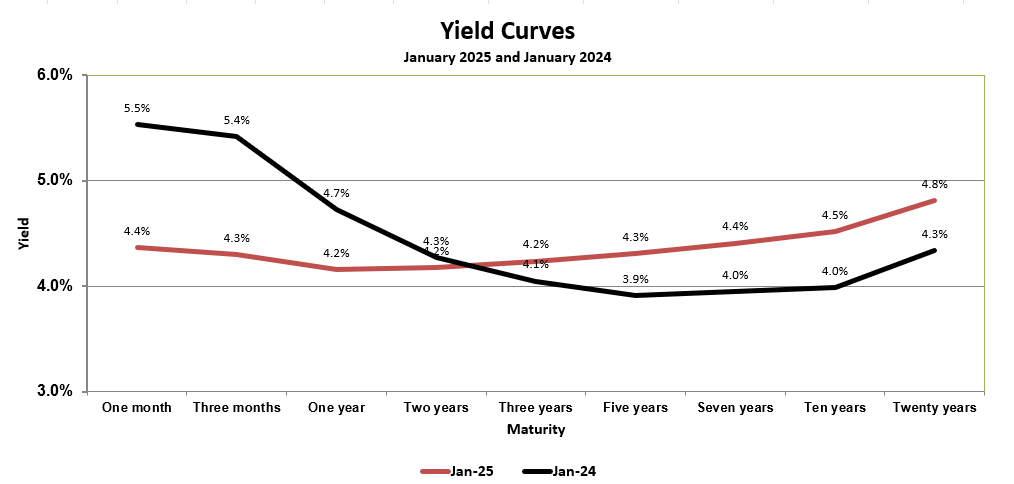
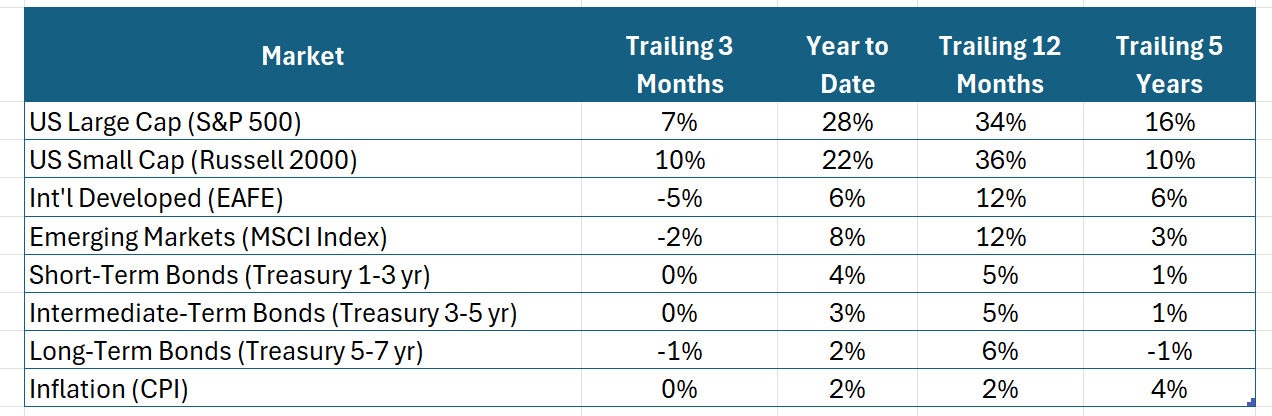
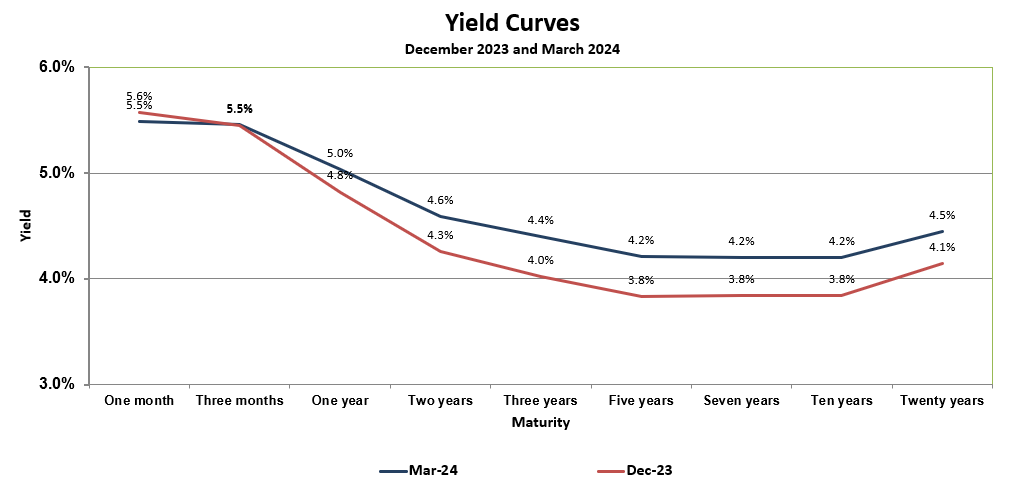
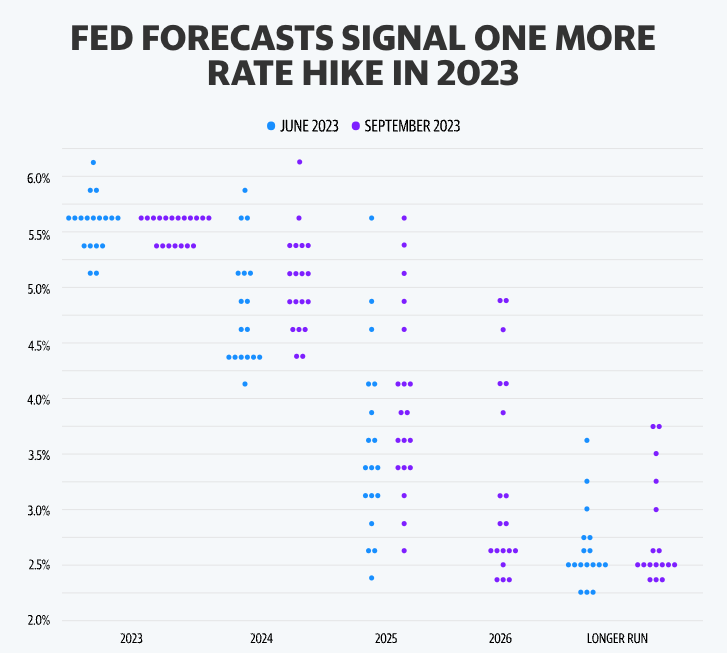
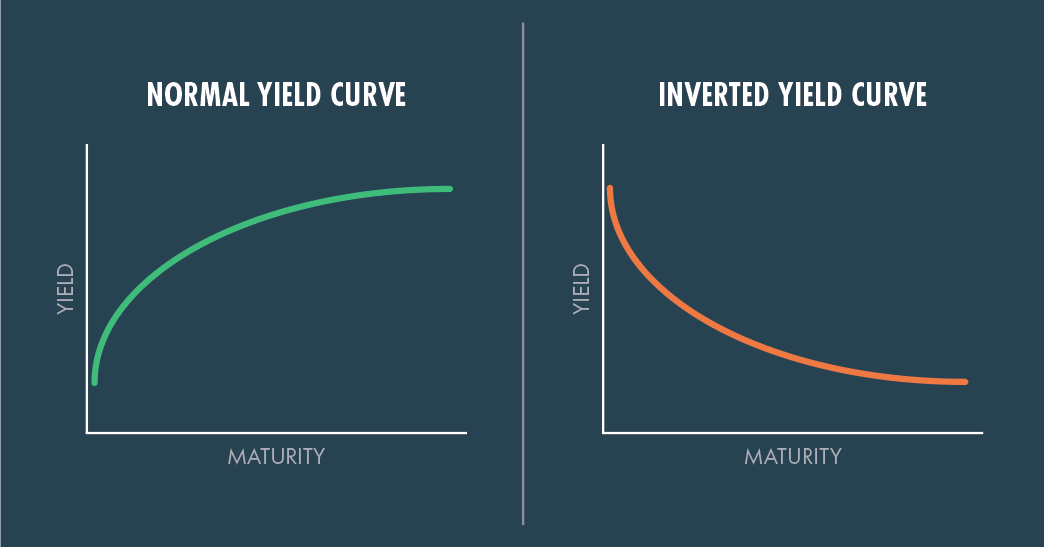
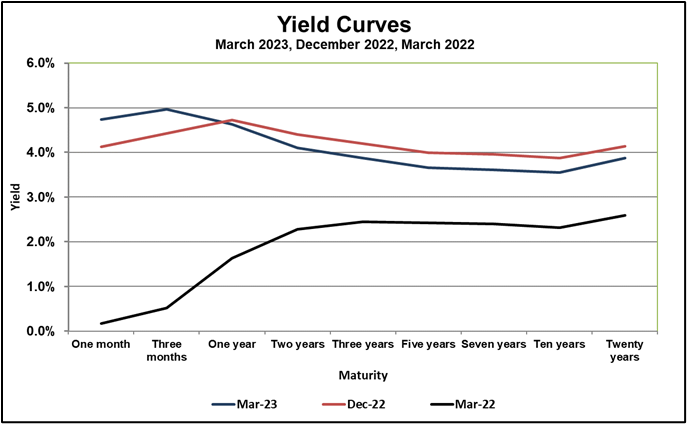
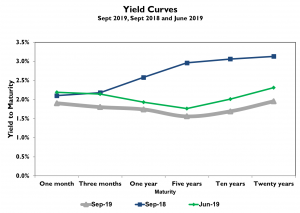
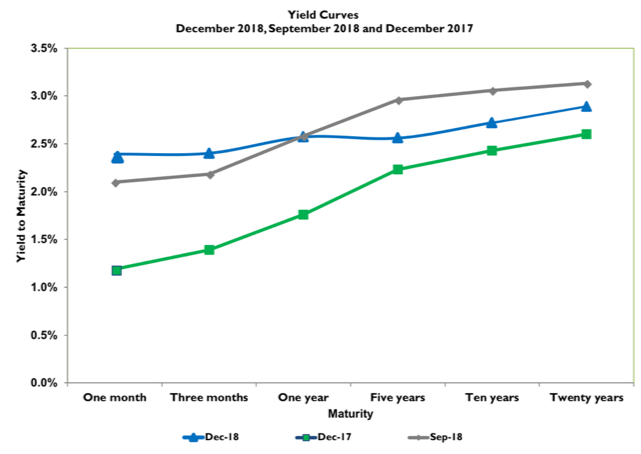
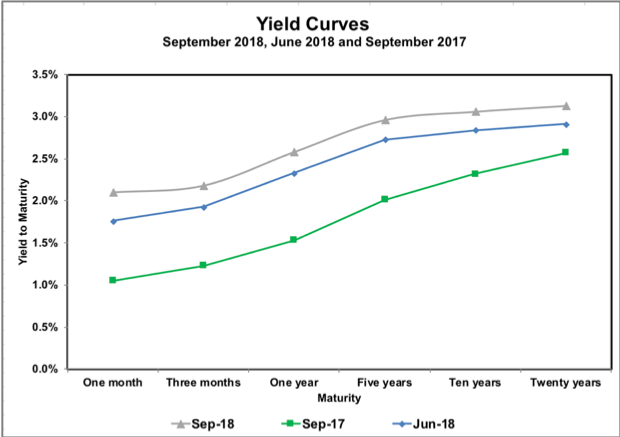
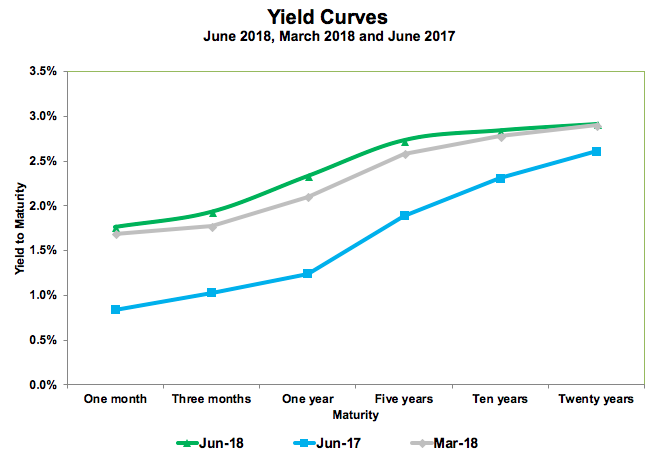
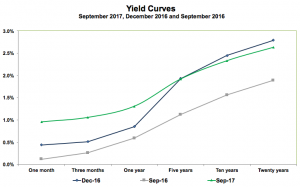
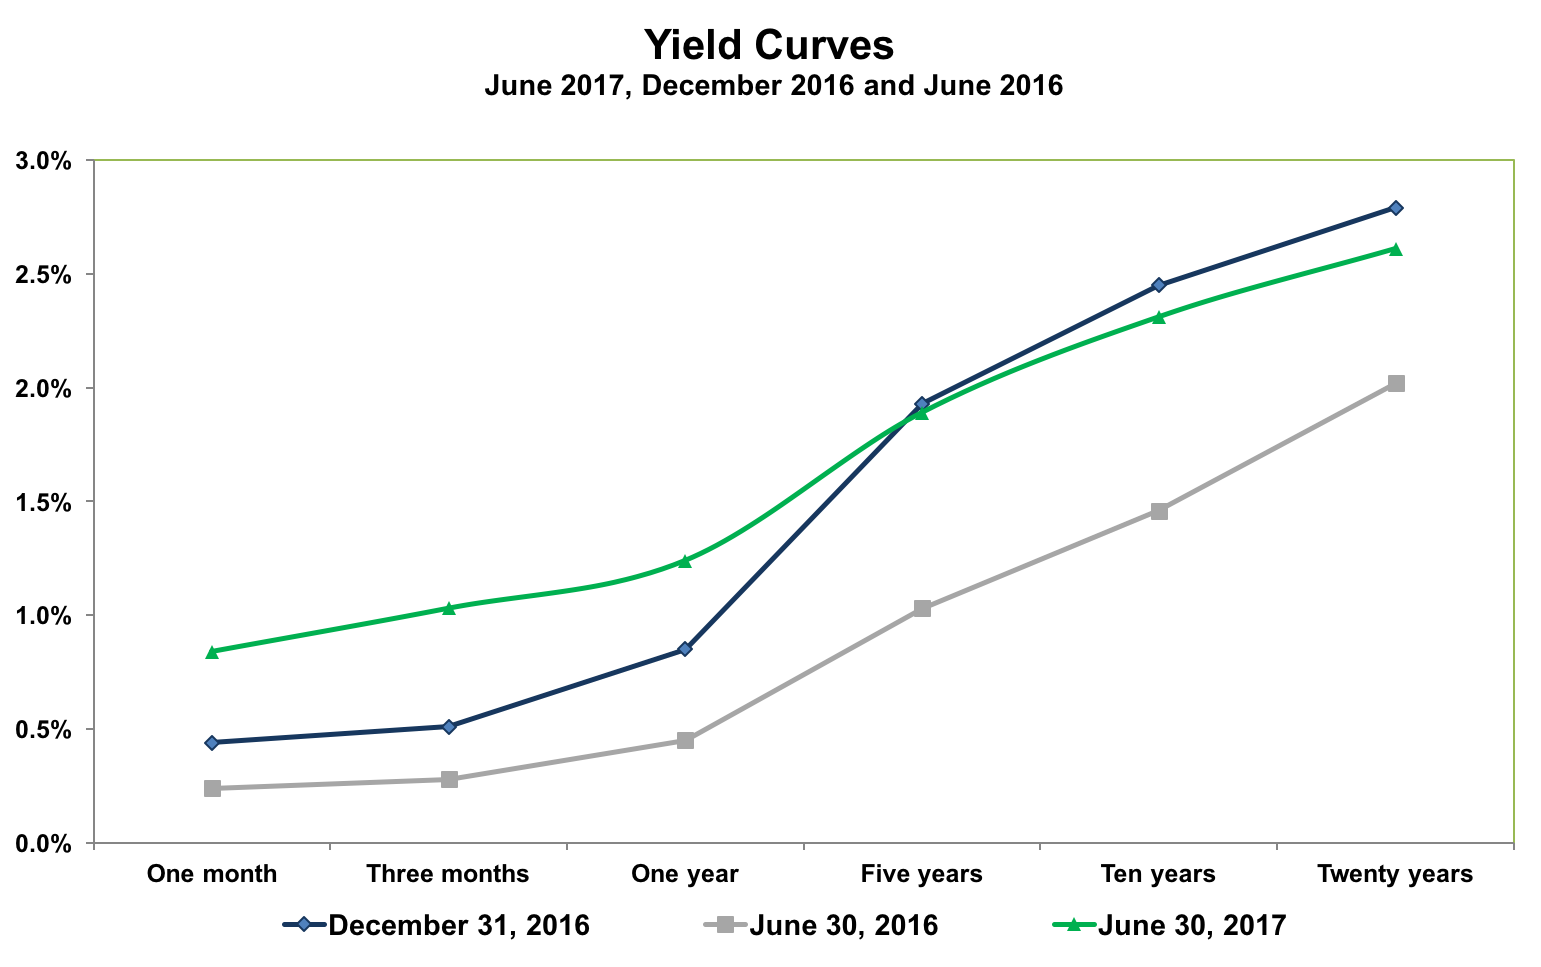
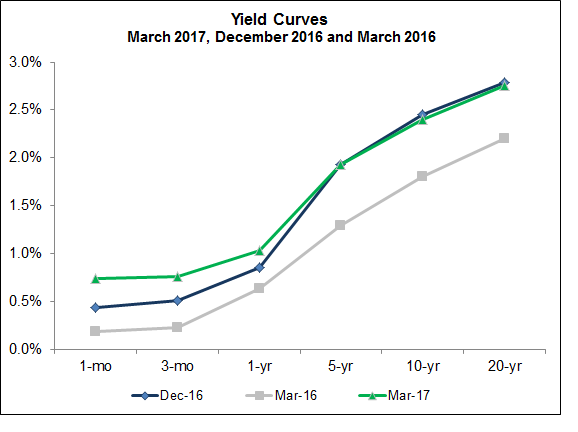
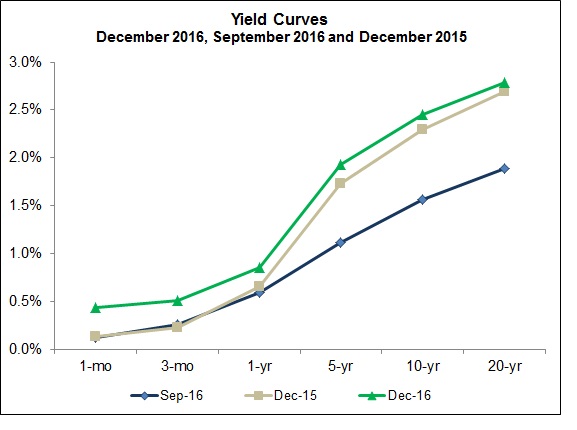
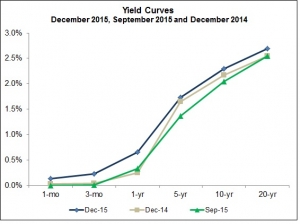
of different maturities, depicts increases at the short end with slight increases at longer maturities.  Yet, not much of a change overall.

While the impact of changes in the Fed’s policies on bond markets and where we go from here continues to provide uncertainty, I think a little less distortion of capital markets from the Fed’s activities is welcomed.

One of the tenets of successful long-term investing is the practice of portfolio diversification.  Through diversification, investors can increase their expected long-term return for a given level of risk (volatility).  This is accomplished by investing in assets that are not perfectly correlated to one another, but each asset individually has a positive expected return.  This theory is the basis of Modern Portfolio Theory (MPT).  Because underlying assets in diversified portfolios are not perfectly correlated, one problem with diversification is that there will always be something investors wish they didn’t own.

Emerging markets was one of the worst performing asset classes in 2015, returning a negative 14.6% for the year (as evidenced by the MSCI Emerging Markets Index).  If foresight were 20/20 at the beginning of the year, we clearly would have avoided a commitment to this asset class.

On the other hand, at the start of 2015, the best data source we had available for predictive purposes was the past behavior of the asset class.  Over the 15 years prior, the MSCI Emerging Markets Index returned approximately 10% annually and exhibited a standard deviation (risk) of 23% (based on monthly returns).  As important as its risk/return behavior, this asset class has not been perfectly correlated with other assets in which we invest, so it was expected to offer diversification benefits.  (Note this time period was used because it was the earliest data available for this Emerging Markets Index.)

Interestingly, the most similar asset class, with respect to risk and return over the same time period, was U.S. real estate (as evidenced by the Dow Jones U.S. Select REIT Index).  This asset class returned approximately 12% and exhibited a standard deviation of 23% as of 2014 (compared emerging market returns and risk of 10% and 23%, respectively).

Given the similarities between the asset classes at the end of 2014, an argument could be made that the 2015 returns might be expected to be similar.  Interestingly, they behaved extremely different in 2015.  U.S. real estate exhibited the best returns of the underlying asset classes, with the Dow Jones REIT Index returning a positive 4.5% for the year (versus the negative14.6% for emerging markets).  This return difference is more attributable to the lack of correlation between the two assets, in addition to their exhibited risk.

Since there is no evidence of investors being able to consistently outperform the market or predict the best asset classes (prior to outperformance), diversification continues to be the best alternative for successful long-term investing.

2015 was an exciting year of growth and change at Rockbridge.  Market returns were less than ideal for the year, but we continue to see growth in our fee-only business model as prospective clients seek out unbiased advice and professional investment management.

We are the leading fee-only investment management firm in Central New York, managing $491 million in client assets, a 14% increase over last year.  We have also added staff to meet the demand of taking on more clients.

Firm Ownership Growth

Ownership of the firm expanded in 2015.  Craig Buckhout and I are the managing members of Rockbridge, providing leadership to a growing group of talented professionals.  Last year, Patrick Rohe and Ed Barno became partners in the firm.  This year, Doug Burns and Geoff Wells will also become equity partners in Rockbridge.  Expanding ownership of the firm is one of  our primary goals as we grow to serve more clients.  The addition of more owners provides for an enduring business over the long haul, ensuring continuity for our clients.

The People of Rockbridge

New faces at Rockbridge include Claire Ariglio and Lisa Cellucci.

Both Claire and Lisa will be supporting our financial planning efforts with new and existing clients.  Additionally, Dave Carroll completed his first full year at Rockbridge.  All three of these new advisors are studying for the Certified Financial Planner™ designation in 2016.

Sadly, we say goodbye to long-term Rockbridge employees Ted Scallon and Keri Morrison.  Ted is relocating to New Jersey to spend more time with his family.  Keri will be spending her time working with the Live Like Jake Foundation (http://livelikejake.com), which she and her husband, Roarke, founded in memory of their son, Jake. The work of the foundation is extremely important to Keri, and we look forward to supporting her and the foundation in its mission to raise awareness for drowning prevention.

Awareness Campaign

The top two reasons new clients land at Rockbridge are referrals from existing clients and our website.  More people are searching for fee-only advisors and financial planners, and we continue to maintain our #1 rank in those searches.

Many of our new clients said they had never heard about us prior to their search.  So in an effort to raise our profile in the community, we embarked on an awareness campaign in 2015.  You may have seen or heard our ads on Time Warner Cable, FIOS, or the radio.  We have received very good feedback from existing and new clients, so we will continue to advertise in various media outlets in the future.

We continue to remain focused on providing the best experience for our clients, and we sincerely thank you for your trust and confidence.

Our Rockbridge team is continuing to grow, and as a new member, I would like to take a moment to introduce myself.

My name is Lisa Cellucci.  I was born, raised, and educated right here in Syracuse.  Even as a little girl, I always loved math and numbers.  But maybe even more than math and numbers, I have always loved people.  Whether a person is three, ninety-three, or anywhere in between, I can always find something to talk about with them.  This meant that I was going to have to answer the following question – “What kind of job can you find where you are working with numbers but also communicating with people?”

In high school, business classes were by far my favorite type of classes.  I could say for certain that someday, I wanted to be a businesswoman with some type of business degree, but couldn’t quite pinpoint exactly what I wanted to be doing.  I found myself at Le Moyne College after receiving the Presidential Scholarship, a merit based scholarship that the school offered.  To get the most out of my time at Le Moyne, I double majored in Finance and Business Analytics.  I ended up completing my required coursework early in 2012, and decided I could never have enough education, nor was I ready to be done with college, so I decided to stay at Le Moyne College and earned my MBA in 2014. This allowed me to couple the knowledge I had in finance with a strong business background.

I worked all throughout high school and college.  My first job was at Wegmans, where I worked for six years. I worked my way up through several positions: cashier, service desk, cashier trainer, and service team leader.  As a company, Wegmans is highly focused on customer service, and I think that provided a strong foundation for the rest of my life.  Now, each and every time I come in contact with a client, I want to be sure that they feel their needs are met quickly, efficiently, and pleasantly.  During my undergraduate studies, I interned at a local financial advisor to school districts and municipalities.  I found that I enjoyed what I was doing during the internship, and accepted a job as a financial analyst immediately upon my graduation.  Although I liked what I was doing, after three years, I felt as if there was little room for career growth and wanted to dig deeper in the world of finance by learning new things, gaining experience, and new education.

Lucky for me, I found out that Rockbridge was looking to hire additional financial planners.  After my first interview, I knew Rockbridge was the company for me – I just hoped they liked me as much as I liked them!  One of the most important values that Rockbridge follows is our fiduciary duty to our clients.  No matter what the situation is, we always act in the best interest of our clients.  Because of this, we can stay true to our investment philosophy and help people take the emotions out of their investment decisions.  I am thrilled to be working with individuals as I feel that this type of work is very rewarding. I am hopeful that we bring peace of mind to clients that their money is managed well whether they are young and just starting out or enjoying their golden years – and most of all that we are helping others.

This year, one of my biggest goals here at Rockbridge is to complete my Certified Financial Planner™ certification, which I am currently studying for. Plus, I look forward to working with each of you!

P.S. – My interests outside of work include spending time with family, friends, my dog, Lexi, and my two fur nieces, Mila and Zoey.  I also enjoy volunteering in the community (I teach church school to second graders), supporting our beloved Syracuse Basketball team, and fitness training.

It’s been nearly a decade in the making, but time has finally come: On December 16, 2015, the U.S. Federal Reserve (the Fed) raised the federal funds rate by 0.25 percent. In and of itself, it’s a small move. But it’s being reported as “a historic moment,” since it’s the first federal funds rate increase of any sort since June 2006. Seeking to bolster an ailing economy amidst the Great Recession, the Fed began lowering the rate in fall 2007, until it hit zero percent in December 2008; it’s been sitting there ever since.

So what does the news mean to you and your financial well-being? As is nearly always the case during global economic events over which we have no control, we recommend that you remain informed – but that you act only on factors you can expect to manage within your personal investing. In that context, let’s take a moment to share some insights about the Federal Reserve funds rate.

What Is the Federal Reserve?

As described on its consumer education site, the Federal Reserve is the central bank of the U.S. It was created by Congress as an independent government agency in 1913 to “provide the nation with a safer, more flexible, and more stable monetary and financial system.” Yellen is its board of governors’ chair. Ben Bernanke was chair before her, and Alan Greenspan before that.

Yellen and her board of governors are based in Washington, DC. They also oversee 12 regional reserve branches across the country and are tasked with three main roles:

  1. Monetary Policy – Promoting “maximum employment, stable prices and moderate long-term interest rates”
  2. Supervision and Regulation – Overseeing U.S. banks and gathering information to understand financial industry trends
  3. Financial Services – Serving as a bank for U.S. banks as well as for the country’s monetary operations – issuing currency, managing the government’s bank accounts, borrowing money in the form of U.S. Savings bonds and more


What Is Going On?

While you wouldn’t want to run a developed country without all three of these roles in place, monetary policy is where much of the headline-grabbing action has been, as the Fed has been grappling with when, by how much, and how frequently it should raise the federal funds rate.

The Federal Reserve sets monetary policy through its Federal Open Market Committee (FOMC), which includes the Fed’s seven board members and a rotating representation of Reserve Bank presidents.

The FOMC holds eight regularly scheduled annual meetings to consider what actions to take (if any). In the days before those meetings, the financial press often reports on expected outcomes as if they were a done deal, and markets often respond accordingly.

In reality, until those meetings have taken place, nobody knows for sure what their outcome will be. We saw this in September 2015 when a widely anticipated rate increase did not take place after all. In December 2015, a rate hike was again widely predicted; this time, the predictions happened to be correct.

Ordinarily, the FOMC has a number of ways to seek balance among the competing demands of the economy. But while the federal funds rate remained at zero, their usual arsenal had effectively been reduced to a single bullet: Will they or won’t they raise that rate?

It’s no wonder the question became the media’s central focus for recent FOMC meetings. It’s also no wonder that investors have been – and no doubt will continue to be – bombarded with the usual volume of conflicting coverage on what is and is not at stake, and what may or may not come to pass. Depending on who you heed, higher federal funds rates could be anything from a panacea, to a global scourge, to a non-event in the markets.

What Does All This Mean to You and Your Money?

First, it helps to understand that there is an intricate interplay between developed nations’ monetary policies, global interest rates and the markets in general – and that these components are nowhere near one in the same. Anyone who claims to know exactly what will happen in one arena when we pull a lever in another had best be able to present a functioning crystal ball if he or she is to be believed.

To understand the complexities involved, consider this insightful article by Bloomberg View columnist Barry Ritholtz: “You’re the Fed Chairman. What Would You Do?” In short, monetary policy-setting is neither as easy nor as obvious as you might think.

It’s also worth emphasizing that the only interest rate the Fed has direct control over is the U.S. federal funds rate, which is the rate at which depository institutions (mostly, banks), lend and borrow overnight funds with one another.

The resulting cash flow is the grease that turns the wheels of our federal banking system, so it’s an important factor. But that doesn’t mean that there is a consistent cause-and-effect relationship between federal funds rate movements and other yields-based financial instruments such as U.S. or international fixed income funds, interest-earning accounts, mortgages, credit cards and so on.

As this Wall Street Journal article describes, “Think all rates would tick a little higher as the Fed tightens? That isn’t how it works. … The impacts will be uneven. Some borrowing costs are likely to rise closely in sync with short-term rates, but others won’t.”

Why is this so? It’s the result of those multiple global factors at play, with the Fed’s actions representing only one among them. A post by “The Grumpy Economist” John Cochrane even suggests that the Fed’s actions may be one of the less-significant factors involved, as he comments: “Lots of deposits (saving) and a dearth of demand for investment (borrowing) drives (real) interest rates down, and there is not a whole lot the Fed can do about that.  Except to see the parade going by, grab a flag, jump in front and pretend to be in charge.”

What Should You Do?  

Whenever you’re wondering how best to respond to a shifting landscape such as that wrought by rising (or falling) interest rates and any related repercussions, begin by asking yourself: What can I do about it?

Unless you are Janet Yellen, there is probably nothing you can do to personally influence what the Feds are going to decide about interest rates in the months ahead, or how the global markets are going to respond to the news. But there is plenty you can do to help or harm your own wealth interests.

First, if you already have a solid financial plan in place, we do not recommend abandoning it in rash reaction to unfolding news. If, on the other hand, you do not yet have a well-built plan and portfolio to guide the way, what are you waiting for? Personalized financial planning is a good idea in all environments.

Next, recognize that rising or falling interest rates can impact many facets of your wealth: saving, investing, spending and debt. A conversation with a professional wealth manager is one way you can position yourself to make the most of the multi-factored influences of the unfolding economic news.

Together and through varied interest rate climates, we can help put these and many other worldwide events into the context they deserve, so you can make informed judgments about what they mean to your own interests. The goal is to establish practical ways to manage your debt; wise ways to save and invest; and sensible ways to spend, before and in retirement.

These are the factors that matter the most in your life, and over which you can exercise the most control – for better or for worse. Give us a call today if we can help make things better for you.

Last week, Congress passed their “Bipartisan Budget Act of 2015.” Among the typical budgetary items, there are a few alterations that will impact the Social Security benefit filing system. Anyone who turns 62 in 2016 or later will no longer be able to take advantage of the “file-and-suspend” strategy for the purpose of receiving spousal benefits. This strategy would allow a person to file and then immediately defer their benefits to a later age, while their spouse was able to claim spousal benefits. In turn, the married couple could take advantage of the deferral credits that increase benefits by 8 percent per year after full retirement age until age 70, while still receiving the spousal benefit Social Security check each month. Under the new rule, a person filing for Social Security must file for both their own benefits and their spousal benefits, but will only receive the higher of the two.

This will impact many people who were planning on including this strategy in their retirement spending plan as a main stream of income. However, Congress believed they needed to eliminate this “loophole” to prevent people from receiving larger benefits than the government originally intended.

Check out the articles below for some more detail on the changes being implemented:

Congress is Killing the File-and-Suspend and Restricted Application Social Security Strategies

New Budget Deal Is Cutting Your Social Security Benefits and It’s a Good Thing


In a recent WSJ article, they talk about the how smart phone “investment apps” are causing investors to react to short-term market swings and abandoning their long-term established financial plans.

Behavioral economists call this tendency, “myopic loss aversion”- and it can be incredibly costly.

Click on the link above to read the full article!

Stock Markets

The chart to the right shows what we have had to put up with recently:  all but REITs were down for the quarter (all were down since the beginning of the year), and emerging markets were downbig, showing variability over the trailing twelve months.  These periods remind us that markets do go down, but this is what it means to accept risk.

equity market returns 093015

Stock markets reflect the uncertainty of today’s economic environment, which includes the slowdown in China’s economy, the short-term impact as well as the longer-term sustainability of the sharp fall-off in the prices of energy and other commodities, and the effects of the Fed unwinding its easy monetary policy of the last seven years.  The impact of all of these factors on emerging market economies is especially worrisome and helps explain the sharp fall-off in those markets.

Perhaps the sharp fall-off in markets is a repricing of uncertainty.  Yet, all of these things have been pretty well known for some time.  The upheaval in just the last couple of months is somewhat a mystery, but is oftentimes how markets work.  Diversification has not been helpful in recent periods – most everything is down.  All that having commitments to bonds got us was avoiding losses, which, I suspect, is the best we can expect for a while.  Yet, I don’t know a better alternative than remaining committed across the board based on established tolerances for risk.  It is the best way to deal with market volatility and the unknowable future.

Bond Markets

Bond markets were about flat for the quarter but up a bit year-to-date.  While providing some respite from recent losses from stocks, this is about what we can expect.

Interest rate increases – feels like we’re “Waiting for Godot”!  The Fed seems to be poised to raise interest rates, which has been the case for a long time now.  This is beginning to take on some of the characteristics of the play “Waiting for Godot”, by Samuel Beckett.  I can’t help but wonder if “Godot” will ever get here, although I’m sure the Fed will eventually raise rates.  While many blame this uncertainty on what’s happening in today’s markets, it’s hard to imagine a 0.25% increase will cause much of an upheaval once it is digested.  But, it does reflect a change in policy that could result in dislocations.  We’ll see.

Emerging Markets   

Emerging markets were off more than 17% in the quarter and year-to-date.  A diversified emerging market portfolio includes allocations to over fifteen countries ranging from China (16%) to Chile (2%).  Using Exchange Traded Funds as proxies, the accompanying table shows the quarter and year-to-date returns in the countries that dominate (86%) the portfolio.  Note the evidence of contagion among emerging market economies as all experience a sharp fall-off in the September quarter.  And, in most instances, it was these results that dragged the year-to-date returns into negative territory. emerging market sept 2015

It seems clear that investors in stocks of emerging market countries have adjusted to the uncertainty of today’s global economy.  We will have to wait and see whether they have gone too far.  In the meantime, participation in the risks and returns of this asset class – which makes up about 14% of worldwide stock markets – is important to a well-diversified stock portfolio.

Predictions and Descriptions

At times such as these, everyone seems to be telling us to get ready for tough times ahead.  Maybe, but market prices anticipate the future about which uncertainty always abounds.  Price changes are driven by surprises.  You can’t predict surprises!

While the causes are constantly changing, if we accept that how market participants deal with an unknown future is consistent, then we can use past behavior to describe the future in terms of both what’s expected and, importantly, a well-defined range of possible outcomes.  The range for most stock markets is quite large – exceeding an annual rate of plus or minus 16% two-thirds of the time.

Stock market participants always expect positive outcomes.  Prices are established from arm’s length transactions by traders satisfied to buy from traders equally satisfied to sell.  Neither would trade unless they expected a positive result.  Of course, in the short run there will be winners and losers.  But, for them to continue to play, the ups and downs will even out and over the long haul markets will produce what traders, on average, expect.  How long must we wait for this to happen?  It could be a while. But, the alternative is to make moves based on someone’s prediction of a surprise!

Yale Beats Harvard – Again

So trumpeted a recent WSJ headline. Yale’s endowment, managed by David Swenson, earned 11.5% for the year ending June 30th.  His acolytes at Bowdoin and MIT earned 14.6% and 13.2%, respectively.  This compares to about 1% that benchmark proxies for a well-diversified portfolio would have earned.  How do these endowments do it?  They hold assets, generally under a category called “Alternatives,” that are not valued from arm’s length transactions – the returns can be whatever they want them to be!

College endowments don’t need to worry about needing cash – when they need money they go to the alumni.  So, the ability to readily turn investments into cash (liquidity) isn’t important.  Endowments can assume this liquidity risk, which can be large and should provide a significant premium.

Now it just may be that David Swenson has special gifts that allow him to identify assets and managers who will provide extraordinary results through time consistently.  And, these gifts can be passed on to whoever will listen.  However, the true value of the endowment’s nonmarketable assets will not be known until there is a need for cash, which is apt to be never.  In the meantime, they have latitude in reporting values and returns that are based on someone’s estimate.  Take with a grain of salt results posted from assets, the values of which are not determined from arm’s length transactions.

As the newest member of the Rockbridge team, I thought I would take this opportunity to introduce myself. Whether you are a client, or another financial services professional, I believe it’s worth taking the time to explain my background, how I got here, and why I decided to pursue a career in the financial services industry.

My name is Claire Ariglio. I graduated from Elmira College in 2014 where I studied Business Administration and Economics. Right out of school, I was hired as an Operations Administrator at a local broker-dealer. Fast forward about a year and a half, and here I am:  a financial planner at Rockbridge Investment Management.

Throughout middle and high school I had an idea, though broad and vague, of what I wanted to do with my life:  help people and work with money or numbers. I was good at math, I was Treasurer of my class for as long as I could remember, and I grew up in a household of accountants; something along the lines of money and numbers had to be good fit. However, I struggled with the specifics of how I was going to make that happen, especially the “helping people” part.

When I entered my freshman year at Elmira College, I was unsure what I wanted to study. I took classes in mathematics education and accounting before I finally declared myself as a business administration major. In my sophomore year, my economics professor approached me and asked if I had ever considered studying economics. She told me I had a natural inclination towards the science and convinced me to give it a shot. Although I never saw myself studying economics, I grew to love it. For my remaining years at Elmira, I learned about strategic management, corporate finance, the stock market, international trade models, development economics, and even a little bit of game theory.

After graduating from Elmira College, I was hired as an Operations Administrator at a local broker-dealer. I thought it would be an excellent introduction to the financial industry, and would serve as the perfect combination of my business and economics degrees. While I was there, I was able to gain a lot of first-hand experience working with clients and was exposed to the industry in a way that can’t be taught in a classroom. After working there for a little over a year, I had the self-realization that I wanted to be more than a member of the operations staff. Although I enjoyed working as part of a team to support our advisors, I wanted to have more of a forward-facing, upfront position that I would be able to grow into. I wanted to have more control over what I was doing on a day-to-day basis. Enter Rockbridge.

At that point, financial planning hadn’t really been on my radar. However, when I heard that Rockbridge was looking to hire more financial planners, I figured why not look into it? It could be the perfect career opportunity hiding right under my nose. I contacted them right away, we set up a few interviews, and the rest, as they say, is history.

Once I learned how Rockbridge conducted their business, I knew it was a good fit both personally and professionally. It was the perfect blend of my love of finance and numbers, and being able to help people. A person’s wealth is one of the most integral parts of their lives, and most people struggle to manage it effectively. There are so many decisions to make when it comes to retirement – “Where and how much should I be saving?” “Is my portfolio diversified?” These are primary concerns for the average person and they are difficult to consider while attempting to maintain a financially stable life; it can be overwhelming without the guidance of a professional. That’s what makes financial planning such a rewarding experience. It’s a job that allows you to ease financial worries simply by laying out a person’s finances all in one place, and getting them on track for a comfortable retirement. The fee-only investment philosophy that Rockbridge implements is also something I love; it truly allows an advisor to act in the best interest of the client without some monetary figure getting in the way. Needless to say, I can’t wait to see where this new journey at Rockbridge takes me.

(And for those of you who were looking for something of some financial substance, here’s one of the most important things I’ve learned from working in this industry:  the stock market is a long-term vehicle. It’s going to have its ups and downs. Don’t be alarmed when the market takes a dive and the value of your brokerage account or IRA decreases. It’s not a loss until you sell everything and realize the loss. Just wait it out, and over the long run, your account should grow.)


No one likes to see their savings decline in value. Times like these are not much fun for investors, watching markets “correct” in the face of abundant global uncertainties. As investment advisors, one of our most important jobs is to help long-term investors keep hold of their long-term perspective. Here are some things to consider.

A drop in stock prices makes us feel poorer – like we lost something – but it only really matters if we are buying or selling now, and if we are buying (or adding to our 401(k)) it’s a good thing!

Watching stock prices fall, and our nest eggs shrink, makes us feel like our financial security is out of our grasp, or at least out of our control. At times like these people say things like, “maybe I should buy real estate.” Land and buildings seem more tangible and sure to hold their value. Of course in 2008 we found out that real estate doesn’t necessarily hold its value, and when it must be sold, prices can swing wildly, just like stocks.

The stock market is very liquid so shares can always be sold at some price. When we try to sell our house in a bad market we say “there just aren’t any buyers right now,” which really means there is no one willing to pay a price I will accept. I could sell at a fire sale price, and maybe my neighbors would feel like they just lost some of their wealth, but until it becomes a blood bath like 2008, most of us would ignore it. We would say, “I’m not selling my house now anyway, so it doesn’t matter.” The difference with the stock market is that we cannot put our heads in the sand and ignore it. The 24-hour news channels are bombarding us with the news of falling stock prices and a tsunami of global uncertainties.

This will likely be a down year for our client portfolios. For clients withdrawing from their accounts, we can use income or sell bonds to provide cash and avoid selling stocks at reduced prices. For others we will be using new cash to buy stocks at reduced prices, and sell bonds to rebalance portfolios by buying stocks.

Three- and five-year trailing returns for stocks are still well above long-term averages. While we could have an extended period of weak returns, we expect markets to behave much as they have in the past, providing reasonable returns to those willing to take risk. We remain convinced that diversification and a steady exposure to stock market risk is still the best approach for long-term investors who are willing to keep a long-term perspective.

“Rockbridge Investment Management Named a Top 100 Wealth Management Firm by CNBC”

SYRACUSE, NY – Rockbridge Investment Management, an independent, fee-only investment management firm serving individuals and families, has recently been named as one of CNBC’s Top 100 Fee-Only Wealth Management Firms.

Rockbridge is the only Central New York firm to join the elite list of wealth management firms across the country.  The ranking methodology, developed by CNBC in collaboration with Meridan-IQ, was carefully formulated based on a variety of standards, including: assets under management, number of staff with professional designations such as a CFP or CFA, experience working with third-party professionals such as attorneys or CPAs, average account size, growth of assets, years in business, number of clients and ability to provide advice on insurance solutions.

“We are pleased to receive this recognition and believe our ranking is a true testament to our profound commitment and dedication to client care,” comments Anthony Farella, CFP® and a Principal of Rockbridge Investment Management.  “As a fee-only based firm, we are built to provide a unique client experience to help families and individuals achieve long-term financial goals in a meaningful way.”

Since its inception in 1991, Rockbridge Investment Management has been providing sound financial advice to clients.  The firm manages $450 million and serves 531 families across the Central New York region.  In February of 2014, Rockbridge relocated to an expanded office in downtown Syracuse where it continues to meet the investment needs and goals of clients.

Rockbridge Investment Management is an independent, fee-only investment management firm serving individuals and families.  The firm advises clients in investment management, retirement planning, life transition planning and 401(k) Administration.  For more information, visit www.rockbridgeinvest.com.

Market Watch recently released an article focusing on the confusion and stress felt by 401(k) savers.  Investors feel the 401(k) options offered are too confusing and they don’t know what to do!  Rockbridge financial planner, Geoff Wells, shared his feelings on how investors can eliminate that stress.

Read the full article here (Market Watch Article)

First and foremost, we would like to thank everyone who participated in our 2013 Client Survey.  We are constantly looking for ways to improve our business and services, and we greatly value your feedback.

For those of you who didn’t get an opportunity to take the survey, I will summarize the results of each of the three sections.  The full results of the survey can be found here: 2013 Client Survey Results.

Rockbridge Quarterly Performance Reports

The majority of survey participants responded that our quarterly statements contained the right amount of information without being overwhelming.

Client Communication Channels

In general, more and more clients are using electronic communications and social media (Facebook, LinkedIn, etc.).  We continue to spend a great deal of time updating and maintaining our website and blog to keep clients up to date.  Unfortunately, we have not made clients aware of the updates, so we plan on increasing that communication in the near future.

Rockbridge Growth

A majority of clients stated that Rockbridge’s most valuable service was to provide unbiased financial advice.  We were quite happy with this response as it is our primary goal as financial professionals.  The survey also showed that clients do recommend Rockbridge to friends, family and colleagues; however, explaining the benefits of Rockbridge can be difficult to describe.

Upcoming Actions

With the survey feedback, we are in the process of implementing a few improvements.

To help clients see all of our new website/blog content, we plan on starting a new monthly email with all Rockbridge updates and key articles.  With the relentless 24-hour financial news coverage, we hope to help clients sift through the noise and highlight the topics that are valuable and important.

We are also increasing our online and social media presence.  Starting in 2014, we will have a completely new website design with video to help clarify the benefits of Rockbridge to both current and future clients.  In addition, we plan on sharing all blog articles and Rockbridge updates on both Facebook and LinkedIn.   If you haven’t visited us online, here are links to our content.  Website, Facebook, and LinkedIn.  With electronic mail, our website and social media, we hope to increase our client engagement and improve our communication above and beyond the traditional paper mail statements, phone calls and in-person meetings.

Last but not least, we are growing and our current office location is no longer big enough to support our staff and clients.  We have signed a new lease for an office at 220 Warren St. which is a half block away from our current location.  We are extremely excited about our new location and will keep everyone up to date on the progress in the near future.  In addition, we felt that a new location goes along with a new logo.  A sneak peak of our new branding can be seen below.

Thank you again for your participation, and please feel free to contact us with additional ways we can make your experience with Rockbridge a better one!

The benchmark bond index that we follow, Barclays U.S. Government/Credit Index, lost 2.5%, the worst quarter since 1994.  In fact the quarterly result has only been worse 8 times in the past 40+ years (162 quarters).

The Barclays U.S. TIPS Index had its worst quarter ever losing 7.1% (data only goes back to 1997).

Markets do not like surprises – even when the information is not really a surprise.  The financial media has dubbed it the Taper Tantrum, which started when Ben Bernanke came out of the Fed’s June meeting and said the Fed would taper its purchases of long-term bonds, if the economy continues to improve.  The so-called quantitative easing program was intended to hold down long-term interest rates to encourage investment, lending, and economic growth.

The market was surprised by Bernanke’s comments, and long-term interest rates immediately jumped.

Morningstar recently reported, “Over the past two-plus weeks, many bond investors have headed for the exits, on the heels of Federal Reserve Bank chairman Ben Bernanke disclosing plans to end quantitative easing.”  This suggests that market participants were assuming the Fed would continue its bond buying indefinitely.

Two things strike me as very ironic:

  1. The market was surprised to hear that something always considered a temporary measure, would eventually end… (when unemployment falls to a target of 6.5% and economic growth seems sustainable without the crutch of monetary policy).
  2. The prospect of improving unemployment and economic growth hammered both stock and bond investors at the end of June, contrary to an expectation that confirmation of economic improvement should be good for stocks.

There is little doubt that markets will continue to be volatile as the Fed proceeds to unwind the unprecedented monetary policy currently in place.  Market participants will try to predict what is going to happen (interest rates will rise – that’s easy); when it is going to happen (more difficult); and how to take advantage (approaching impossible).

There has been a general consensus that interest rates must rise since the Fed took short-term rates to zero at the end of 2008.  Since January 2009 the bond index has provided an annual return of 4.8%, including the most recent quarter, while money market funds and short-term CDs have provided almost no return.  Once again illustrating our long-held beliefs:

  • Markets work, and respond to new information.
  • Markets cannot be predicted.
  • Long-term investors must be willing to endure quarters like this and maintain the discipline of a long-term strategy that is consistent with their risk tolerance.

Volatility returned this quarter in both stocks and bonds as fears about the central-bank actions across the globe made investors nervous about the future.  Large Cap U.S. stocks, represented by the S&P 500 Index, returned 2.9% in the second quarter, bringing the year-to-date return up to a lofty 14.0%.  By contrast, the EAFE Index, a measure of developed international markets, lost 1.0% in the quarter, bringing the year-to-date return down to 4.0%.  In fact, as shown in the graph at right, no other asset class comes even close to the return on U.S. stocks so far this year.

Bonds
The Barclays U.S. Government/Credit Index had a negative return of 2.5% for the quarter.  Bond returns move in the opposite direction of interest rates.  The yield on the 10-year Treasury moved from 1.6% at the beginning of May all the way to 2.6% in June, before pulling back slightly to end the quarter around 2.5%.  The increase in interest rates was the cause of the negative bond returns for the quarter.

Bond markets were hammered after Fed Chairman Ben Bernanke announced last month that the bank may start winding down its bond-buying programs.  The Fed policy of buying bonds to keep interest rates artificially low was intended to spur the economy and reduce unemployment.  Many economists came out against the policy fearing a dramatic increase in inflation.  However, inflation has been quite modest and the market expectation for future inflation is quite low.  While the Fed policy continues to be controversial, the unemployment rate has fallen to 7.6% as of the end of May 2013.

We still expect challenges ahead for the bond market as interest rates rise.  However, we cannot predict when and by how much rates will rise in the future.  Therefore, we continue to advocate holding high quality bonds in a portfolio.  Bonds dampen volatility of a diversified portfolio while also providing income over a long investment time horizon.

Other Asset Classes
Emerging Market stocks continued their year-long decline, reporting a negative return of 8.0% for the quarter.  Global uncertainty in these young volatile markets likely fueled the sell-off in emerging market stocks.  The Dow Jones REIT Index, a measure of the U.S. real estate market, also reported a negative return of 1.3% for the quarter but was positive year-to-date with a return over the last 6 months of 5.7%.  Emerging Market stocks and REITs continue to offer investors diversification benefits in global portfolio construction.

The USA Today published an article by our one and only Tony Farella. (Link)

The full text version is shown below.


Is it worth paying for 401(k) advice?

Christine Dugas, Money Watch columnist5:13p.m. EST March 9, 2013

Money Watch, a personal finance column that runs every Saturday, features a financial planner from the National Association of Personal Financial Advisors answering reader questions about saving, protecting and growing your money. To submit a question, e-mail USA TODAY personal finance reporter Christine Dugas at: cdugas@usatoday.com.

Q: My employer offers a service in which an investment company manages my 401(k) savings. The cost is an annual rate of 0.25%. They have a chart that says people normally do 3% better on their investments with their help. I would prefer to see independent results. But being ignorant of the markets, would I be better off getting help? I’m at least 15 years from retirement.

A: Many employers are adding professional investment management services to their retirement plans. I’ve seen the cost of these services range from 0.25% to 1.0%, so it appears that it’s a pretty good deal for you.

Studies do suggest that investors who use advisers do get better returns than individuals going at it alone, but there is no reason that should be true if an investor does some basic research. It’s not magic. Advisers usually have confidence and discipline that are key factors in successful investing.

Most people do not have the time or interest in managing their own portfolios. Individual investors can be their own worst enemy by making emotional decisions about their investments. Those decisions include bad timing (getting out of the market during a crisis), chasing hot sectors of the economy or jumping into the latest investment fad being touted by the news media.

A good investment adviser can remove the emotion and focus on the important factors in creating an appropriate retirement portfolio.

Ask yourself these questions:

1. Do I know how much I need to save each pay period?

2. What is the total amount I need to save before my retirement?

3. What return do I need to reach my goal?

4. Do I have a diversified, balanced low-cost portfolio?

5. Am I taking the right amount of risk to reach my goal?

6. Do I have the discipline and confidence to stay the course when things get rocky?

If you don’t know all six of the answers, then an independent adviser could be quite valuable. Armed with the correct information, the adviser can construct a well-diversified portfolio that’s specifically designed to give you the best chance of maintaining your lifestyle in retirement.

Anthony Farella, NAPFA-Registered Financial Advisor

Rockbridge Investment Management, Syracuse, N.Y.

As we start a new year filled with promise, I would like to share our story with you.  We view Rockbridge Investment Management as a community of talented professionals and clients who value our services.  Working together with our clients we hope to fulfill our collective goals of financial independence and well being.

Our Vision
Our vision continues to be the foundation of our success:

Rockbridge Investment Management is a group of like-minded professionals working with a select group of clients with whom we can have a significant impact.  Everything we do is focused on building and preserving wealth for our clients.  We help remove complexity so clients can focus on the simple but often difficult process of successful investing.


Firm Growth
Our growth over the past three years has been steady and significant.  At the end of 2009 we served 457 clients.  Today we have 562 clients and an annualized growth rate of 8% per year.  The leadership team is committed to growing the firm by adding professionals who are passionate about our philosophy and vision.  We want the firm to endure for the long run and we have the capacity for steady growth.  Our succession plan is designed to include our younger advisors in the ownership of the firm over time.

Strategic Plan
Our firm continues to grow organically through referrals from our existing clients and professional relationships.  As a team we meet twice a year to evaluate and discuss our strategic goals for the business.  While investment management remains the focus of the firm, we recognize the need for risk management, tax and estate planning, so we continue to build our network of referable professionals to address the varied needs of our clients.

New Advisors
In 2012 we added two advisors to our team of professionals.  Geoff Wells started in October after relocating back to Central NY from Texas.  Geoff completed the Certified Financial Planning coursework and passed the CFP exam last year.

Scott Poppleton, a Manlius resident, joined us in November after several years in the military and the defense industry.  Scott has a passion for financial planning and is developing a second career helping others achieve their financial goals.

To learn more about Geoff and Scott, visit www.rockbridgeinvest.com/who-we-are/

Communications
New technologies have given us more opportunities to tell our story and add valuable services.  We invested heavily in our website as a way to communicate important information to our clients in a more timely manner.  The website also tells the story of our firm and attracts people who are literally searching for fee-only objective advice.  We have no plans to advertise our services and rely on our community of clients to refer others in their own personal or professional networks.

The need for objective advice and professional investment management has never been greater in our history.  We are well positioned to serve our clients and help more people who turn to us for advice in the future.  We truly appreciate your trust in us and we all look forward to building our community together.  Happy New Year!

Financial markets did very well in 2012, with stocks returning 16%-18%, which is significantly above long-term averages. During the fourth quarter markets seemed to cling to an assumption that the fiscal cliff would be averted, or at least end in something less than a catastrophe. Domestic stocks ended the quarter very close to where they started, despite a bumpy ride on the hopes and fears related to the fiscal cliff and other issues. International stocks, on the other hand, had a great quarter as bad news about the Euro crisis gave way to cautious optimism. So after lagging for the first three quarters of the year, international stocks’ 2012 performance slightly exceeded that of the broad U.S. market.

Bonds had another surprising year, showing that low interest rates can go even lower. The broad bond market had returns exceeding 4% with yields under 2%, meaning bond values appreciated as rates came down. Someday this process will reverse itself. When interest rates rise, depreciating bond values will easily overwhelm low yields producing negative bond market returns. A reasonable predictor of bond market returns over the next decade is the current interest yield, making 2% annualized returns a realistic expectation.

Balancing the Doom and Gloom
Stories about a “new normal” and near-zero growth expectations for the U.S. economy have circulated widely in the financial press. Some of these stories are based on complicated economic analyses, but many, in the end, extrapolate our recent experience and conclude that our economic future will be disappointing.

If we are really in so much trouble, why does the market not reflect this expectation of gloom? The media loves doom and gloom. In fact “good news” seldom makes the news. Unless it is coverage of SU’s bowl victory, or Coach Boeheim’s 900th win, the 11 o’clock news is generally about things we wish never to happen.

So to provide some balance, I am pleased to report that at least a few people hold contrary viewpoints.

In a recent article, Laurence B. Siegel writes, “We have heard concerns about the permanent slowing or stopping of global growth after every depression or severe recession. In the 1890s, the idea was circulated that everything worth inventing had already been invented. In the 1930s, it was popular to say that capitalism had created the mechanism of its own destruction. In the 1970s, concerns focused on foreign competition and resource constraints, and some people forecast mass starvation. Today’s concerns are no different in principle, and they are no more realistic.”

In a video and transcript recently posted by Vanguard Chief Economist Joe Davis, he makes a strong case for optimism about the future (https://advisors.vanguard.com/VGApp/iip/site/advisor/research/article/ArticleTemplate.xhtml?iigbundle=IWE_VideoEcoOutlook&oeaut=TsqRFpiuAY). In a theme shared with the Siegel article, he talks about the three industrial revolutions experienced in the U.S. The first started with the invention of the steam engine, which changed manufacturing and revolutionized transportation. The second started with the invention of the light bulb, which led to wide-ranging innovations that revolutionized many aspects of American life. The third revolution he attributes to the invention of the microprocessor in the early 1970s.

As happened in the first two industrial revolutions, Davis argues that we are now in a lull of the third, which is likely to be followed by a resurgence of innovation and investment, based on the global application of still evolving technology. He makes a strong argument for optimism.

We could experience more of the recent past, with sluggish growth and high unemployment, or we could see a return to more normal growth rates, driven by innovation and investment as suggested by Joe Davis. Neither scenario is certain. When markets seem inconsistent with the drumbeat of media, remember to listen for the whispered viewpoint of the contrarian. The future is never certain, but the better we can understand that a range of outcomes is possible, the less likely we are to be caught by surprise, and be unprepared for a future that is different than the recent past.

The equity markets finished a very strong quarter in September, erasing the losses of the second quarter, and more, pushing returns solidly into double-digit territory for the year.

If the S&P 500 could hold its 16% gain through the next quarter, it would be the third best annual result of the past decade, and above the historical average of 10%-12%.

Bonds also provided positive returns for the quarter.  U.S. Treasury yields remained fairly constant for the period but interest rates paid by high-yield issuers (junk bonds) continued to fall, so increasing values boosted returns for bonds that are subject to credit risk.

In the chart at the right you will also see that Real Estate (REITs) had a poor quarter, allowing other parts of the equity market to catch up on a year-to-date-basis.

Some Things Cannot Last Forever
Herbert Stein was a distinguished academic and chairman of the President’s Council of Economic Advisers in the 1970’s.  He formulated “Herbert Stein’s Law,” which he expressed as “If something cannot go on forever, it will stop.”

One thing that cannot go on forever is high bond returns, resulting from falling interest rates.  At some point, rates hit bottom, and if not there yet, we are getting close.  Rates could fall more from current levels – we need only look to Japan for evidence of that possibility.  However, the Federal Reserve is now taking extraordinary measures to avoid the Japanese spiral of deflation that seems to be a big part of their problems.

Treasury Inflation Protected Securities (TIPS) have also benefited from falling rates in recent years, particularly the decline in real interest rates (the rate received net of inflation).  The total return for TIPS this year is 6% and the annual return for the past five years is 7.6%, far ahead of the S&P 500, which gained only 1.1% over the past five years. 

Some may think these returns will continue.  Vanguard reports that in the past three years, TIPS funds garnered about $42 billion in net cash flow, representing just under 50% of the net cash flow received by TIPS funds in the ten years through June 2012.

Yet anyone investing in TIPS based on recent returns is very likely to be disappointed.  The current pricing on TIPS reflects a market expectation that returns will just offset inflation over the next decade – an expected nominal return of 2%-2.5%, and a real return of 0%.

TIPS are also risky.  TIPS funds are sensitive to changes in real interest rates and short-term returns can be volatile.  Since 1997 when TIPS were first issued, there has been at least one 12-month period where TIPS lost 7.5% and another where they gained almost 20%.

So, why own TIPS at all, if expected returns are poor, and risk is significant?  Well, they are still the most effective way to protect against an unexpected rise in inflation.  If inflation averages more than 2%-2.5% over the next ten years, TIPS will provide a greater return to help offset the effect of inflation, so they can still provide valuable diversification.

TIPS can still play a role in a diversified portfolio, but investors should keep their expectations realistic – they will not provide the kind of returns we have seen in the past five years.  An increase in real interest rates will have a negative impact on TIPS returns.  A more detailed discussion of this topic is available in a research report written by Vanguard in September 2012, at https://personal.vanguard.com/pdf/icrtips.pdf.

ONE:  Focus on the near term.  A recent headline reads, Anxious financial advisers scale back summer vacations.  “Still haunted by the 2008 financial crisis, many financial advisers are scaling back their summer vacations or giving up on them entirely.  Many are afraid to be out of the office in case this is the third straight summer in which markets are hit with severe volatility.” Reuters (21 Jun.)

Staying home from vacation to do what?  These statements seem to imply that a smart, clever advisor will know what action to take when news breaks.  Buy, sell, move everything to cash until markets stabilize?

It is unfortunate that investors can only determine market stability after the market reacts to the hope or possibility of stability.  It sounds so appealing to stay out of volatile markets and invest only when we can expect stable, positive returns, but by the time stability appears, prices have risen, and it’s too late.  We expect successful business managers to take action when presented with new information, but an emotional reaction to new information can be very dangerous for an investor, leading them to buy high and sell low.

TWO:  Touting what would have worked in the last crisis.  Hedging, or insuring against volatility is also appealing – who wouldn’t want the return without the risk?  Keep in mind that insurance companies make a profit by accepting a transfer of risk. The same is true in financial markets.  Just like dental insurance premiums are sometimes less than what you collect in annual benefits (you win!), portfolio insurance sometimes pays off, but on average the insurance company makes money, and on average portfolio insurance reduces your expected return.  Remember, expected return is a function of how much risk you are willing to accept.  Therefore any strategy that reduces your risk to zero will also reduce your expected return to zero – or less because of the insurance premium.

THREE:  It’s different this time.  No really, it’s different.  Much industry attention is now focused on the current trend of adding alternative investments like hedge funds and private equity to a portfolio because their results are not correlated with stocks.  Diversification is the only free lunch in investing.  Blending together a mix of different asset classes with different risk and return characteristics can produce a portfolio with a better balance of risk and return than any of the individual asset classes.  However, it can be argued that calling hedge funds a separate asset class is like calling lottery tickets a separate asset class, because their results are not correlated with the stock market!  Hiring a hedge fund manager to buy some stocks and sell others short is likely to produce uncorrelated results but not necessarily improve portfolio results.

FOUR:  Holding up winning bets as if they resulted from skill rather than luck.  The popular press, as well as the financial industry media, loves to idolize winners.  They talk about trading strategies, hedging strategies, managing volatility, etc.  It seems ironic to me that almost everyone acknowledges the futility of day trading, that popular pastime of the late 1990’s when people thought they could make a living buying and selling stocks in a rapidly rising market.  Yet we are still seduced by the current crop of strategies that are based on the same underlying notion – that someone can outsmart markets by predicting the future when the outcome is unknowable.

Some questions to help you avoid the hype surrounding the next great idea put forth by the financial media:

  1. Does it make sense as a long-term strategy?
  2. Is it based on an understanding of how markets work, or does success hinge on someone predicting unknowable outcomes?
  3. Is it really a different kind of asset or just a familiar asset class in an expensive wrapper that cleverly alters short-term results (indexed annuities and buffered investment contracts come to mind)?
  4. Will a successful result come from skill, or luck, and is there any way to judge skill in advance?

These are important questions for long-term investors who want to avoid the pitfalls of emotional response to market volatility.

Equity markets had a rough second quarter.  For the period ending June 30, 2012 the S&P 500 index (large stocks) was down 2.8%, the Russell 2000 index (small stocks) was down 3.5%, and the MSCI EAFE index (international stocks) was down 6.9%.  The international index might have seen a double-digit decline were it not for some good news on the European debt crisis and a big rally on the last trading day of the quarter.

At the end of the first quarter I noted that, “the European debt crisis seems far from solved, and yet just the absence of bad news has had a surprisingly positive effect on global equity markets.”  Bad news returned in the second quarter, and the results reflect it.  Of course the discouraging new information was not limited to Europe as the Chinese economy showed signs of slowing down, and the U.S. recovery continues to struggle.  Nonetheless, returns for the year to date remain in positive territory, even for the international markets.

Portfolio returns were also buoyed by the strength of fixed income returns.  The broad bond index that we track was up 2.6% and some long-term government bond funds were up 12%.  The yield on 30-year Treasury bonds fell from 3.35% to 2.76% during the quarter, causing the jump in value, but reflecting the market’s expectation that low interest rates will persist for many years.  For anyone who thinks rates MUST go up from these levels, it is instructive to consider Japan.  Ten-year government bonds in Japan have been around or below 2% since 1998 and now provide a yield of just 0.85% (U.S. 10-year debt was yielding 1.67% at the end of the quarter).

2012 is showing once again that stock market returns can only be enjoyed if we are willing to accept risk and volatility.  We can also observe the benefit of diversification and the way bonds reduce volatility in a stock portfolio.

Equity markets got off to an outstanding start in 2012.  Returns for the first three months represented the best yearly start since 1998, as the S&P 500 was up 12.6%.  As you can see in the chart, equity markets were generally up 11%-13% with emerging markets up 14%.  The broad bond market essentially broke even for the quarter, while riskier bonds, like high-yield corporates, were up as much as 5%.

Equity returns exceeding 10% would be welcome for the year, say nothing of the quarter.  Some fear that we are now due for a correction, as the markets have risen too rapidly.  We try never to predict future market movements, but it is worth noting that the S&P 500 index, ignoring dividends, reached 1530 back in March 2000.  It got back to 1560 in the fall of 2007 before retreating, and it is now hovering around 1400, meaning that the value of the 500 largest U.S. companies is still well below the level first attained twelve years ago, and earnings continue to improve.  So while a correction is always possible, there seems equal opportunity for further upside.

It is also interesting to note how much less volatile markets have been in the last quarter as the debt crisis in Europe generates fewer alarming headlines, and other economic news has taken on a positive tone.  The European debt crisis seems far from solved, and yet just the absence of bad news has had a surprisingly positive effect on global equity markets.

Should Passive Investors Feel Bad About Getting a Free Ride?
The efficient market allows passive investors to get a free ride – market returns at minimal cost while others do the work.  Diligent, hard working analysts and active managers are determining the true value of individual stocks and bonds, and driving prices toward those values in an auction market.  Meanwhile, index funds come along and buy a market basket of securities at the market price without doing the work to determine if the prices are fair.

But What Happens When Everyone Buys the Index?  Who Keeps the Market Efficient?
As a believer in the advantages of index funds, I have been asking these questions since before we started an investment advisory firm in 1991.  By that time, index funds had been available to institutional investors for a few years, but they were just beginning to take off with smaller investors using mutual funds.  The new products allowed us to utilize institutional money management strategies for small investors, and it seemed clear that everyone should adopt the new innovation that allowed anyone to get market returns at low cost.  Alas, not everyone saw the world as we did, and they probably never will.

Nonetheless, we now see growing talk of passive management dominating markets, and having a detrimental effect on market function.  In fact it has become the topic of serious research.

The latest issue of the Financial Analyst Journal includes an article, “How Index Trading Increases Market Vulnerability” (Sullivan and Xiong, March/April 2012).  It reports that, “the authors found that the rise in popularity of index trading – assets invested in index funds reached more than $1 trillion at the end of 2010 – contributes to higher systematic equity market risk.”  The implication is that traders are buying and selling the whole market basket without regard to the merits of individual stocks.  I have seen presentation materials from at least one active manager using this argument to help explain why it has been so difficult for them to outperform the market.

On the other hand, Jack Bogle, the founder of Vanguard often credited as the father of index funds, sees the growth of passive investing as a triumph.  About 25% of mutual fund assets are now invested in index funds.  Also, ETFs (Exchange Traded Funds) which typically track an index but trade throughout the day, now represent about 30% of trade volume in U.S. equity markets, having grown from essentially zero in 12 years.   Appearing at a recent conference, Bogle said that in the last five-plus years, index funds have gained $600 billion in assets, while active managers have lost $400 billion.  He says that investors have to be persuaded by the growing evidence that index funds work.

So, will the dominance of passive investing destroy the free ride?  I am not worried.  I believe there will always be plenty of people willing to pay smart analysts to keep the market efficient.  My latest evidence of this was published in the New York Times on April 1, 2012 in an article entitled, “Public Worker Pensions Find Riskier Funds Fail to Pay Off.”  The article reports on public workers’ pension funds across the country, increasingly turning to riskier investments in private equity, real estate and hedge funds…“but while their fees have soared, their returns have not.”

It goes on to explain that the states using more of these alternative, actively managed investments have incurred higher fees and worse performance, compared to the states that stuck with a more traditional mix of stocks and bonds.  Yet the Oklahoma Teachers Retirement System, which has done well over the past five years with a mix of stocks and bonds, is putting 10 percent of its fund into private equity and real estate funds.  When asked about the higher fees, the fund’s executive director said, “We believe the outperformance from moving into these categories can justify the additional fees,” demonstrating that hope springs eternal, and that Mr. Bogle is an optimist to think that investors will be persuaded by the facts.  I think passive investing has a bright future, and I will be happy to continue taking that free ride.


Over the holidays, many of our clients and friends asked how business is going.  I thought it would be a good time to provide an update on Rockbridge Investment Management and what we are looking forward to in the New Year.

Financial Results
As a firm, Rockbridge continues to grow steadily.  Over the past two years we’ve grown the amount of assets under management by 20% from $194 million to $232 million.  While the markets have contributed to this increase, most of this rise is due to new clients who have discovered our firm via a referral from a current client or through our website.

Surprisingly, a significant number of our new clients have found us via our website after searching for a local fee-only advisor.  We’ve invested in website improvements to bring our story to more people.  We don’t have an advertising budget and rely on referrals as our main source of new clients.

Our Business Model is a Winner
While our clients know this, it’s worth repeating.  Rockbridge is a fee-only Registered Investment Advisor (RIA).  Our only source of revenue is from fees paid by clients.  We have never accepted a commission from a product we recommend.  The fee-only RIA business model has experienced steady growth while commission-based brokers continue to lose market share as individual investors discover the value of working with an objective fee-only investment advisor.

Our Fees Are Modest
Our mantra continues to be “costs matter.”  The amount an investor pays in investment costs will definitely affect their standard of living.  We continue to have a relentless focus on costs for our clients.  Each year, Charles Schwab surveys the advisors they service.  Rockbridge participates in order to benchmark our firm against others like us.  The survey revealed that our management fees are less than our peers.  Our fees for a typical client average .50% of assets managed versus our peers whose fees average .67%.  Lower investment costs mean more money in our client’s pocket.

Education Never Ends
Our firm is part of a study group of likeminded advisors committed to the passive investment philosophy.   We meet quarterly in New York City to discuss investment strategies or products and compare notes on our business practices.  The insight we get from these meetings makes us better advisors.  We also continue to be a member of The National Association of Personal Financial Advisors (NAPFA).  NAPFA is the country’s leading professional association of fee-only financial advisors—highly trained professionals who are committed to working in the best interests of those they serve.  NAPFA holds several training events throughout the year that we are proud to be a part of.

Plans for 2012 and Beyond
We will continue to meet with clients to review their investment plans.  There is no way to predict future returns; however, we are confident that markets will reward investors for taking investment risk over the long term.  Expected future returns may not be as high as in the past, as articulated in Craig’s accompanying article, so we will continue to help clients determine the right amount of risk to take in order to meet their financial goals.

Changes in technology and new investment products are introduced at an ever increasing pace.  We take time to evaluate new technologies and products on a regular basis.  We spend money on technologies that make us better, more productive advisors.  We are slower to make changes involving new investment products since many are designed to maximize profit  for their own companies, not necessarily for their investors.

Our strategic plan for the next three years calls for modest growth both in new clients and firm revenue.  Our five professional fee only investment advisors have capacity to help more individual investors.  As the baby boom generation is poised to start retiring, we look forward to referrals from our clients and professional networks.

Recent regulatory changes to be enacted in 2012 will shine a light on the abuses in the 401(k) marketplace, especially for small employers.  At Rockbridge, 31% of our revenue comes from managing 401(k) plans for small business owners.  We are poised to be an objective partner for other small firms who care about their employees and their retirement goals.

In conclusion, we continue to be passionate about our investment philosophy and thoroughly enjoy working with and educating our clients.  Personally, I enjoy coming to work every day surrounded by smart, confident, passionate people.

ONE– Stock market returns are seldom what we expect.
The S&P 500 index was up 2% for the year, after being up 8% at the end of April and down 12% at the beginning of October.  Large stocks did better (Dow up 7%); small stocks did worse (Russell 2000 down 4%); and international stocks did much worse (EAFE down 12%).

It is unusual for the S&P 500 to move so little from one year to the next, but it is also unusual for it to behave the way we “expect” it to behave.  Since 1926 the average annual return has been about 11%, and yet over those 86 years, the annual return has fallen between 8% and 13% only 6 times.  The range has been -43% to +54%.

TWO – Regardless of the returns we realize, markets are volatile. 
In other words, we often experience the risk without realizing the commensurate level of return.

2011 certainly felt like a rollercoaster, and the stock market was indeed volatile.  Yet was that volatility unusual considering world economic events?  The experts at Vanguard say no, and provide evidence in a recent paper.  Their evidence is based on a comparison of economic volatility and market volatility, which turn out to be closely correlated.  Moreover, they show that the volatility of the economy and markets was higher in the 1970’s than it has been over the past five years.  Risk and return are related, but we only observe the correlation in the long run.

THREE– When “everyone agrees” on the likely direction of a market (or prices, or interest rates) they can still be wrong.
At the beginning of 2011 “everyone agreed” that interest rates had to rise from current levels.  Bill Gross was one prominent expert who put his money where his mouth was, declaring that U.S. Treasury yields were so low they did not adequately compensate investors.  He sold Treasuries out of his portfolio.  It turned out to be a spectacularly bad decision as Treasury rates fell further and his fund, PIMCO Total Return, the largest bond fund in the world, underperformed.

What is a reasonable range of expected returns…
We have all read the standard performance disclaimer, “Past performance is no guarantee of future returns.”  That warning has rarely been more important or relevant than it is today.

Bond returns have now outperformed stocks over the past ten years.  Mutual fund investors continue to pour money into bond funds in response to stock market volatility and, we assume, in part because of attractive past returns.

Vanguard published a paper in November 2011 that tried to answer the question, “What is a reasonable range of expected returns for a balanced portfolio of stocks and bonds based on present market conditions?”  For the full paper, click here:  https://advisors.vanguard.com/iwe/pdf/ICRLYVE.pdf?cbdForceDomain=true

They present several interesting conclusions including:

•  Expected returns for a 50% stock/50% bond portfolio are 4.5% to 6.5% nominal and 3.5% to 4.5% in real terms (after adjusting for inflation).  This result is modestly below the average since 1926 (8.2% nominal and 5.1% real) but better than the past decade.

•  Expectations for the next decade are driven by the current level of bond yields, which are highly correlated with future annualized returns from bonds.

•  The chart below shows expected returns for a more risky portfolio (80% stocks/20% bonds) more consistent with the historical average while the expectation for a less risky portfolio (20% stocks/80% bonds) less likely to achieve historical results.

Real (inflation-adjusted) returns


Notes:   Percentile distributions are determined based on results from the Vanguard Capital Markets Model.  For each portfolio allocation, 10,000 simulation paths for U.S. equities and bonds are combined, and the 10th, 90th, 25th, and 75th percentiles of return results are shown in the box and whisker diagrams.  The dots indicating U.S. historical returns for 1926-2010 and 2000-2010 represent equity and bond market annualized returns over these periods.  The equity returns represent a blend of 70% U.S. equities and 30% international equities; bond returns represent U.S. bonds only.

Sources:  Barclays Capital, Thomson Reuters Datastream, and Vanguard calculations, including VCMM simulations, and index returns.

•  With ten-year Treasury rates below 2%, it is irrational to expect bond returns over the next decade to be anything like the past decade, and nearly impossible mathematically.

•  Stocks, on the other hand, appear reasonably priced, capable of providing average historical returns, and quite likely to do better than the past decade, which began with stocks very highly valued (Price/Earnings ratios well above historical averages.)

Conclusions/Take-Aways

1.  Expect returns from balanced portfolios to be below historical averages over the next decade due primarily to low bond yields.

2.  The incentive to take stock market risk (relative to bonds and cash) may be as high as it has ever been.

3.  Chasing the bond returns we have seen over the past decade is ill-advised.

4.  Taking more stock market risk may be tempting, but comes with greater volatility.

5.  Most investors should stay the course, with a balanced portfolio that reflects their long-term tolerance for risk.

Last year I wrote an article about where to invest in 2010 and took that opportunity to remind investors not to fall into the excitement of active management and stock trading.  Instead I cautioned them to focus on what you can control, like investment cost, risk, and asset allocation and to ignore the rest.  So did I steer readers in the right direction?  I was most confident that I had, but figured I would do some research on how one of the loudest stock trading icons had fared over the past year.

As the host of his show Mad Money, Jim Cramer is constantly on CNBC giving investment advice to listeners.  In December of 2009, he stated that 2010 was the year of active investing and in particular certain sectors had a clear advantage.  After the turmoil in 2008, he saw the financial industry as a definite opportunity in 2010 and named off several companies to buy.  Not to my surprise, half of the stocks rose in value over the year while the other half showed negative year-end returns.

Furthermore, Cramer saw an opportunity in the energy sector, specifically in the recovery of natural gas versus oil.  Here he listed over a dozen companies to invest in, with one of his favorites being a company that makes engines that run on natural gas and other alternative energies.  The total return of these stocks for the year was 11.72%, and that is before you take into consideration trading costs.  An investor in the small-cap index, Russell 2000, saw a 26.9% rate of return while taking on considerably less individual company risk.

Yet maybe 2010 was just a bad year for Cramer.  I mean he does have a show on national television so he must know what he is doing, right?  Since 2000, an objective research team from Massachusetts has tracked Cramer’s stock predictions to see how he has done.  What they found was that over those ten years only 47% of the time had Cramer beaten the benchmark return through his stock picking!  After watching his show, that seems like a lot of wasted energy to only beat benchmark returns at a rate less than that of a simple coin toss.

There is one takeaway from Cramer’s show that I do think all investors should listen to.  On more than one occasion, Cramer reminds listeners that “no one will ever care more for your money than you do” and there is so much truth in that statement.  Television ratings are the main goal of Cramer’s Mad Money series, and most investors have very different goals when it comes to their retirement accounts.  A trusted advisor will put your interests first, and by doing so, you will have a much higher likelihood of achieving a successful retirement!

Capital Market Recap
Investors experienced positive returns in virtually every asset class during the first quarter of 2011.  Small U.S. stocks led the way with returns exceeding 8%.  Emerging international markets were in negative territory for most of the quarter but ended in the black.  Large company stocks around the world managed to shrug off the impact of natural disaster and nuclear crisis in Japan, political upheaval in the Middle East, and lots of other bad news, to provide returns in excess of long-term expectations.

Trailing period returns now incorporate two years of recovery since the market bottomed out in the spring of 2009.  Major indices like the S&P 500 remain well below the peak values reached in the fall of 2007 (1320 now versus 1560 then) but well-diversified portfolios have recovered their value thanks to the strength of small company stocks and the receipt of dividends.  The major indices now show positive returns when we look back three, five and ten years, with the exception of international stocks (EAFE) over the three-year period.

The bond market continues to labor under the burden of low current yields and the threat of higher inflation, which could push interest rates up and bond prices down.  In the meantime, bond returns were slightly better than break-even for the quarter, as the asset class continues to perform its role of adding stability to a diversified portfolio.

Walmart vs. Gold – How will investors be rewarded?
In a recent issue of Grant’s Interest Rate Observer I saw a discussion of the inflation hedging attributes of gold, compared to the common stock of Wal-Mart Store, Inc., and some interesting comparisons of how the two investments have performed over the past three decades.

In the summer of 1999 gold was worth about $250 per ounce.  It now trades for more than $1,400 per ounce.  Walmart stock, on the other hand, has traded in a range around $50/share since 1999.  So, it’s easy to see which was preferable to own over the past ten or eleven years.

Why have Walmart investors seen such poor returns?  Has the company been doing that poorly?  The answer – the company has done very well.  In fact, sales have grown at a compounded annual rate of 8% over the period while earnings have grown at a rate of 11% and dividends at a rate of 17%.  Book value per share has grown at a rate of 13%, but the market value has not changed!  The difference – investors were willing to pay 50 times earnings in 1999 but only 12 times earnings today.  So the company has grown and been profitable, and is expected to continue its profitable growth, and yet investors were not rewarded.  The market seems to have concluded that it will now be difficult for the largest retailer in the world to continue growing at the explosive pace it set in the 1990’s, which justified the large multiple for its price relative to earnings.

The collapse of the price/earnings ratio implies a change in the underlying assumptions about Walmart’s growth prospects, while the price of gold tells us something about the market’s fear of inflation.  But what conclusions can we draw about returns over the next ten years?

If markets are rational, we would expect similar risk-adjusted returns from gold and Walmart stock – why were they so different over the past eleven years?  Well, the events of the past 11 years would have been difficult to predict in 1999.  Walmart was growing like a weed, on its way to becoming the largest retailer in a world driven by exploding consumer demand.  Gold, on the other hand, had been worth $850 an ounce in 1980, when inflation in the U.S. reached double digit levels and the value of the dollar was in jeopardy.  From that point gold lost 70% of its value.

If someone told you in 1999 that Walmart’s price would stagnate while the price of gold grew to five times its value, you would not have believed them!  No one could have predicted the series of events about to occur.  The collapse of the technology bubble was followed by America’s war on terror, a real estate bubble, and then the credit crisis that led to the deepest recession since the Great Depression.  Will the next ten years be as unpredictable….probably.

Observations:

1.  There is no way to predict which company or asset class will blow through market assumptions to provide surprisingly good or bad returns.  The future is unknowable and we will continue to be surprised.

2.  Succumbing to emotion, or placing too much value on what has happened recently, will almost certainly have ill effects on investment outcomes.

3.  Non-earning assets, like commodities and precious metals, will continue to be difficult to value precisely because they are non-earning.  The value of any asset can be defined by the cash it is expected to produce in the future, but the only cash gold can produce is the price some future buyer is willing to pay.

4.  Ten years is simply not a long period of time when looking at history to develop expectations for the future.  It is very unlikely that the next ten years will look anything like the past ten.

As investment advisors our job is to understand what risks are important and help clients navigate through uncertainty.  Sometimes it is necessary to look beyond the past ten years to gain perspective.

Capital Market Recap
Equity markets finished the year with a flourish.  Read more

Join Rockbridge Investment Management in welcoming author and Le Moyne professor John Langdon as he discusses the expanding global economy and its impact on investors. Read more

Equity Markets
Equity markets finished the third quarter with a very strong performance in September, bringing all major categories into positive territory for the year to date (YTD).  Read more

Experienced investors have heard this before. It is a headline used many times over the last 60 years.  Fear sells.  So the media sells high unemployment, potential deflation, and pending economic gloom.  Some in the investment community join in the chorus, but fiduciary advisors have a responsibility to muffle the noise and help investors take fear and emotion out of their decision process. Read more

After a pretty robust recovery in 2009 and 2010, the stock market took a dive in the last two months.  The talk of a “double-dip recession” is reaching a fever pitch.  Read more

First quarter stock market gains were erased during May and June leaving values well below the high water mark reached in the fall of 2007.  As the chart shows, large-cap stocks (S&P 500) have lost nearly 10% annually over the past three years.  Read more

Financial markets continued their winning ways in the first quarter of 2010 marking four consecutive quarters of positive stock market returns.  The chart at right shows the impressive performance of small company stocks during the past three months and the fact that all major asset classes had positive returns.
Read more

The Year Was Good, But Not Remarkable By Historical Standards
The history books will show that 2009 was above average but an unremarkable year for stock market performance. The S&P 500 returns exceeded 26% for the calendar year, which barely qualifies as top-quartile performance as 19 of the previous 80 calendar year periods saw higher returns. Of course this calendar year comparison ignores the 25% falloff in the first three months and the subsequent dramatic recovery. So, for those of us who have lived through the past two years, it will be a time to remember.

Read more

As we venture into 2010 and beyond, I would like to share some information about our firm, Rockbridge Investment Management.  We have a clear vision for why we exist as a firm.  While our vision guides what we do on a daily basis, it is important to know where we stand today and set goals that will ensure continued success.

Read more