Nvidia: A Bubble or Rational Exuberance
Clearly, the stock market is positive on the future of Artificial Intelligence (AI). The trajectory of Nvidia, a company engaged in the production of products for the industry, is especially a case in point. Its stock price has nearly doubled since the first of the year – up 220% over the trailing12-months. Truly extraordinary and raises the “bubble” question.
A bubble is characterized by a rapid run-up of asset prices that is well above any reasonable measure of intrinsic value. Unfortunately, it is best recognized in hindsight. Adding to the uncertainty, it oftentimes is in response to the emergence of a new paradigm. Clearly AI fits. However, while the recent rise in Nvidia’s stock price reflects exuberance, it’s a bubble if it strays dramatically from a reasonable measure of its value.
Nvidia reported a blockbuster fourth quarter – year over year sales up 265% and income up 769%. Its current PE ratio is 40 times projected 2025 earnings, well above market averages and signaling “exuberance.” However, stock prices reflect expected future earnings well beyond a year. While projecting earnings far into the future, especially in this AI-uncertain environment is tricky, Nvidia is a legitimate company that is well-positioned in the industry. While, no doubt, there will be volatility as new information in an uncertain environment emerges, generally, prices established in a well-functioning market are the best reflection of an uncertain future.
Market Review
Stocks
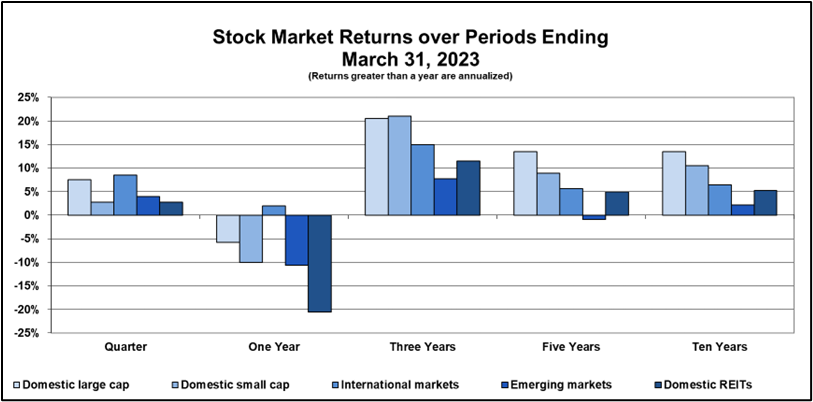
Stocks turned in a good quarter. Large cap stocks (S&P 500) led the way, up by over 10%. Other market indices are up from 2% to nearly 6%, as well.
Over the trailing twelve months stocks are up nicely. The S&P 500 is up 30%. It was a good period for other stock market indices also – 20% for small company stocks, 15% in developed international markets, and 8% in emerging markets.
While contributing to the positive stock market environment is the expectation of a near-term reduction in the Fed funds rate, the prospects for AI are driving much of the recent activity, especially in the S&P 500. The Tech companies expected to participate in AI (Alphabet, Amazon, Apple, Microsoft, Meta, Nvidia and Tesla), are the so-called “magnificent seven.” While the returns of these companies over the last twelve-months were extremely variable, ranging from a loss of 20% (Tesla) to a gain of 220% (Nvidia), suggesting a less than homogenous grouping, an equally weighted portfolio returned 72%, indicating the extent to which the S&P 500 is narrowly focused and reflects the future for AI. While it is expected that AI will be transformative, plan on volatility as the market sorts out its impact.
Bonds
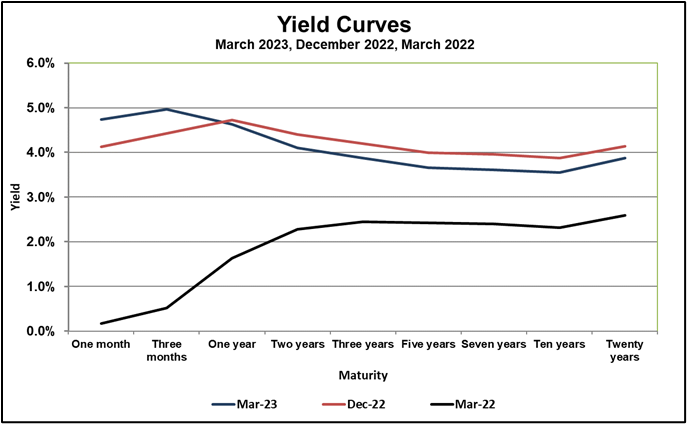
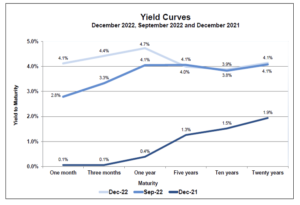
Note from the accompanying chart of bond yields over several maturities at the shorter end, yields remained about where they were at the beginning of the quarter, but increase as the time to maturity lengthens. As bond prices and returns move inversely to changes in yield, over the past quarter our short-term index (1–3 year Treasuries) was up 0.2% while the index for long-term bonds (7–10 year Treasuries) was down 1.9%. Over the trailing 12 months – up 3% at the shorter end, and down 1% for longer maturities.
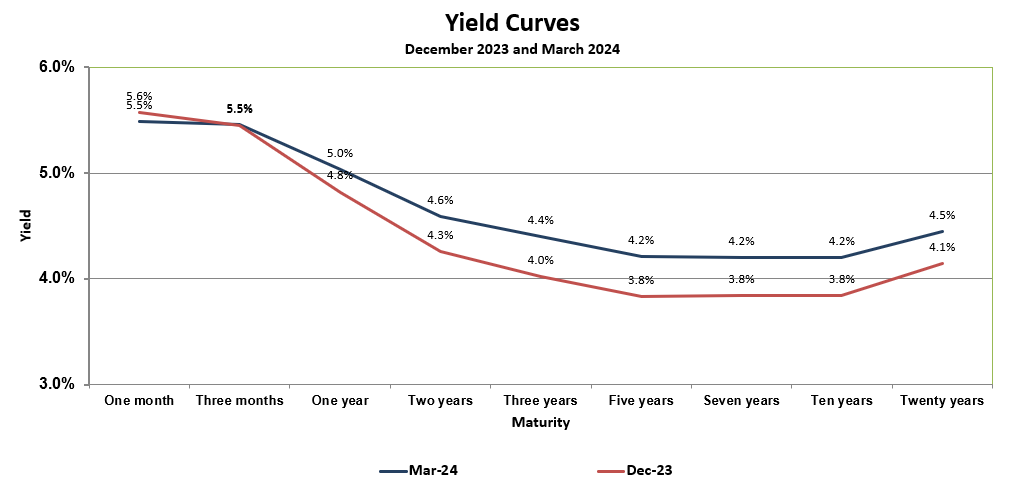
The downward pattern of bond yields is consistent with expectations for reduced interest rates ahead.
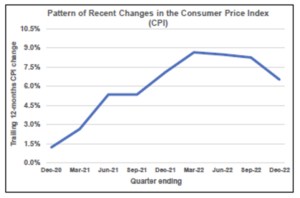
The spreads between nominal and inflation-adjusted yields suggest reasonable inflation levels going forward – about 2.5% for five years. This measure of expected inflation is close to the Fed’s target.