Many clients have employer sponsored plans with TIAA-CREF which offers various investment options including TIAA Traditional, its flagship fixed annuity product. This type of financial product guarantees a minimum rate of interest while you save, and if you annuitize your retirement plan, it provides a minimum monthly amount of income during retirement like Social Security or a pension.

More specifically, TIAA Traditional is a guaranteed insurance contract that guarantees your principal and a contractually specified minimum interest rate. In addition to the guaranteed rate, TIAA can update their interest rates for new funds at any time, which will remain in effect through the “declaration year” which begin March 1st for accumulating annuities and January 1st for payout annuities.  As a result, money you contributed during earlier time periods can earn different interest rates, which can leave you with balances in multiple “interest buckets.”

Interest rates for each “bucket”, in excess of the guaranteed minimum rate, is determined by the current interest rate environment at the time of contributions/transfers, changes in interest rates over time, TIAA’s expenses, and the financial performance of TIAA’s general account. Given today’s interest rate environment, it’s worthwhile to understand this part of your retirement portfolio if you hold TIAA Traditional assets.

In addition to the nuances around crediting rates, TIAA Traditional assets also have liquidity restrictions depending on the total amount of contributions as well as who contributed the funds to the accounts (you or your employer).  With all of this in mind, a simple TIAA Authorization Form can allow your Rockbridge advisor to access the details of your TIAA account, providing a more holistic approach for investment management and financial planning. For prospective clients with TIAA Traditional assets, contact a Rockbridge advisor today who can help you navigate the complexities of TIAA as you save for and enter retirement.

TIAA Traditional - Interest Rate Renewals

Over the last two years, interest rates have risen at a historic clip. As a result, Rockbridge has dedicated moretime helping clients manage cash reserves to take advantage of the current market environment. In previous years, “high yield” savings accounts were (and some still are) paying less than 1%. Now, it is easy to find money market funds earning in excess of 5% annually.

However, we know that this won’t remain the case forever, and given the most recent guidance by ChairmanPowell, we’ll almost certainly enter a declining interest rate environment at some point in 2024. With that being said, now is an important time to review the goals of your cash reserves. We would classify these “goals” into three major categories:

Emergency Fund / Short-Term Use

For cash earmarked for known expenses within the next year, or cash acting as an emergency reserve for those worst-case scenarios, we recommend maintaining safe, liquid investments such as a purchased money market fund or high-yield savings account. While the interest earned in these accounts will trickle down as the Fed starts to lower short-term rates, this is still the best option for short-term cash reserves. Still, it’s important to make sure the interest rate you receive on these monies is competitive relative to market rates.

Intermediate Term Use / Goal Funding

This is the bucket for which we’d allocate cash earmarked for major expenses or cash flow needs in the next 1-3 years. Given this timeframe, we’d caution investors against taking stock market levels of risk and volatility, but we also know that fully liquid options won’t be as attractive as interest rates come down. For these intermediate term cash goals, it may be a good time to purchase a Treasury bond or Certificate of Deposit (CD). This allows you to lock in an interest rate today and ensure that level of interest is earned throughout the duration of the investment. These investments can still be sold if you need the principal sooner than expected, however, you might be selling at a premium or discount from face value.

Long Term Goals

If you have cash on the sidelines that isn’t earmarked for a specific goal in the short or intermediate-term, we recommend putting a plan in place for getting this money invested in a diversified stock/bond portfolio. Shown below is a chart from J.P. Morgan’s Economic and Market Update as of 12/31/2023 that illustrates 12-month market performance following a peak period of 6-month CD rates:

While this doesn’t guarantee future market performance, this data is consistent with the correlation of positive stock market performance in declining interest rate environments.

Bottom Line

While earning 5% on cash reserves might feel like the best decision today, it’s important to consider the bigger picture. If you have questions about the status of your current cash reserves, a Rockbridge advisor would be happy to help develop a plan for you.

In today’s interest rate environment, some investors are tempted to lock in “guaranteed” returns through fixed income instruments yielding 5% or more. However, investing solely in fixed income would be a mistake for most long-term investors. Discussed below are a few reasons why that is the case:

Higher Long-Term Returns

Over the past 90 years, the stock market has delivered average returns of ~10% per year, well above even the highest fixed income rates offered today. While stocks carry higher short-term volatility, their long-term return potential is much greater. Investing consistently in equities through low-cost index funds is likely to generate significantly higher lifetime wealth compared to parking your money in fixed income assets.

Inflation Protection

In order to preserve purchasing power within your portfolio, long-term expected returns need to at least match your rate of withdrawal plus the rate of inflation. If long-term inflation expectations are 2-3% and a sustainable portfolio withdrawal rate is 4-5%- fixed income returns of ~5% won’t provide your portfolio with inflation protection. This could result in the need to reduce spending or portfolio assets being spent down more aggressively than recommended.

Growing Income

Both stocks and bonds can generate income. Stocks provide dividends that change based on company earnings, while fixed income offers steady interest payments tied to a fixed rate. Given the connection to earnings, stocks provide growing dividend income over time. S&P 500 dividends have grown at around 6% annually. Reinvested dividends can turbocharge total returns. Meanwhile, bond interest can’ be immediately reinvested into the originally purchased bond, which also adds reinvestment risk. Relying solely on fixed income can mean missing out on this compounding engine.

Diversification Benefits 

While bonds are not typically thought of as a “risky” investment, there are risks associated with being highly concentrated in the bond market. Changes in interest rates can have drastic impacts on the value of your portfolio if you’re only invested in bonds. Given that stock and bond markets are not highly correlated and often move independently, having a mix of both should benefit your risk-adjusted return.

In summary, locking yourself into fixed income today means forfeiting higher growth and income potential from stocks. Though requiring patience and discipline, the stock market remains a key engine for building long-term wealth. Don’t make short-term decisions that compromise your future financial security. Maintain reasonable stock exposure to benefit from long-term growth. Talk to a Rockbridge Advisor today.

From social media feeds to financial news outlets, we’re constantly bombarded with a stream of updates, opinions, and analysis. Access to so much information can be empowering, but can also be overwhelming. How do we know which sources to trust and where should we focus our attention? With inflation making daily headlines, stock market volatility, political unrest and global tension, it’s easy to see why an investor might want to take a step back and seek safe harbor.  Investors don’t need to look far to find a pundit claiming to have the answer, however, the lack of consensus between opinions is a reason for investors to be wary of making changes to their long-term strategy.

Given the rapid increases in interest rates as of late, bonds and CDs have garnered investors’ attention. From 2008 to 2019, the Federal Reserve kept interest rates at historic lows in response to the global financial crisis and the prolonged economic recovery. This resulted in the yield of the 10-year US Treasury Bonds falling to 1.37%. Even more recently the COVID-19 pandemic and economic downturn resulted in the 10-year yield dropping to 0.52%. Not exactly an attractive investment return. However, investors have recently taken notice in the uptick in return on secure investments, with some institutions like Ally Bank offering an 18-month CD with an APY of 5.0%. In any given year, you’d be hard pressed to find an investor that isn’t intrigued by a relatively risk-free 5% rate of return. With all the turbulence surrounding the economy, wouldn’t it make the most sense to move your portfolio to these safe and reliable investments?

First, let’s look at the historical returns for equities and bonds. According to a study conducted by Vanguard, the average annual return of the US Stock market has been 9.5% over the last 90 years. Comparatively, the average annual return of US bonds over the same period was 4.9%. While there may be uncertainty surrounding the stock market today, investors often benefit from a phenomenon called “reversion to the mean”. Over the long term, markets deliver average returns and periods of underperformance eventually revert to historical average returns. Given the headwinds facings the investment landscape today, why trust historical averages?

While it may seem like a “safe play”, to shift your portfolio away from equities, it can be more detrimental than one might realize. In attempting to time the market, investors often miss out on the most crucial days when markets rebound and they often re-enter the market too late, missing out on those large upswings. As illustrated below, this behavior typically results in returns that lag behind those who remained invested.


Investors also need to consider inflation, which can erode the purchasing power of your financial assets if you’re out of the market. According to the US Bureau of Labor Statistics, the average annual inflation rate in the US from 1991 to 2020 was 2.3%. In recent months we have seen year-over-year inflation on consumer prices as high as 9.1%. Hypothetically, if the stock market has an average (by historical measures) year, and returns 9.5% on your investment, and we see another year of exceptionally high inflation, you would have at least kept pace. An investor locked in to an 18-month CD at a rate of 5.0% would have lost purchasing power over that 18-month period, with a real rate of return of -4.1%.

The obvious question is, what if the market declines? While a 2023 market pullback is possible, as we saw above, attempting to time the market and bring emotion into your investment decisions often leads to less desirable long-term results. It’s important to remember that investment risk and return are directly correlated and the data supports investors staying committed to their investment strategy over the long-term.

So, should we turn a blind eye and ignore these relatively risk-free opportunities? Absolutely not. Depending on your investment goals and objectives these opportunities could provide moderate short-term returns that roughly keep pace with inflation. In the next six to twelve months, maybe you have a home improvement project planned, or a wedding or upcoming tuition expenses. Investors can sidestep short-term stock market volatility yet still allow your money to work for you. A high yield CD with a maturity coinciding with your expense timeframe could be a great solution for short-term goals but doesn’t replace your long-term investment strategy.

In conclusion, focus on what matters and stay the course with your investment strategy. Times like these can be a great barometer to measure your true risk tolerance and how it may align with your investment strategy. Revisit what you feel is an acceptable level of risk and align your portfolio to match your goals.  As always, talk to your advisor with any questions or concerns you may have.

If you are looking for a financial advisor, you may have heard the term “fee only financial advisor” and wondered what it means. A fee only financial advisor is an advisor who is compensated solely by the fees they charge to clients for their services. They do not receive commissions from selling financial products, which can create conflicts of interest.

But why should you consider hiring a fee only financial advisor? In this article, we’ll explore the benefits of working with a fee only advisor and why it may be the right choice for you.

Transparency
One of the main advantages of working with a fee only financial advisor is transparency. Since they are compensated only by the fees they charge, there is no incentive for them to push specific financial products on you. This means that their advice is based solely on your financial goals and needs, rather than on their own financial gain.

Objectivity
Fee only financial advisors are also able to provide objective advice because they are not tied to any particular financial product or company. This means that they can provide unbiased advice and help you make the best financial decisions for your individual situation.

Holistic Approach
Fee only financial advisors take a holistic approach to financial planning. They look at all aspects of your financial situation, including your income, expenses, assets, and liabilities, to develop a comprehensive financial plan that meets your goals and needs.

Fiduciary Duty
Fee only financial advisors are held to a fiduciary standard, which means that they are legally obligated to act in your best interests. They must disclose any potential conflicts of interest and provide advice that is in your best interests, even if it means recommending a financial product or strategy that does not provide them with a commission.

Value for Money
While fee only financial advisors do charge for their services, they often provide more value for money than advisors who work on a commission basis. This is because they provide comprehensive financial planning services, rather than just selling financial products. They can also help you save money by reducing your taxes and investment fees, and ensuring that your financial plan is aligned with your goals and risk tolerance.

In conclusion, working with a fee only financial advisor can provide many benefits, including transparency, objectivity, a holistic approach, fiduciary duty, and value for money. If you are looking for a financial advisor, consider choosing a fee only advisor to ensure that you receive the best possible advice and support for your financial needs. To find a fee only financial advisor near you, you can use online directories or consult with professional associations such as the National Association of Personal Financial Advisors (NAPFA).

In early November, the Fed raised interest rates by 75 bps, marking the sixth rate hike since March 17th, 2022, and four consecutive .75 bps increases.  This puts the Fed Funds rate (the short-term rate guiding overnight lending) up to a range of 3.75% to 4.00%, pushing borrowing costs to a new high since 2008.  The Fed hasn’t increased rates in six straight meetings since 2005 and hasn’t increased rates by 3.75% in a single year since the 1980’s.

Is the strategy working?

We are seeing early signs of the cumulative effects of tightening the monetary policy.  The annual inflation rate in the US slowed to 7.7% in October, down from 8.2% in September, yielding the fourth straight month of declining inflation.  Investors saw markets react very favorably last week as inflation numbers arrived below the 8% forecast.

Slowdowns are showing up in key leading areas, with Energy costs up 17.6% in October vs 19.8% in September.  Used cars also slowed in October as compared to the prior month (2% vs 7.2%). Food also slowed by 0.3%, down to 10.9%.  While we are seeing some leading indicators trending in the right direction, there are lagging pockets of the market that have yet to peak.  For example, shelter increased to 6.9% from 6.6% and fuel oil rose to 68.5% from 58.1%.

While consumers have benefited from recent supply chain improvements, strong inflationary pressures persist.  The Fed is sticking with their plan to tame inflation and claiming additional increases rate hikes are necessary; projecting rates to top out at 4.5 to 4.75% in 2023.

What does this mean for investors? 

While YTD bond returns are historically bad, the silver lining is that fixed income portfolios are now earning nearly 5% as a result of rising rates.  Last week’s strong performance may be the market’s signal that smaller-than-planned future rate increases may be possible.  How the Fed weighs the wide variety of economic indicators will ultimately determine how soft our landing will be.

In the meantime, we suggest staying invested in a diversified portfolio and take advantage of any financial and/or tax planning opportunities that current market conditions may provide.

Does it seem like there’s been an extra level of uncertainty lately, threatening your investment plans? Of course, there are always big events going on; that’s the world for you. But today’s brew of geopolitical threats, inflation trends, rising interest rates, recessionary fears, and lingering COVID concerns may feel especially daunting. The market’s volatile reactions to it all may have left you wondering whether, this time, seemingly heightened risks call for a higher-alert approach to your investment selections.

If you’re seeking clarity, the daily spew of financial commentary won’t help. To cut past the clutter, let’s revisit our investment selection process. Reviewing the steps involved speaks to the importance of looking past today’s unsettling news in pursuit of your greater goals.


Step One: Eliminate the Ineligible

Chocolate or vanilla? Back in the 1970s, when Vanguard’s John “Jack” Bogle introduced the first retail index fund, there were similarly limited choices available to satisfy an investor’s tastes. For better and worse, the volume and variety of investment flavors has certainly changed over the years, with a glut of product providers adding to an ever-growing menu of selections.

Fortunately, out of the universe of investment products, we can promptly eliminate most of them. No, it’s not about how they’ve been performing lately. Instead, we weed out the speculative, or traditional active product providers who are playing an entirely different game from the one we have in mind.

Speculative, or active investors try to predict what’s going to happen next in markets or to individual securities, and place clever trades ahead of the curve. Be they individual traders or well-heeled analysts, the competition is so fierce and price-setting is so instantaneous, their efforts aren’t expected to add persistent value, especially after costs. They may work hard to decipher financial conditions and economic indicators. They may even be correct. But that “curve” they’re trying to trade ahead of is always blind to the next price-altering news. Over the long run, this makes it nearly impossible to consistently surpass the prices and long-term expected returns already available in highly efficient markets.


Step Two: Identify the Best of the Best

After we eliminate the speculative product providers, we’re left with a much smaller, but still sizeable pool of credible selections. This is a nice “problem” to have. But it means we must narrow the field further by identifying the best of the best. We also must periodically revisit our selections, as new or existing providers offer potential enhancements over time.

As your advisor, we believe we add considerable value through out upfront and ongoing due diligence. We aim for providers who offer a prudent balance between incorporating important innovations, without creating chaos. This involves identifying the most robust factors, or expected sources of return, and understanding how they interact with one another across various market conditions.

To build toward desirable investment outcomes, we favor fund managers who are:

Evidence-based: They harness the same, growing body of evidence we use to create a more reliable investment experience across the market’s “random walk.”

Persistent: They are deliberate, patient, and thrifty, with an eye toward offering more than just a menu of popular products and short-term “pops.”

Visionary: They’ve been around for a while, with a strong track record for capturing known and newly identified dimensions of expected returns.

Collaborative: They specialize in providing sensible, low-cost building blocks for creating and managing solid investment portfolios to facilitate investors’ greater financial goals.


Step Three: Inspect the Product Packaging

Beyond the investments themselves, there are the “containers” in which investment opportunities are delivered. These days, there’s nearly no end to the shiny packaging in which product providers can wrap their offerings. There are traditional mutual funds and ETFs. There are hedge funds, target-date funds, annuities, separately managed and/or direct indexing accounts, private partnerships, robo-advisors, and more. Do-it-yourself investors can also go directly to cryptocurrency exchanges and trading platforms like Robinhood to manage their own money.

Regardless of the wrapper, the initial hurdle remains unchanged: Is the product provider managing your money in an appropriate, evidence-based manner, as described above? After ruling out any speculative action, we also want to review each product’s prospectus or similarly detailed disclosures to avoid packaging that is overly complicated, suspiciously opaque, and/or needlessly expensive. (If there are no details to inspect, that’s a big, red flag in itself.)


Step Four: Incorporate Your “You” Into Your Investments

Who are you, and what is your money about? As our next step, we need to get to know you very well, so we can identify where you are planning to go. Even world-class investments won’t do, if they don’t align with your personal tastes and unique financial circumstances. For example:

Personal Circumstances: There are any number of details that might influence the specific selections we’d recommend for your evidence-based portfolio. How long do you have to invest toward your various goals? What are your cash flow wants and needs? Are you a business owner? What are your legacy plans? These and other fundamentals can influence not only how we structure your investment accounts, but which specific holdings to tilt toward or away from.

Risk Tolerances: Are you comfortable taking big risks in pursuit of greater rewards? Maybe you even thrive on the bleeding edge of the latest investment innovations—such as potential new investment factors, alternative markets beyond stocks and bonds, cryptocurrency, and other blockchain-related investment vehicles. Conversely, you may prefer only the most tried-and-true solutions, with decades of dependable performance data on record. Your portfolio can be tailored in either direction, while maintaining an evidence-based approach either way.

Taxable Tradeoffs for Existing Wealth: Most investors arrive with existing investments—good, bad, and ugly. In pursuit of perfection, we must carefully account for the costs of transitioning toward a more cohesive portfolio. This includes accounting for the “space” in your existing, tax-sheltered accounts, as well as the tax ramifications of selling less desirable taxable positions. Upfront and ongoing, we perform cost/benefit analyses to identify when our preferred investment selections should be in your best interest, and when tradeoffs may have to do.

Ideal Application for Your Income Streams: Different selections also may make more or less sense for assets you’re adding to your investment portfolio. For example, even if your company retirement plan doesn’t offer ideal selections, it may still be among your best, most tax-wise investment vehicles—especially if your employer is matching your contributions. After all, free money is hard to beat. For the income you’re directing to your retirement plan, we’ll make appropriate recommendations based on what’s available in the plan.

Sustainable Investing: Do you want to incorporate an “ESG” (Environmental, Social, Governance) or similar values-based element in your investing? The right solutions for you depend on where your priorities fall.


Step Five: Manage the Modifications

You may have noticed, the world never stops spinning. The same can be said for evidence-based investing. Even an evidence-based portfolio is expected to evolve over time.

For example, Harry Markowitz and William Sharpe introduced Modern Portfolio Theory in the 1950s, and Capital Asset Pricing Model in the 1970s, respectively. Their insights set the stage for moving from individual stock speculation to diversified portfolio construction. In the 1990s, the Fama/French three-factor pricing model helped us understand the importance of capturing global returns from multiple sources. Since then, we’ve explored ways to incorporate other, potentially persistent factors—such as profitability, investment, and momentum. Most recently, we’ve also started applying factor investing in additional markets, such as alternative lending and reinsurance, which may offer discrete sources of expected returns.

In short, new studies can change or add to our existing assumptions, with portfolio construction models evolving accordingly. Benchmarks and indexes improve over time as well, sharpening our ability to track and compare relative performance. Enhanced technologies can eliminate inefficiencies, making it possible to pursue expected sources of return that simply weren’t accessible to us in the past.

Reputable product providers heed such updates—or sometimes develop them themselves—and build them into new or existing solutions. We, in turn, must weigh the advantages and disadvantages of incorporating them into your portfolio.

Even if a new and improved fund hits the market, what are the tax ramifications of your investing in it? Even if it is a solid solution, does it fit into your greater financial goals? How can investment management (such as adding new assets or rebalancing your portfolio back to plan) help us incorporate the latest, greatest opportunities, without incurring excessive costs? These are a few of the many questions that factor into your optimal investment selections.

Fund Selection Built to Last

So, how do we choose the funds we use? The answer depends on how to best extract the most dependable returns out of highly efficient markets. It depends on heeding practical improvements as they arise. It depends on determining how these forces are expected to impact you, and your one and only investment experience.

One thing fund selection should not depend on is reacting to the daily news. The world’s financial, economic, and geopolitical events do influence your returns. But just as the weather is one thing and climate is another, our focus remains on harvesting seasons of bounties, while standing firm against the inclement days that come and go. We favor investment product providers who do the same, and build their evidence-based solutions accordingly.

How else can we help you invest toward the personal financial goals that will add the most meaning to your life? Let us know!

Stock Markets

Not surprisingly, stock markets were volatile this quarter. Faced with a myriad of issues ranging from renewed inflation, historically high equity valuations, winding down the Fed’s “Quantitative Easing”, capped by Russia’s invasion of Ukraine. The largest tech companies held up reasonably well, with Facebook as the only notable exception. Returns from stocks traded in international and emerging markets are in negative territory. However, value stocks in both international and domestic markets traded at a premium over the quarter. The ups and downs of stock prices reflect the market’s continued incorporation of the ongoing news associated with our uncertain environment.

Inflation is a concern. Over the past twelve months the Consumer Price Index (CPI) is up 8% – levels not seen since the early 1980’s. It’s not clear whether this spike reflects government stimulus spending, or shortages due to global supply chain disruptions; likely a combination of both. The Fed is beginning to increase interest rates in response. Its success at balancing the need to bring down inflation without triggering a recession is uncertain. While the concern of continued inflation seems to be heightened, market signals continue to indicate that inflation will be relatively short lived.

Stock returns in various markets over the past twelve months differ significantly from one another. Some differences in returns are offsetting performance from earlier periods, as the variability across market segments is less pronounced over the three-year period (shown above). Returns from domestic large-cap stocks remain well above long-term averages.

Over longer periods, we continue to see stocks in domestic markets doing better than those in non-domestic markets indicating generally more positive responses to uncertainty. Ten years is not a long period in financial markets. While these relative returns are useful to understanding recent performance in diversified portfolios, these results shouldn’t be used to predict the future.

Bond Markets

A Yield Curve exhibits the pattern of observed returns from holding bonds to term across several maturities. It provides a sense of where interest rates are heading. Shifts help explain short-term bond returns as bond prices/returns move inversely to yield changes. The longer the period to maturity, the greater the effect. Today’s upward sloping Yield Curve implies increasing yields going forward. The upward shift explains this quarter’s negative bond returns.

Yields are driven by interest rates, risk premiums and expected inflation. These factors change over time resulting in moving yields and volatile bond market returns. If we isolate interest rate and risk by looking at Treasury yields of like maturities, then we have a view of expected inflation. Five-year yields have increased to levels above the ten-year numbers, reflecting increased short-term inflation expectations. Five-year yields imply 3.8% inflation over that period while ten-year yields imply 2.8% inflation. While these numbers are up since December, they are well below the 8% experienced over the past twelve months.

Uncertainties associated with the Fed’s activities include (1) how fast and by how much it will increase interest rates to contain inflation and (2) how it will deal with the massive amount of government securities on its balance sheet. The Fed increased interest rates by ¼% at its last meeting, expecting several more rate hikes going forward with a goal to bring down inflation without triggering a recession. The Fed has $9.0 trillion of government securities on its balance sheet, well above anything seen in the past. How aggressively the Fed brings this amount back to historical levels will likely impact bond markets.

Over the last 90 years, the stock market has been great to investors. No one knows what the market will do tomorrow, but the longer your horizon, the more the odds are in your favor – and you don’t have to wait very long for the numbers to look pretty good. With bank interest close to 0%, it’s worth exploring the odds the stock market does better than flat over varying periods of time.

Daily: Since 1928, we’ve had 23,588 trading days. The odds the market is up on any one day is 53% and the average return has been 0.03%. On a daily basis, the market is basically a coin flip.

Monthly: The odds get better on a monthly basis. 63% of the time the stock market has a positive return, and it averages nearly 1%.

Quarterly: Looking at data quarter by quarter, the percent of positive returns increases to 68%, or a little better than 2/3. The average return for all quarters is 2.5%.

Yearly: On a calendar year basis, we’ve seen positive returns 74% of the time for an annualized average of 10%.

Two-Year Periods: By increasing the time horizon to two years, the odds of a positive return get to 83%. If you can’t identify a definite need for your cash in the next 24 months and you aren’t super risk-averse, it’s worth taking some stock market risk.

Five-Year Periods: When we get up to rolling five-year periods, we see positive returns 87% of the time.

Ten-Year Periods: Over the 87 observed 10-year periods since 1926, the stock market has been positive in all but four of them, or 95%. The only instances of negative returns were in the Great Depression and the period that included both the dot-com bubble and the 2008 financial crisis.

It’s remarkable how many individuals and institutions we speak with that have excess money in bank accounts earning nothing. If you can’t identify a somewhat exact need for cash in the next 12 months, you should probably have something in the stock market. It may only be a small percentage but it’s worth it. The stock market can seem scary, especially when it’s trading at all-time highs, but with the right advisor, diversification, and a disciplined approach, it’s a risk worth taking.

Each year the financial services company, Morningstar, issues a report of how actively managed funds performed relative to passive funds. Historically, actively managed funds have not performed as well as funds designed to simply replicate a market or published index. However, one argument active fund managers make is that they are “nimbler” during times of extreme volatility which leads to better performance. 2020 was a year of extreme volatility, so let’s see how they did.

Compared to historical data, it was a good year for active management with active funds roughly matching passive funds across the board. Unfortunately for active management, a tie doesn’t help when you have two decades of severe underperformance to overcome. Looking back five years, active funds beat passive funds 37% of the time.  In 10 years, it’s just 30%, and with 20 years of results, it’s a meager 13%.

The story here is one we know well, costs matter. With the track record reported by Morningstar, paying a large management fee for someone to pick stocks in an effort to beat the market has not behooved investors in the past and there is little reason to think that will change.

In addition to an expected return that is below market results, active management also introduces a new element of risk. Active funds often deliver returns that are different from a benchmark. These differences are random and cannot be modeled, making it more difficult to estimate future account balances and therefore, retirement spending.

Lastly, there is no way to predict which funds will perform best in the next period. Like daily movement of the stock market, relative manager performance is random.

Until we see a consistent trend reversal, we’ll continue to recommend passive funds for our clients’ portfolios.  Knowing whether or not your investments are actively managed isn’t always obvious.  Contact Rockbridge if you’d like us to review your portfolio.

Somewhere between colossal and titanic. Apple, the largest publicly traded company in the world, has a market capitalization of $2.4 trillion. If it were its own country it would be slightly less valuable than all the publicly-traded stocks in Germany and slightly more valuable than those in South Korea. Microsoft is worth $2.2 trillion, a little less than South Korea, but worth more than Australia. Google and Amazon are worth $1.8 trillion and $1.7 trillion respectively, less than Australia but more than Brazil. Facebook’s value of $1.0 trillion is greater than all the stocks in Russia and Spain. Tesla and NVIDIA are worth $700 billion and $500 billion respectively, not good enough to make the trillion-dollar club, but good enough to be worth more than the stocks of Mexico or Indonesia. The stock markets of those two countries are worth about the same as JP Morgan Chase.

Each of these countries has hundreds or thousands of publicly traded companies and some of the most recognized brands in the world. The eight of them represent over $13 trillion in GDP and just shy of 1 billion in population. The eight American companies on the other hand are slightly more valuable on a market capitalization basis, have $1.5 trillion in revenue, and employ 2.2 million people. Simply put, the largest U.S. companies are very valuable.

American brands are strong, but there’s a world of growth potential if we look overseas. That’s one of the many reasons we continue to hold international stocks.

The following table summarizes the figures mentioned above.

Around the globe, COVID-19 killed millions of people, caused nearly 100 million to lose their job, and decreased economic output by several trillion dollars. When times get this bad, we investors are prepared to see losses in our portfolios.

But in 2020 we saw the opposite. The S&P 500 was up 18%, almost double its 90- year average, and this year it’s up another 13%. What gives? There are several factors, but the biggest is probably the Federal Reserve (The government’s $6.8 trillion of stimulus is a close second).

What’s been done: Of the many actions taken by the Federal Reserve, the two most impactful have been the lowering of the Federal Funds Rate and the expansion of its balance sheet (quantitative easing or QE).

At the onset of the Coronavirus, the Federal Reserve lowered the Federal Funds Rate from 1.5% to 0%. Nearly all short-term and intermediate-term interest rates are affected by the Federal Funds Rate. Lowering this rate reduced the cost of borrowing on mortgage and home equity loans, auto loans, and other borrowing which spurs economic activity.

The Federal Reserve has always had a balance sheet, but it hasn’t been until recently that it was used to prop up asset prices in times of economic turmoil. The Fed’s balance sheet was about $900 billion prior to the 2008 Financial Crisis. It quickly increased to $2.2 trillion at the end of 2008 and then gradually expanded to $4.5 trillion in 2014. The pandemic roughly doubled the Fed’s balance sheet from $4 trillion to $8 trillion, where it stands today. The explicit purpose of the Fed’s bond purchases is to keep long-term interest rates low to spur long-term lending. A consequence is that it raises all asset prices from bonds to stocks to homes. The cheaper things can be financed, or the lower the discount rate of future cash flows, the higher the price is today.

Where things stand now: The Federal Funds Rate is close to 0% and isn’t expected to increase until 2023. The Federal Reserve is continuing with its quantitative easing program, buying $80 billion of treasury bonds and $40 billion of mortgage-backed bonds each month. Annualized, these $120 billions of monthly purchases work out to nearly $1.5 trillion per year. The Federal Open Market Committee has yet to make an official statement on the future of this program, but Chairman Powell has said a change in asset purchases will come before a change in the Fed Funds Rate, leading some to speculate it could happen by the end of 2021.

Many believe the Fed must trim back their accommodative policy or we’ll see significant inflation in the coming years.

What the future may hold: If recent history is repeated, the Federal Reserve’s unwinding of their accommodative policy will not be good for markets in the short term.

In 2013, the Federal Reserve was buying $85 billion a month in Treasury bonds and mortgage-backed securities. On June 19th, 2013, Ben Bernanke announced the Fed would stop (or “taper”) their asset purchases by the following summer. Both the stock and bond market had a “taper-tantrum,” with global stocks dropping 6% in the ensuing week and the aggregate bond market dropping 2%.

In 2018, the Federal Reserve began selling off its assets, reducing its balance sheet from $4.4 billion to $4 billion and increasing the Federal Funds Rate from 1.25% to 2.25%. This substantial reversal of accommodative policy corresponded with poor performance from the stock and bond market. Global equities declined 10% in 2018 and the aggregate bond market finished the year flat after briefly being down 3% at times during the year.

What investors should do: Understand that the incredible stock and bond returns over the last decade are unlikely to continue.

What investors should not do: Sell in and out of the market in anticipation of the Federal Reserve’s policy changes. Final thoughts: Federal Reserve tightening seems to have been harmful to markets in the past, but before being too clever for your own good remember:

1. No one knows for sure when the changes will happen.
2. Just because markets went down in the past doesn’t mean they will in the future. With all the factors affecting stocks and bonds, no one thing ever acts in isolation.
3. Expected returns from stocks and bonds are still positive, cash remains a poor investment.
4. Rising interest rates are harmful to short-term asset prices but mean greater expected returns in the future.

Over the short term, there will always be reasons to fret capital markets. However, if people keep working, business gets done, and wealth keeps being created, investors will reap rewards over the next 100 years just like they have over the last 100.

In our last piece, we covered the recent uptick in inflation, and what to make of it in historical context. For investors, it’s important to take a step back and look at the big picture before acting on breaking news. But what if inflation does get out of hand, and stays that way for a while?

The Federal Reserve has been suggesting rising rates should wane. We hope they’re right. But we also know the future remains uncharted. Nearly any outcome is possible, and none is inevitable. This means diversified investing remains our preferred strategy for being prepared for whatever the future holds.

Explaining Inflation Doesn’t Predict It

If higher inflation does materialize, will it arrive sooner or later? Will it be moderate or severe? Brief or prolonged? Forecasts vary widely, because we often forget the academic evidence that informs us: Even excellent explanatory models rarely serve as effective predictive models.

For example, scientists can readily explain why earthquakes occur, but our ability to forecast times, locations and severities remains shaky at best. The same can be said for inflation. We can explain its intricacies, but accurate predictions remain as elusive as ever. There are simply too many variables: COVID-19, climate change, political action, the Federal Reserve, other central banks, consumer banks/lenders, consumers/borrowers, employers/producers, employees, investors (“the market”), sectors (such as real estate, commodities, and gold), the U.S. dollar, global currency, cryptocurrency, financial economists, the media, the world, time … and YOU.

Each of these could throw off any predictions about the time, degree, and extent of future inflation. Besides, as an investor, you really only have control over the last two: You, and your time in the market. What will you do with your time?

Because We Don’t Know, We Diversify

It stands to reason: Some investments seem to shine when inflation is on the rise. Others deliver their best results at other times. Because we never know exactly when inflation might rise or fall, we believe an investor’s best course is to diversify into and across various investments that tend to respond differently under different economic conditions.

For example, until earlier this year, value stocks had been underperforming growth stocks for quite a while. You may have been tempted to give up on them during their decade-plus lull (during which inflation remained relatively low). And yet, when inflation is high or rising, value stocks have tended to outperform growth, as has been the case year-to-date.

Another example is Treasury Inflation-Protected Securities (TIPS) versus “regular” Treasury bonds. Neither is ideal across all conditions. But if you hold some of both, they can complement each other over time and across various inflationary rates.

In short, if you’ve not yet done so, it’s time to define your financial goals, and build your personalized, globally diversified portfolio to complement them. If you’ve already completed these steps, you should be positioned as best you can to manage higher inflation over time, which means your best next step is most likely to stay put. This brings us to our next point …

Stocks vs. Inflation: It’s a Knock-Out

Provided time is on your side, the stock market is your greatest ally against inflation.

Over time, global stock market returns have dramatically outpaced inflation. For example, as reported by Dimensional Fund Advisors, $1 invested in the S&P 500 Index from 1926–2017 would have grown to $533 worth of purchasing power by the end of 2017, after adjusting for inflation. Had that same dollar been held in “safe” one-month Treasury bills over the same period, it would have grown to an inflation-adjusted $1.51.

That T-bill growth is not nothing, and welcome relief during bear markets. That’s one reason we advocate for maintaining an appropriate mix between wealth-accumulating and wealth-preserving investments. But what’s “appropriate”? It depends on your personal financial goals. The point is, as long as you have enough time to let your stock allocations ride through the downturns, you can expect them to remain well ahead of inflation simply by being in the market.

It’s important to add, no fancy market-timing moves are required or desired when participating in the stock market. In fact, moving holdings in and out at seemingly opportune times is more likely to detract from the vital, inflation-busting role stocks play in your portfolio. In the words of Nobel Laureate Eugene Fama: “The nature of the stock market is you get a lot of the return in very short periods of time. So, you basically don’t want to be out for short periods of time, where you may actually be missing a good part of the return.”

What If You’re Retired?

So far, so good. But not all your wealth is for spending in the far-off future. What if you’re depending on your portfolio to provide a reliable income stream here and now? If you’re retired, (or you have other upcoming spending needs such as college costs), eventual expected returns offer little comfort when current inflation is eating into today’s spending needs.

Again, you can’t control inflation, but you can manage your own best interests in the face of it.

Engage in Retirement Planning: Along with a globally diversified investment portfolio, you’ll want a solid strategy for investing for, and spending in retirement. For example:

  • Asset Location: Among your taxable and tax-favored accounts, where will you locate your stocks, bonds, and other assets for tax-efficiently accumulating and spending your wealth?
  • Spending: How much can you safely withdraw from your investment portfolio to supplement your other income sources (such as Social Security)?
  • Withdrawal Strategies: Which accounts will you tap first, and then next?

Revisit Your Retirement Planning: Especially when inflation is on the rise, it’s worth revisiting your existing investment and withdrawal strategies. What are the odds your current portfolio won’t deliver as hoped for? We typically use odds-based “Monte Carlo” simulations to ask this critical question, and guide any sensible adjustments the answers may warrant.

Don’t Panic: What if inflation is taking too big a bite? A common misstep is to abandon your carefully structured investments in pursuit of short-cuts. For example, it may be tempting to unload high-quality bonds and pile into gold, dividend stocks, or other ways to seek spendable income. Unfortunately, we believe such substitutes detract from effective retirement planning. The goal is to optimize expected returns and manage unnecessary risks in pursuit of a dependable outcome. As such, we suggest avoiding dubious detours along the way.

Have a “Plan B”: What can you do instead? In “Your Complete Guide to a Successful and Secure Retirement,” authors Larry Swedroe and Kevin Grogan describe how to prepare an upfront “Plan B.” If a worst-case scenario is realized, you’re then better positioned to make any difficult decisions required to recover your footing. The authors explain:

“Plan B should list the actions to be taken if financial assets drop below a predetermined level. Those actions might include remaining in, or returning to, the workforce, reducing current spending, reducing the financial goal, and selling a home and/or moving to a location with a lower cost of living.”

These sorts of belt-tightening choices are never fun. But you should prefer them over chasing unsubstantiated sources of return that could dig your risk hole even deeper.

How Can We Help?

While anyone can embrace the strategies we just described, implementing them can be easier said than done. Plus, there are more steps you can take to defend against inflation, near and far. Examples include engaging in additional tax-planning, annuitizing a portion of your wealth, tapping lines of credit like a second mortgage, optimizing Social Security benefits, and more.

We hope you’ll contact us today to discuss these and other retirement planning actions worth exploring. After all, making the most of your possibilities is always a smart move, whether or not inflation is here to stay.

In Syracuse, we see lake effect snow every January. But there’s another sizable “effect” in January if you know where to look. This one’s in the stock market.

The “January Effect” is the outperformance of small-cap stocks versus large-cap stocks in the first month of the year. Going back to 1926, small companies have rallied an average of 4.4% in January. Large companies meanwhile have averaged 1.1%. That 3.3% difference represents almost all of small-cap’s outperformance on an annual basis.

In 2021, small-caps gained 6.5% while large-caps lost 0.7%. That 7.2% difference is the largest small-cap outperformance in the last 20 years and a big part of why our holdings are outperforming a market-neutral portfolio this year.

Having an overweighting to small-cap stocks has historically improved a portfolio’s risk-adjusted return and for that reason we will maintain it. Whether that benefit continues to come in January or decides to come around Mother’s Day makes no difference to me… but I can’t say the same about snow.

Last week we saw some of the largest tech companies in the world report their earnings from the first quarter of 2021 and the numbers were impressive. Headlines on CNBC read:

“Apple reports blowout quarter, booking more than $100 billion in revenue for the first time”

“Tesla posts record net income of $438 million, revenue surges by 74%”

“Microsoft books biggest revenue growth since 2018”

“Amazon’s sales surge 44% as it smashes earnings expectations”

The following table breaks down the growth these companies (and Netflix) saw from a revenue perspective and an income perspective.

It’s hard to overstate how incredible these numbers are. Over the last 20 years, the average revenue and earnings growth rate of the S&P 500 has been in 3.2% and 3.7% respectively.

Surely these titanic earnings numbers corresponded to a dramatic increase in share price. Wrong! All five of these company’s saw their share price drop on the ensuing day of trading and only Amazon outperformed the S&P 500. The following table is expanded to include ensuing day performance.

How can this be? The answer is that the market expected better, especially over the long-term. Netflix reported fewer new subscribers than investors were anticipating, and shares of Microsoft dropped as their expectations for future revenue implied a slowdown in the rate of growth. It was more of the same for the others.

One challenge is when you get so large, it’s hard to keep growing. Apple’s stock is worth $2.25 trillion, a size that is hard to fathom. Another challenge is current valuation relative to profitability.

Despite Tesla’s Net Income growing over 2,600%, they still make very little money relative to their valuation. Over the previous 12 months, Tesla made $1.14 billion. With a market valuation of $670 billion, it will take nearly 600 years at their current rate of profitability to earn enough money to match their valuation.

Let’s compare that to JP Morgan. In the first quarter, JPM reported a net income of $14.3 billion. For the previous 12 months, they earned $40.6 billion. Despite making 35 times as much money as Tesla last year, JPM’s market capitalization is $200 billion less. If JPM continues to make money at the same rate as last year, they will earn their market cap in only 11.5 years.

The point of comparing Tesla and JP Morgan is not to say JPM is a better stock to own than TSLA. The point is that the performance of each company will be determined by how much better or worse each company fares relative to what the market anticipates from each.

The next time you think about Tesla’s income statement remember, Great Expectations have been in every line you have ever read.

Year to date returns for Value stocks have exceeded that from Growth stocks across all market caps, both domestically and abroad.

There are several reasons for this. US Vaccination rates have been greater than expected, which has helped traditional companies (value) at the expense of technology companies (growth). Company specific earnings have likely made a difference, especially in financials which tend to be “value stocks”. However, the largest cause for the difference has probably been the rise in inflation expectations and interest rates.

At the start of the year, the U.S. 30-year Treasury Bond was yielding 1.65% and the market-implied 30-year inflation number was 2.02%. As of April 23rd, the 30-year Treasury Bond is yielding 2.25% and the market implied inflation is 2.25%. Rising inflation and interest rates help value stocks because the profit from value stocks comes sooner whereas growth stocks are more profitable further into the future. As inflation picks up, profits in the future are discounted more making them worth relatively less today.

In an effort to put numbers on it, let’s discount future profits of Large-Cap U.S. Stocks. The following is based off current forward p/e ratios, a 2% long-term earnings growth rate, and a discount rate of 7.3%.

Assuming the discount rate has risen with the 30-year bond, the following table shows the present value with a 7.9% discount rate.

Here, the rise in rates has decreased the price of value stocks by 8%.

The following table shows the same exercise applied to growth stocks. Again, we use a 7.3% and 7.9% discount rate and an implied earnings growth rate of 5.2%. Notice the higher growth rate as these are growth stocks and a higher rate is needed to justify the current price/earnings ratio.

If we do the same exercise with growth stocks, we see a price decrease of 10.8%. This 2.8% difference explains more than half of the Value stock outperformance in 2021.

With small cap stocks it’s even more pronounced as the implied earnings growth rate of small-cap growth stocks is even higher. Right now, small-cap growth stocks are trading with a forward p/e ratio of 84.7. In order to justify this price, there have to be substantial profits in the distant future which is more susceptible to the increase in interest rates. When we did the same exercise with small-cap stocks, value had a 6.6% relative outperformance.

Again, stocks are up on the year, but not because of interest rates. Rather the increase in interest rates has been more than offset by better-than-expected earnings and higher perceived certainty of future earnings.

A common question we receive from clients: “How can I save more money in a tax advantaged way?”  Fortunately, if you are an employee of Lockheed Martin you have a unique opportunity.

As us nerds call it, the “Mega Backdoor Roth IRA” is a strategy available in 401(k) plans that allow for after-tax 401(k) contributions (i.e. Lockheed Martin).  This strategy is appropriate for employees who are already maximizing contributions to the Pre-Tax or Roth buckets and are looking to save additional tax advantaged funds.  The maximum employee contribution to pre-tax or Roth is $19,500 plus a $6,500 “catch-up” contribution if you are over 50 ($26,000 total).  However, most employees are unaware that the total contribution limit to a 401(k) plan is $64,500.  This is where the after-tax piece comes into play.  If you are already contributing $26,000/year (assuming you are 50 years old or older) and your employer match/profit sharing is $15,000/year, you can still contribute $23,500 to the after-tax portion of your 401(k) plan!  Upon retirement, all after-tax contributions are eligible to be rolled into a Roth IRA!

Case Study:

John is a Program Manager at Lockheed Martin in Syracuse and earns $170,000/year.  He maximizes contributions to his 401(k) plan ($26,000) and receives the 4% match ($6,800) and the 6% profit sharing( $10,200).  Since these contributions total $43,000, John can still contribute $21,500 after-tax in is 401(k) plan.

This is a great strategy for Lockheed Martin employees and allows them to essentially fund a significant amount of money into a Roth IRA indirectly.  Give us a call or schedule a phone call if this is something you’d like to learn more about!

Most of our clients hold bonds and most of those bonds have “lost value” in the first three months of the year. That does not mean any of the bonds have defaulted. In fact, almost no bonds have defaulted in 2021. Rather, interest rates have risen causing the value of existing bonds to drop.

It may seem counterintuitive that yields going up means bonds are worth less. At first glance, one might think if bonds are now paying higher interest rates, they should be worth more. While that is relatively true if you are buying new bonds, the bonds investors hold are bonds that have been issued in the past.

For example, say on 1/4/2021 Nick bought a 1% U.S. Treasury Bond for $100. If Nick wanted to sell it the next day, Nick would have gotten about $100. Fast-forward 3 months and $100 can buy a bond of the same length but with a yield of 1.75%. If Nick wants to sell his bond today, a buyer won’t be willing to pay $100 for a 1% bond because that buyer can now get a 1.75% bond for $100. To entice someone to buy it, Nick will have to lower the price.

The following (simplified) table shows how a 10-year bond’s price would be calculated assuming that the bond pays a 1% coupon, and the current interest rate is 1.75%.

In this scenario, Nick will have to lower his price 6.83% in order to find a buyer. His bond has accrued 0.25% of interest, but he still will have lost 6.58% on the investment.

It’s good to remember that changes in interest rates can work in an investor’s favor. At the start of 2019, the aggregate bond market was yielding about 3%, and yet returned 8.8% for the year. At the start of 2020 it was yielding a little more than 2% but returned 7.7% that year. One way to think of it is that we got most of the upcoming decade’s return paid to us in the last two years.

Let’s see how interest rates have impacted returns so far this year. The rise in interest rates is what caused bonds to drop in value. The most common bond holding is an aggregate bond fund. Vanguard’s Total Bond Market (VBTLX/BND) has an average bond duration of 6.6 years. 7-year treasuries have seen a 0.74% increase in yield this year. Multiply the interest rate move (0.74%) by the duration (6.6) and you get a price movement of -4.9%. That plus the interest earned, some movement in credit spreads, and stronger mortgage-backed performance, and you get a year-to-date return of -3.8%.

While this is painful in the short-term, it means future returns are higher, which will benefit investors over the long run. Regardless of short-term performance, bonds make sense for many people for the following three reasons.

  1. They pay interest: Even if it’s less than historical rates, it’s better than nothing, which is what we are getting in checking/savings accounts.
  2. They are less volatile than Stocks: So far 2021 has been a bad year for bonds, and they are down 4%. A year ago, stocks were having a bad year and they were down 30%. The magnitude of bond movement is much less than stocks.
  3. They provide a diversification benefit: When the stock market is falling during times of economic turmoil, interest rates are normally falling as well. That means bonds are appreciating in value which gives us extra money to rebalance back into stocks, buying them at hopefully cheap prices.

Lastly, while interest rates are expected to rise, it doesn’t mean they will. At the start of 2019, the U.S. 10-year bond was at 2.66% and expected to rise. A year later it was at 1.88% and again forecast to rise. At the start of this year, it was yielding 0.93%. No one knows what interest rates will do in the future, so we will maintain our discipline and continue holding bonds.

“The American marketplace is an economic jungle. As in all jungles, you easily can be destroyed if you don’t know the rules of survival. … But you also can come through in fine shape and you can even flourish in the jungle—if you learn the rules, adapt them for your own use, and heed them.” — Sylvia Porter

Is it just our imagination, or has there been an uptick lately in exciting new trading tactics for seizing riches from exotic new markets?

Unfortunately, as Sylvia Porter observed above in her 1,200-page, best-selling “Sylvia Porter’s Money Book,” excitement isn’t necessarily an investor’s best friend. Respecting the jungle rules is the wiser way to endure.

What’s Old Is New Again

Who is Sylvia Porter? A 20th century financial author and journalist, Porter challenged financial and social norms alike during her extensive career, which launched in the 1930s and peaked in the 1970s. Making her way in a male-dominated business, she initially wrote under the name S.F. Porter, to conceal her gender. By 1975 (when her Money Book was first published), she was syndicated across 350 newspapers as well as the Ladies’ Home Journal. [Source]

Porter is credited as having created the role of personal financial journalist, writing for and by the people. And yet, few remember her name. This in itself is telling of how readily financial times, tides, and fortunes can ebb and flow.

But let’s return to the here and now, and the current incubator of hot new trends. After a year of sitting at home, an excitable generation of do-it-yourself traders has been replacing traditional leisure-time activities with online pursuits—including aggressive, Tweet-worthy trading for fun and profit.

The result? Waves of volatile financial feeding frenzies and overnight sensations, egged on by a brood of freshly hatched social media stars, and a spate of flashy new trading platforms with captivating names like Robinhood.

When SPAC-Man Speaks

The movement roughly launched in January 2021, when a Reddit-driven rally abruptly sent the prices of several unloved stocks like GameStop through the roof. More recently, special purpose acquisition companies (SPACs) have captured a lot of attention. “When SPAC-Man Chamath Palihapitiya Speaks, Reddit and Wall Street Listen,” observed a recent Wall Street Journal column. “Amateur traders hang on [Palihapitiya’s] every word for clues about his next target—and for the insults he hurls at the high-finance elite.”

Non-fungible tokens (NFTs) have also been taking the trading world by storm. As described in this the Hustle article:

“An NFT can represent any kind of digital asset: a piece of artwork, an audio file, a video clip, a plot of virtual land. The NFT isn’t actually the piece of artwork itself; it’s a piece of code on a digital ledger (blockchain) that points to where the artwork lives — usually on a server somewhere else.”

If you think of an NFT as being like a collectible—say, an autographed baseball card—but in digital format, you’re getting close to envisioning its worth. Similar to playing cards, people are collecting these pieces of code, typically exchanging them in cryptocurrency such as bitcoin.

How much is an NFT actually worth? However much the market decides. Some are currently trading in excess of $1 million each. As the Hustle article describes, NFTs “have caught the attention of tech investors (Mark Cuban), the high-brow art world (Christie’s auction house), and major corporations (Nike) alike. And everyone from Lindsey Lohan to the rock band Kings of Leon is flooding the market with high-priced virtual creations of their own.”

Innovations vs. Investments

These and similar get-rich-quick possibilities may seem shiny and new. And some of the underlying infrastructure truly is groundbreaking. Like the Internet, electricity, and the wheel, intriguing innovations like blockchains, cryptocurrency and NFTs may lead to incredible applications we can’t even imagine at this time.

Plus, at least on paper, there are those who have amassed rapid fortunes by being in the right place at the right time. Trading into the innovations, they’ve caught a wave of risk-laden opportunity; some have gotten very rich in return. Much of the action is highly reminiscent of the 1990s tech bubble, when a trade at nearly any price into nearly any company with a high-tech name seemed sure to pay off handsomely … right up until most of them no longer did.

Time will tell whether these brave speculators manage to convert their good fortune into lasting wealth once today’s trends fizzle or fly. Because beneath it all, the laws of the jungle remain the same. Among these immutable laws is determining whether you want to be a sprinting speculator or a long-distance runner in the wilds of the stock market—and trading accordingly.

In his book, “The Psychology of Money,” Morgan Housel describes two types of market participants—short-term traders and long-term investors—and why it’s essential to know which one you are:

“Short-term traders operate in an area where the rules governing long-term investing—particularly around valuation—are ignored, because they’re irrelevant to the game being played. Bubbles do their damage when long-term investors playing one game start taking their cues from those short-term traders playing another.”

97-year-old billionaire Charlie Munger (Warren Buffett’s long-time Berkshire Hathaway partner) is even more blunt about the differences between short-term speculators versus long-range investors. Some “may call it investing,” he said in a recent interview, “but that’s all bulls**t. It’s really just wild speculation, like casino gambling or racetrack betting.”

In yet another powerful piece, “Financial Implications of Robinhood Investors,” financial author Larry Swedroe took a look at a recent academic study that analyzed the new breed of stock market participants using Robinhood’s no minimum, zero-commission trading platform. The study found that Robinhood participants tend to be younger; less wealthy; and hungry for more frequent, higher-volatility trades. In aggregate, “zero-commission investors behave as noise traders,” with a market impact similar to past noise trading and inventory risk models.

Thriving in the Jungle

In other words, hot trends are business as usual in the financial jungle. Fortunes will rapidly rise overnight. But many will fade just as suddenly. A few will strike it rich. Far more will be left licking their wounds … if they’re lucky.

That’s a dicey way to patiently pursue your long-term financial goals. You may be seeking to harvest returns from the same market, but your end goals are entirely different from those of noise traders on the prowl. Remember these differences if you ever feel a little left out of all the excitement. It should address your concerns about whether they know something you don’t.

As 16th century Renaissance mathematician and gambler Gerolamo Cardano reportedly once said: “The greatest advantage in gambling lies in not playing at all.”

The defense and aerospace company, Saab Inc., has their US Headquarters, and several hundred employees in our hometown of Syracuse, NY. In addition to their 401(k) match and great pay, they offer one of the most appealing Employee Stock Purchase Plans we’ve ever seen.

At its core, this is an employee stock purchase plan that provides a match if the shares are held for 3 years. In order to get the free doubling of your investment, you must take on additional risk related to the health of your employer and currency risk. Still, it’s a tradeoff worth taking.

In this piece we go into detail on how it works, the financial aspects that make it so great, and a recommended strategy for it.

How it Works: For U.S. employees, you must either enroll in the plan in November or May. At enrollment you choose to have between 1% and 5% of your paycheck withheld for the Share Matching Plan. Once enrolled, you will have money taken out of each paycheck and set aside for purchases of Saab AB B. These purchases happen each month.  

The stock, Saab series B shares, is custodied in an account in your name at Computershare. The shares carry both market risk and currency risk as they are held in Swedish Krona. The shares bought with money withheld from your paycheck are 100% yours the moment they are invested. You can sell the shares and withdraw the money at any time and pay the applicable taxes. If you sell them within a year, you will pay short-term gains or losses. If you sell them after holding them for a year, you will pay long-term gains or losses. If you sell them at the exact price you purchased them, you will owe nothing as the purchase was made with after-tax dollars from your paycheck. While you hold the shares, you will receive a cash dividend that you will pay taxes on.

Once the shares are held for three years, you will be matched 1 for 1, doubling your position.  You will owe ordinary income taxes on the value of the match you are receiving at the time it is received. Taxes on the sale of the matched shares will be short-term gains/losses if done in the first year, and long-term gains/losses if done after one-year. If you sell the matched shares as soon as they become yours, your taxable gain/loss will be minimal.

The Benefit: You could think of this as free money, though it comes with risk. We will look to quantify how much the extra benefit is worth and how much Saab can underperform the market and still be profitable.

The following table outlines how the Share Matching Plan would work assuming a hypothetical employee with a $200,000 salary and doing the full 5% match. We assumed a 6% price appreciation and ignored dividends. We also assumed the employee sells all the stock as soon as it is matched in year 3. In reality payments are made each month, but we analyzed the data as if it were a year-long program to help visualize what is happening.

In this scenario, $10,000 worth of Saab stock grows to $11,910 by the end of the third year. When that is sold the employee pays long-term capital gains on the $1,910 of growth. Assuming a combined federal and state tax rate of 21%, they would owe $401 of taxes, leaving them with $11,509. At the same time, they also receive $11,910 worth of matched shares. That entire amount is taxable as ordinary income, at an assumed rate of 33%. That means $3,930 of taxes are paid on the $11,910 of benefit, for an after-tax net of $7,980. In total the employee is left with $19,489 at the end of the third year, roughly doubling their money.

Let’s say Saab didn’t have this program and instead the employee invested the $10,000 in a stock market index fund. Assuming the market appreciated by 6% (not including dividends), and at the end of 3 years the employee sold their position for cash, they’d have the same $11,910 of proceeds for an after-tax value of $11,509.

A good question is – how much can Saab underperform the market and have the participant still not be harmed by the Share Matching Plan?

We can solve to find that Saab stock (plus the currency movement) can underperform the market by 19.6% and the plan is roughly a wash, as seen by the table below.

In this example, Saab stock is losing 13.6% per year for 3 years, and the end result is an after-tax balance of $11,509, the same as what you would have gotten from the stock market if the market returned a positive 6%. In total that’s roughly a 20% annualized difference.

There is no reason to expect Saab’s stock and the Swedish Krona to underperform by an annualized 20% making this plan attractive.

Recommendation: We recommend Saab employees take full advantage of the Share Matching Plan, putting in the 5% maximum each month. Once the shares are matched, they should be immediately sold. For a Saab employee with a $200,000 salary, and assuming market returns, you’d be reducing your monthly paycheck by about $830, but after three years in the plan, you are getting a $1,625 rolling after-tax cash out. In order to take advantage of this you’re exposing yourself to an additional $60,000 of market risk in Saab stock and the Swedish Krona.

Whether you’re an employee of Saab AB looking with further questions on the Share Matching Plan, or you’re a client with questions related to your employee stock purchase plan, please reach out to your advisor, e-mail us, or schedule a call.

A question most investors ask themselves at some point is: “Is today a good day to buy into the market?” I waffle between two responses that sound the opposite but mean the same thing. It’s always a good day to buy and there is no such thing as a good day to buy. It’s always a good day to buy in the sense that markets go up over time and no one knows what the market will do tomorrow so it’s best to get your money into the market now. There are no such things as good days to buy in the sense that the question implies there are bad times to buy and you should wait until a good time, but you shouldn’t wait so there is no such thing as a “good day.”

That said we looked at daily moves in the S&P 500 going back to 1928, to see if some days have presented historically good buying opportunities. We sorted days into groupings and then looked at the return on the ensuing day. The following table summarizes the findings:

Any Day: In aggregate, the market goes up an average of 0.03% each day.

Up Days: The average return of the stock market the day after it goes up is a positive 0.07%.

Down Days: Some might say buying on just any down day isn’t a good move as it is one of two scenarios where the ensuing day averages a negative return. But the average is barely negative, effectively 0.

Up 2% Days: When the market has a strong day, the next day rises about the same as an average day.

Down 2% Days: Now we start getting into interesting numbers. When the market drops by 2% or more, the ensuing day tends to be quite positive with an average return of +0.19%. On average we get a handful of days like this a year.

Up 4% Days: When the market has a very strong rally, it’s probably best to wait a day before buying stocks. Unfortunately, these large rallies are rare. Despite having 8 such days in 2020, we only saw one from 2012 – 2019.

Down 4%: When the market is tanking, it’s reasonable to expect a rebound the next day. On days when the market drops 4%, we typically see it regain two-thirds of a percent the following day. Like with up 4% days, these seem to only happen in times of extreme volatility.

Consecutive up 2% Days: These are very rare and very boring. When the market has two strong days the ensuing day averages the exact same as any given market day.

Consecutive down 2% Days: Again, very rare but this time very good. When the market slides by 2% on back-to-back days, the following day is often very positive, up nearly a full 1% on average. This year we had three such days with the following days showing returns of -0.38%, +9.29%, and +9.38%. Coincidentally, the market’s bottom on March 23rd was the second consecutive down 2%+ day (-4.34% & -2.93%). Again, these are so rare they are not worth waiting and the days after the ensuing day may be bad, but that ensuing day is usually pretty good.

What can we conclude from this? My only takeaway is that you should buy when you have the funds available with the exception of a day when the market is up BIG (4%+). While large down days do present good buying opportunities, they are rare and not worth waiting for. Most other days tend to have positive ensuing returns reaffirming the idea that money should be invested.

This is not to say there isn’t merit to dollar cost averaging. When you have money that has been sitting in cash and are concerned with the psychological impact of getting unlucky, it can make sense to buy in over a period of months on a set schedule.

The stock market can be cruel, volatile, inexplicable, and frustrating for those who try to pick the perfect time to buy. By investing when the funds are available, accepting perfect is impossible, and blocking out the noise, you position yourself to contently reap the benefits of investing. As we get through the holiday season, take a look at your finances and if you have the capacity to invest additional cash- please reach out, now is as good a time as any!


With the general election one week away, many Americans and capital markets are awaiting the results. In this piece, we will go over expectations heading into the election and possible market reactions based off those outcomes.

Before we dive in, it’s important to remember current market prices reflect all known information and expectations. And while we don’t know the outcome of the election or how the market will react, we do know it pays to be invested over the long run which is what we are recommending for all clients. Stick with your plan, take a personally appropriate level of market risk, and enjoy the long-term appreciation we’ve observed over the last 90 years and will observe over the next 90.

In the election forecasting world, two of the best sources are FiveThirtyEight.com and online betting markets (we’ll look at PredictIt). Between the two, we feel FiveThirtyEight is more reliable but it’s worth showing both.

Both sources show Biden as the expected winner with FiveThirtyEight showing very high likelihood. The betting website has Biden at 63% which indicates its users are less certain of a Biden victory. Though there are limitations around betting market regulations which make the true likelihood of a Biden victory larger. On the FiveThirtyEight side, Trump’s 11% chance of winning reelection is quite a bit lower than the forecasting website showed in 2016. While things with odds of 11% do happen 1 in 9 times, it is reasonable to say the market has priced in a Biden victory and will be surprised if Trump is the winner.

The following tables show a few other ways of looking at expectations of the upcoming presidential election.

We don’t have data for the expected PredictIt margin in 2016, but in 2020 we again are seeing a Biden victory, with a narrower margin among online betters than the forecasting website FiveThirtyEight. Again, it’s worth noting how much more decisive FiveThirtyEight is predicting the 2020 election than the 2016 election – reiterating that markets expect a Biden victory.

The House of Representatives is relatively boring. Democrats have a sizable advantage and that is expected to stay the same. The current makeup is about 54% Democratic and it’s expected to slightly rise to 55% Democratic.

It’s interesting that the online betting market and FiveThirtyEight are more or less saying the same thing when it comes to the House of Representatives, but not the Presidency.

What will likely be the most interesting part of the election is what happens in the Senate. At the moment, Republicans hold a 53-47 advantage. It is expected that Democrats will pick up seats, but how many is not known.

Republicans are expected to gain a seat in Alabama, where Democrat Doug Jones is up for reelection. Democrats are expected to gain a seat in Colorado as former Democratic Governor John Hickenlooper has a large polling lead over incumbent Republican Cory Gardner. Democratic candidates also have narrow(er) leads over incumbent Republicans in Arizona, Maine, North Carolina, and Iowa. If the polls hold in all those, that will give Democrats 51 seats in the Senate. If Republicans hold on to one of those, but Biden wins the Presidency, Democrats will have the ability to control the Senate because the Vice President (Kamala Harris) serves as the deciding vote in the event of a tie. In a dream scenario for Democrats, they could pick up additional seats in Georgia (2), South Carolina, Montana, and even Kansas. Republicans have an outside chance at picking up seats in Michigan and Minnesota.

A narrow Democratic majority isn’t expected to be overly liberal. Democrat Joe Manchin of West Virginia has a fairly conservative voting record, as does Jon Tester of Montana. Angus King of Maine is fairly moderate and it’s reasonable to expect a new Democratic Senator from a purple state like Iowa, Arizona, or North Carolina will want to strike a moderate tone in their first term. From a markets perspective, the expectation is for a fairly moderate Senate that doesn’t pass any policies overly different from the status quo (like Government run healthcare, or a Green New Deal).

If Democrats got 53-55 seats, this would be different from expectations, but it’s not clear how the market would react. Some might be concerned that a more liberal senate would pass policies unfriendly to businesses and a strong democratic showing might encourage liberals to push for more business regulation through the executive branch. Those would be seen as bad for future corporate profits and harmful to stocks. However, others might see a more democratic senate as better on getting COVID under control and more likely to pass a large and generous infrastructure / general spending bill. That would be positive for expected corporate profits and stocks.

Remember, under current Senate Rules most legislation needs 60 votes to avoid a filibuster. The exception is one budgetary bill per year that just needs a majority and passes by the “reconciliation” process. This is how Republicans passed their tax cut three years ago. While it’s only one bill a year, it can be a large bill with broad provisions/impact. It’s possible the next Senate could change the rules but that isn’t likely.

To conclude, the current expectations are for Democrats to maintain a similar majority in the House, Biden to win the presidency, and Democrats to narrowly gain control of the Senate. If all this happens you would not expect the market to react in a meaningful way over a longer period of time. There may be high volume that causes some choppiness in the immediate aftermath of the election, but the overall direction of the market should not move much from this outcome. It could move from other news – like COVID, or issues abroad.

We are quick to concede “experts,” forecasts, and predictions are wrong all the time. We saw it in 2016 with the election, we saw it with economists and interest rates in 2019, and we saw it with the American hockey team at the winter Olympics in 1980. That said they are often right. Despite poor performance in 2016, FiveThirtyEight was spot on in 2008 and 2012. They also called the House in 2018 almost exactly and were a seat off in the senate.

If we see an election outcome different than what’s expected that could lead to volatility, but like we saw in 2016, it’s hard to predict how the market will react. On the night of the 2016 election, stock futures were down 5% at midnight after it was clear Trump would win, however they regained all their losses by the market open and finished up 1% on the day.


Here’s an interesting puzzle: Why do we cringe at the sight or sound of breaking glass, but we salivate over breaking news?

In the run-up to the U.S. presidential election, you’ve probably been hit by enough breaking news to propel you well into 2021. Predictions abound on who will prevail, and what will happen to our political, social, and economic landscape as a (supposedly) direct result.

Come what may, the results will undoubtedly be attention-grabbing and action-packed. Social media and the popular press will see to that, as they feed on – and are fed by – our fascination with things that break.

To counter all the excitement, we offer three calming insights:

  • Cause and effect are rarely as direct as we might hope or fear. Please apply this point to any temptation you may be feeling to alter your investments because “X” has just happened, or in case “Y” seems about to. Before, during, and after the election cycle, pundits will be proclaiming they can predict the financial fallout from an election characterized by such stark contrasts. At least in terms of tomorrow’s market prices, they do not know. They cannot know. There are simply far too many interacting interests to make the call.
  • It’s much easier to explain an outcome than to predict it. In this Forbes column, the author describes how scientists have detailed models for explaining why volcanoes occur. But they still cannot predict each eruption. The same can be said for financial markets. We have excellent models for explaining a market’s overall factors and forces. But our ability to predict its individual events or specific moves remains as elusive as ever.
  • Elections come and go. Your investments last a lifetime. As U.S. voters, we have the opportunity to select our next president every four years. As investors, we are best served by measuring the balance of power in our portfolio across decades rather than years. As Dimensional Fund Advisors has demonstrated in this excellent illustration, “for nearly 100 years of US presidential terms [the data] shows a consistent upward march for US equities regardless of the administration in place.”

In other words, no matter which political party is in power, your best chance for achieving your personal financial goals remains the same: Continue to give your investments ample time and space to benefit from the market forces just described. As we move together through the breaking news yet to unfold, we hope you vote according to your values, but heed this valuable advice about your lifetime investments. Stay the course!

Stock Markets

Stocks continued to come back from their sharp declines earlier in the year. Over the September quarter, stocks are up across the board – Domestic Large-Cap stocks and Emerging Markets are up 9%. Since December 31st, a diversified global portfolio is off 8% year-to-date excluding the Domestic Large- Cap market, which is driven by the largest tech companies. Returns from domestic stocks continue to exceed those of non-domestic stocks.

Value stocks are priced based on expected earnings from assets in place while growth stocks reflect expected earnings mainly from future investments.

Research shows that markets tend to overprice these future earnings. Yet, there has been a significant discount to value stocks in recent periods, which is especially pronounced in the year-to-date numbers.

Looking back over a long history the average difference in five-year returns between a blended index and a value index is close to zero. The historical variability is such that a discount to value stocks of more than5%, such as we experienced over the most recent five-year period, is clearly an outlier.

Results over the past quarter show the stock market continuing to shrug off the economic and political uncertainties of today. The well-worn observation that the stock market is not the economy continues to resonate as stocks are based on expectations well into the future.

Bond Markets

The Yield Curve below shows the pattern of observed returns from holding bonds to term across several maturities. Today, these Treasury yields go from essentially zero to a little above 1% across a twenty-year spectrum – little change from last quarter which explains the essentially flat bond returns regardless of maturity over the period. On the other hand, look how yields have fallen over the past twelve months in response to the Fed providing the market with liquidity. This change explains bond returns over the past year that run from 4% to 11% – the longer the time to maturity, the greater the return.

In response to ongoing economic uncertainties the Fed is keeping interest rates low and doing all it can to ensure liquidity. These activities result in a yield on 10-year inflation adjusted Treasuries of a negative 1%, which means investors are essentially paying the Treasury to hold their money. While these negative yields have been the case since February, it does not seem sustainable over a long period.

Dealing with Today’s Unconventional Markets

It is difficult to reconcile today’s investment landscape with established expectations – negative real interest rates; massive government spending with little impact on inflation; some stocks trading at PE ratios well above 30 times trailing twelve-month earnings; sharp discount to value stocks; large variances in returns among several markets. Today’s conditions reflect the external shock of the Coronavirus pandemic; we have fewer clues as how things might look on the other side.

Massive government spending without inflation is inconsistent with conventional wisdom. Inflation did not happen with the 2008 financial crisis and is not happening now. The view from the Fed is that interest rates and bond yields will remain low. The only way to do better is to take risk – either credit risk, interest rate risk, or liquidity risk, which oftentimes is difficult to access. Yet, because bond results remain uncorrelated with stocks, they are important to managing a portfolio’s risk. While fulfilling that role, we need to accept an essentially zero return for the time being.

The Fed’s actions mean bonds are not attractive causing investors to turn to the stock market for expected positive returns thereby increasing the demand for these assets. Today’s stock market is driven by the largest tech companies. While other markets have come back to some extent from the sharp fall-off in March, it is just these tech companies that explain much of the results of the S&P 500 Index.

With some stocks beginning to look pricey and anemic bond returns assured, there is a strong urge to take profits in stocks and move to the sidelines until the investment environment improves. History has shown this is not a good idea. Moving away from established allocations due to a worry of the investment environment is “market timing,” which everyone acknowledges rarely works out.

There is no reason to think this time is different. Yet, just like a hot fudge sundae, market timing is something you know you should avoid but it is hard to do. History tells us to establish commitments based on long-term risk objectives, rebalance regularly, but expect a bumpy ride. u

The utility of living consists not in the length of days, but in the use of time.

Michel de Montaigne

For better or worse, many of us have had more time than usual to engage in new or different pursuits in 2020. Even if you’re as busy as ever, you may well be revisiting routines you have long taken for granted. Let’s cover eight of the most and least effective ways to spend your time shoring up your financial well-being in the time of the coronavirus.

  1. A Best Practice: Stay the Course

Your best investment habits remain the same ones we’ve been advising all along. Build a low-cost, globally diversified investment portfolio with the money you’ve got earmarked for future spending. Structure it to represent your best shot at achieving your financial goals by maintaining an appropriate balance between risks and expected returns. Stick with it, in good times and bad.

  1. A Top Time-Waster: Market-Timing and Stock-Picking

Why have stock markets been ratcheting upward during socioeconomic turmoil? Market theory provides several rational explanations. Mostly, market prices continuously reset according to “What’s next?” expectations, while the economy is all about “What’s now?” realities. If you’re trying to keep up with the market’s manic moves … stop doing that. You’re wasting your time.

  1. A Best Practice: Revisit Your Rainy-Day Fund

How is your rainy-day fund doing? Right now, you may be realizing how helpful it’s been to have one, and/or how unnerving it is to not have enough. Use this top-of-mind time to establish a disciplined process for replenishing or adding to your rainy-day fund. Set up an “auto-payment” to yourself, such as a monthly direct deposit from your paycheck into your cash reserves.

  1. A Top Time-Waster: Stretching for Yield

Instead of focusing on establishing adequate cash reserves, some investors try to shift their “safety net” positions to holdings that promise higher yields for similar levels of risk. Unfortunately, this strategy ignores the overwhelming evidence that risk and expected return are closely related. Stretching for extra yield out of your stable holdings inevitably renders them riskier than intended for their role. As personal finance columnist Jason Zweig observes in a recent exposé about one such yield-stretching fund, “Whenever you hear an investment pitch that talks up returns and downplays risks, just say no.”

  1. A Best Practice: Evidence-Based Portfolio Management

When it comes to investing, we suggest reserving your energy for harnessing the evidence-based strategies most likely to deliver the returns you seek, while minimizing the risks involved. This includes: Creating a mix of stock and bond asset classes that makes sense for you; periodically rebalancing your prescribed mix (or “asset allocation”) to keep it on target; and/or adjusting your allocations if your personal goals have changed. It also includes structuring your portfolio for tax efficiency, and identifying ideal holdings for achieving all of the above.

  1. A Top Time-Waster: Playing the Market

Some individuals have instead been pursuing “get rich quick” schemes with active bets and speculative ventures. The Wall Street Journal has reported on young, do-it-yourself investors exhibiting increased interest in opportunistic day-trading, and alternatives such as stock options and volatility markets. Evidence suggests you’re better off patiently participating in efficient markets as described above, rather than trying to “beat” them through risky, concentrated bets. Over time, playing the market is expected to be a losing strategy for the core of your wealth.

  1. A Best Practice: Plenty of Personalized Financial Planning

There is never a bad time to tend to your personal wealth, but it can be especially important – and comforting – when life has thrown you for a loop. Focus on strengthening your own financial well-being rather than fixating on the greater uncontrollable world around us. To name a few possibilities, we’ve continued to proactively assist clients this year with their portfolio management, retirement planning, tax-planning, stock options, business successions, estate plans and beneficiary designations, insurance coverage, college savings plans, and more.

  1. A Top Time-Waster: Fleeing the Market

On the flip side of younger investors “playing” the market, retirees may be tempted to abandon it altogether. This move carries its own risks. If you’ve planned to augment your retirement income with inflation-busting market returns, the best way to expect to earn them is to stick to your plan. What about getting out until the coast seems clear? Unfortunately, many of the market’s best returns come when we’re least expecting them. This year’s strong rallies amidst gloomy economic news illustrates the point well. Plus, selling stock positions early in retirement adds an extra sequence risk drag on your future expected returns.

Could you use even more insights on how to effectively invest any extra time you may have these days? Please reach out to us any time. We’d be delighted to suggest additional best financial practices tailored to your particular circumstances.


It doesn’t take a genius to be a good investor

And geniuses often aren’t. This summer marked the 300th anniversary of the South Sea Bubble when Britain’s South Sea Company went from £128/share in January of 1720 to over £1,000 by August, and then crashed to £124 by the end of the year.

The most famous person to be caught up in the bubble was Sir Isaac Newton. Widely considered a top 10 mind in history, few have contributed as much to the advancement of humanity. Newton is credited with formulating the laws of motion and gravity. He used his mathematical discoveries to prove planetary motion, explain the ocean’s tides, the earth’s equinoxes, and the shape of the earth. This work helped speed the general populace’s adoption of the sun as the center of the solar system. Newton also made advances in telescopes, thermodynamics, was the first to calculate the speed of sound and he developed calculus.

Despite his unrivaled mind, he was faced with a question in 1720 to which he didn’t know the answer, what to do about the South Sea Company? He had always been a conservative investor with a majority of his wealth in government bonds, and a lesser portion in large companies, including the South Sea Company. As the hype in 1720 around the South Sea Company became unavoidable, he had three choices – sell out, do nothing, or buy more of the South Sea Company.

Come April, a share of the South Sea Company had tripled in value to £340. Newton decided this rally was unjustified and liquidated his position, realizing a large profit. Unfortunately for Mr. Newton the story doesn’t stop there, come June a share had rallied to over £700 and Newton decided he had been wrong. Over the next three months he liquidated all other holdings and put his entire fortune into the South Sea Company near its peak.

The price of the stock collapsed as the market reached a consensus of future profitability that was far below the level needed to sustain the elevated valuation. Investors who had bought on margin were bankrupt and Newton saw his fortune decline by 40% from 1719 to 1721. The unpleasant experience caused him to proclaim, “I can calculate the motions of the heavenly bodies, but not the madness of people.”

In reality, the madness was his own and this was an uncharacteristically human moment for a man whose mind was supernatural. We can learn much from Mr. Newton’s investing errors. One of the problems with market timing is you have to be right twice. He made a sale in April that proved timely but picked the wrong time to get back into the market. Net, net he was worse off for it.

Our cognitive biases and thirst for riches betray the best of us. On average, the wisest course is to stay the course – develop a plan founded in reason and stick with it. The plan should change when circumstances change but not when emotions change. Please reach out to your advisor to discuss chancing life circumstances and how they affect your investment plan – and if you are able to stick with that plan, you’ll be smarter than Newton.

Arguably the most important thing Rockbridge does is forecast what kind of lifestyle families can expect in retirement. We believe our attention to retirement planning, and all aspects of financial planning, separates us from other wealth managers in Syracuse and across the country. The fee-only fiduciary model puts clients first and delivers on things investors can control.

As we’ve been reminded again this year, one thing investors can’t control is the stock market. A healthy couple in their 50s may have a 40-year investment horizon for their assets. If that family will be relying in part or in whole on savings (401(k)s or otherwise), return assumptions become hyper important. Each year our firm looks at our return and inflation assumptions and makes updates as necessary. With the profound impact of the Coronavirus on capital markets we updated these assumptions in May.

Inflation: Inflation is one of the most important assumptions in retirement planning. Spending in retirement increases with inflation, it erodes fixed payments like pensions and high inflation can reduce the spending power of a portfolio if returns don’t increase commensurately. Many economists forecast inflation and the market has an implied inflation number based on the Treasury Inflation-Protected Securities (TIPS) market. Through the pricing of TIPS and the non-inflation adjusted treasury bonds you can back into a market implied inflation number. When Rockbridge forecasts inflation in retirement, we use the implied 30-year inflation rate. In May the market implied 30-year inflation was 1.4%, which is what we are currently using in our forecasting. This is down from the 2.1% we used in 2018 and the 1.8% we were using in 2016.

Bond Returns: Bond returns are fairly straight forward in that their expected return in the near future is denoted by their published SEC yield. If interest rates rise or fall during a period, the returns we realize over that period will be impacted (negatively or positively). However, in the event interest rates rise and realized returns suffer, higher interest rates mean a larger expected return going forward and vice versa. We are currently using 1.6% for expected return on the bond portion of our portfolios.

Equity Returns: The expected return on stocks is the most difficult to forecast and is historically the most volatile. One of the best way to think of equity returns is an “equity risk premium”, which means you expect equities to return an extra amount over a risk-free asset to compensate you for owning something volatile. How one defines a “risk-free asset” can vary. Over the last 90 years we’ve seen the following returns from stocks and assets that carry little or no risk.

The average equity risk premium over that time has been 6.19%. If you average the current inflation expectations with treasury rates you get 0.62%

The historical equity risk premium plus the current risk-free average gets you to 6.8% which seems reasonable. Forecasting equity returns is challenging and even the most systematic forecasts have an element of subjectivity. Like any method, ours has flaws. The most notable is the treatment of equity returns during a recession. Typically, the middle of a recession comes with lower inflation expectations, and a drop in interest rates. Those conditions would lead to a lower expected return. However, if the middle of the recession comes at the same time as a large drop in stock market prices, then you wouldn’t expect a low return as we usually see a regression to the mean and a bounce back in stocks.

In the present situation, we think the lower expected return is warranted as the stock market has by and large recovered from the lows seen on March 23rd.

We will continue to monitor capital markets and update our financial planning assumptions as needed in order to deliver the best quality product to our clients. If you have any questions related to expected returns or how they fit into your retirement, please reach out to your financial advisor.

Last week, the largest U.S. Banks reported earnings. Since then, sellers of news have been scouring the information in an attempt to entertain their viewers and readers with insights into the future of stocks and the economy. Let them, but know the real value to the investors is not in the headline earnings miss, the increased provisions for loan defaults, the updated economic outlook, or what might happen to tier 1 capital ratios and subsequent dividends. The real lesson is from the part of the banks that did well, their trading revenues.

Trading revenue is an abstract concept. When a bank sells a bond for $1,010 you might think that would equate to $1,010 of revenue but it doesn’t. If the bank had bought the same bond for $990 earlier in the day, that would equate to $20 of revenue. Trading revenue is the net the firm makes from being a market maker. Higher trading revenue was seen across all banks, with JP Morgan reporting a 32% increase for the quarter relative to Q1 in 2019. That’s a large increase, especially when you remember that volatility didn’t hit the markets until the last week of February.

The cause of the increase in revenue is from more volume and wider bid/ask spreads. More volume is straight forward, banks make money when people trade, and when people are trading more, they make more money.

Bid/ask spreads are more confusing. Banks are what are known as dealers, meaning they are willing to buy or sell a security at any time and hold it on their books. That exposes banks to the possibility that they won’t be able to get back to risk-neutral at a favorable price. As dealers, banks try to put a price on anything, so when markets get volatile, they charge wider bid/ask spreads to compensate themselves for the greater uncertainty that they won’t be able to get out of the position. When everything is averaged out, the greater risk generally means greater return which is what we saw this past quarter.

A good example of banks profiting off bid/ask spreads is seen with a corporate bond from CVS. CVS’s 3.7% maturing on 3/9/2023 is a very liquid bond. It has $6 billion outstanding and is heavily weighted in many bond indexes and funds. It’s the largest holding of one of our favorites, Vanguard’s Short-Term Corporate Bond Index Fund (VCSH). This is not an obscure bond; this is a very mainstream security.

The data from Charles Schwab in the following table shows how volatility can affect the spreads and subsequent profitability by banks trading securities.

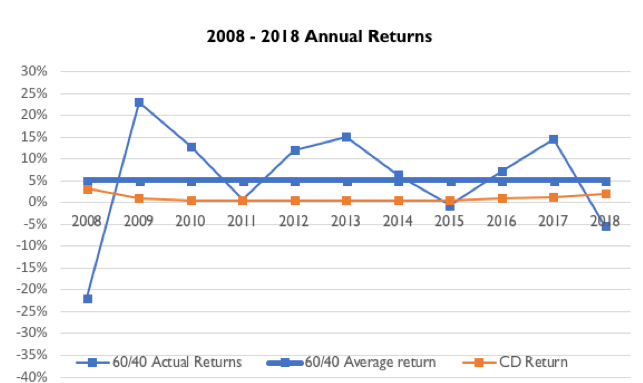
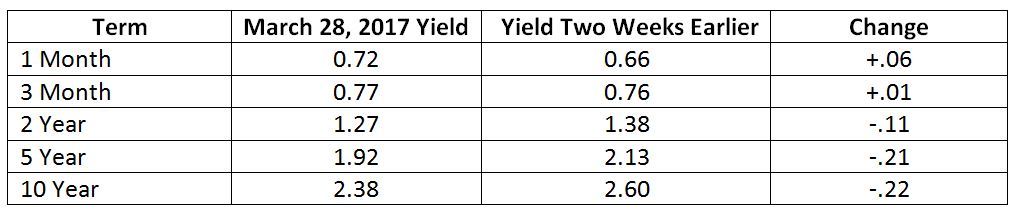
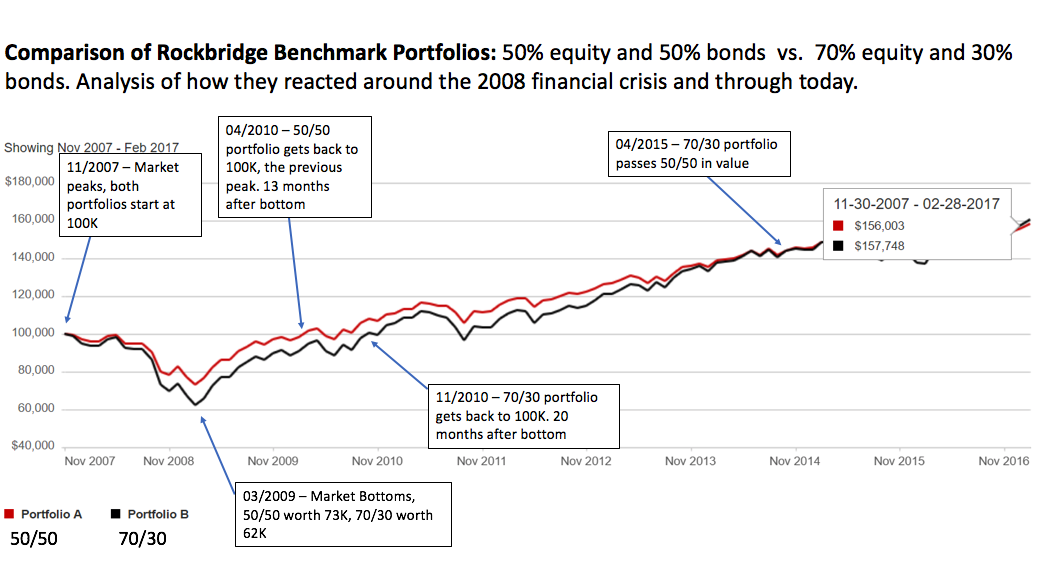
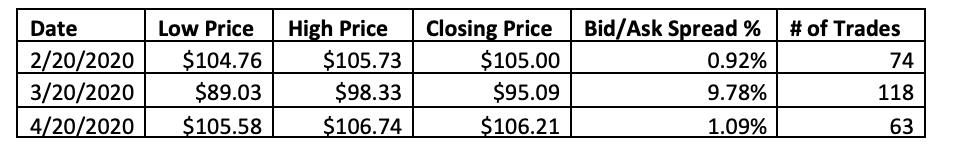
In February and April, trading volume was average, and spreads were reasonable. But March! As views of the world diverge, profits explode. There are desperate sellers who only know they want out and are willing to sell at $89/share, a 15% discount from recent levels. Meanwhile, buyers view $98 as an easy way to get a safe, investment-grade bond maturing in three years, at a 7% discount. The colossal difference between $89 and $98 is profit for the banks – Wall Street loves volatility.

What is the lesson here? When the urge is greatest to do something, the best action is often doing nothing. Our advisors received numerous calls and e-mails in March asking what adjustments we were making to our portfolios to address these changing/uncertain times. We could have created a plan of actions that would have sounded sophisticated but the only one guaranteed to benefit from that would have been trading desks.

It’s important to remember the distinction between investing and playing the investment game. Investing is providing capital to entities who use the funds to create wealth. In exchange for providing the capital and enduring the ups and downs of the economy your funds appreciate over time. Playing the investment game involves keeping “dry powder” and “staying nimble.” It sounds sophisticated and exciting, and it may be good fun, but it’s a zero-sum game, akin to poker, and the banks are the house. At Rockbridge, we try our best to ensure you’re investing.

In the last quarter of 2018, the market was down 20% from previous highs and we had many clients reaching out concerned about declines and high volatility. But when we examined the market’s movements, we found the volatility to be higher than normal but far from extraordinary. Recently, we have gotten similar questions from clients again on returns and volatility. Here we examine historical daily price movements of the S&P 500 to try and see if the market has really been crazy or if people are overreacting.

The average daily price movement in the last 30 trading days of the quarter was 4.10%. In terms of 30-day stretches, this is the third most volatile period in history, behind the 4.41% seen on November 15, 1929 and the 4.13% on  November 21, 2008. In terms of acute volatility, what we’ve recently seen is not unprecedented, but we’ve never seen anything much higher.

If you look at the entire quarter, which had 62 trading days, the average daily movement was 2.28% which is the eighth most volatile quarter on record. The greatest quarterly volatility was at the end of 2008 (3.34%), and the other six were between 1929 and 1933. Three of those came in 1932 when the average daily movement for the year was 2.59%!

These are only a few ways of looking at volatility, but regardless of how we measure it, the recent volatility in the stock market is very high and very unusual. However, it is important to remember that volatility can be brief. On Friday October 16, 1987 the market dropped 5.2%. The following Monday it dropped 20.5%. The Monday after that it dropped 8.3%. Despite this unprecedented volatility and huge daily drops, the market finished 1987 up 5.3%.

We don’t know how long this type of volatility will last, but we know enduring it is worth it. Investors earn years like 2017 (+21.8%) and 2019 (+31.5%) by sticking it out during times like this.

Rebalancing the allocation among risky assets in your investment portfolio is an important discipline.  It provides a structured way to maintain consistent risk exposure over time and forces us to “buy low and sell high” when it is not always the comfortable thing to do.  This quarter is a good example, in the midst of crashing stock prices, and record volatility in markets, we have been selling bonds to buy stocks in our portfolios.  Buying stocks during all this uncertainty can feel uncomfortable if not downright frightening, but here are a couple of things to keep in mind.

Cash never “goes to the sidelines.”  If you listen to the talking heads of financial news-media, it can sound like all investors are reducing their exposure to stocks, and hoarding cash to buy back in when prices are lower.  But that’s not the way markets work!  Whenever a share of stock is sold, another investor buys it.  When there are more sellers than buyers, prices fall to clear the market.  Warren Buffet’s famous saying bears repeating now, “Be fearful when others are greedy, and be greedy only when others are fearful.”  Another famous quote strikes a chord as well, “In bear markets, stocks return to their rightful owners.”  Long-term investors want to be the owners of stocks and down markets are an opportune time to buy.

When stock prices drop, expected returns increase.  It may at first seem counterintuitive, but the math is fairly straightforward.  The value of a stock, or any other asset, can be described as the discounted present value of all future cash flows.  There are two factors that influence the value of a stock:  future cash flows and the discount rate.  When cash flows become more uncertain, we apply a higher discount rate.  Logically, a rational investor would pay less for an uncertain stream of cash flows than a stream with greater certainty.  The discount rate is a reflection of expected returns.  When risk and uncertainty increase, investors demand a higher expected return.  Over the past two months many stocks have decreased in value by 30% or more.  Some of the decrease in value is driven by an expectation of lost revenue and profits (future cash flows) resulting from Coronavirus’ shutdown of the global economy.  However, some of the decline is due to fear and uncertainty, which translates to a higher discount rate.  Both of which have a negative impact on stock valuations.  In turn, buying stocks at today’s prices comes with the expectation of higher rates as compared to two months ago.

Rebalancing is a valuable and important discipline.  If you still have questions about rebalancing, or worry about the appropriateness of your target allocation, talk to your advisor.

Stock Markets

The damage to stocks from the Coronavirus pandemic is shown in the chart below as all markets are down dramatically. The domestic large cap stock market (S&P 500), driven by the largest tech companies, held up a little better.  Except for this market, this quarter’s falloff brought the five-year returns to essentially breakeven and we must look to the ten-year numbers for returns that generally compensate for risk.

We are in uncharted territory and will be for a while.  It’s not the usual economic “slowdown”, but a “shutdown”.  Ben Bernanke, Fed Chairman during the 2008 financial crisis, likens to a natural disaster not a depression. Markets are clearly discounting the massive uncertainty of the trajectory of the Coronavirus pandemic, the global economic impact and government’s response.

It is reasonably clear that this health crisis and our response will alter the future economic landscape. There will be ups and downs as we move from where we are to where we are going. Today’s prices reflect current information about what is known and what is unknown about this journey. The expected return implied by these prices is not only positive but is apt to be better than what we have seen in the past to compensate for the greater risk in this period of heightened uncertainty. There is no reason to conclude this expected return won’t be realized eventually. To earn these returns means to remain committed to established investment plans.

Bond Markets

A yield is what you earn by holding a bond to its maturity. It has been shown to be a reasonable proxy for the return expected.  Changes in yields drive returns – falling yields positive, rising yields negative.  The longer a bond’s maturity the greater the impact a given change will have on prices and returns.

You can see to the right how yields have dropped over the last quarter.  It’s only at maturities greater than five years when yields are better than zero.  The falloff in bond yields of over one percent since last quarter reflects the Fed’s reduction in interest rates and its announced commitment to provide liquidity during this crisis.  In addition to the activities of the Fed, yields at the longer end are consistent with a desire to avoid risk and the expectation of low rates well into the future.  We have the Fed’s playbook from the 2008 liquidity crisis to give a sense of how they will apply the various tools.

The impact of the massive stimulus package is another uncertainty. No doubt we’ll see increased deficits, which is usually accompanied by inflation.  However, inflation has been benign over the last ten years as we worked through the effects of the last recession. The same could hold true this time around, although the deficits are going to be greater. The bond markets are telling us to expect that inflation will remain in check.

Risk and Uncertainty

Uncertainty can’t be measured, but risk can as both are associated with an unknown future. The stock market, where investors buy and sell based on an uncertain future, is an example.  Using historical data, we can construct expectations and a range of outcomes, which can be used to measure stock market risk.  A pandemic is new territory and if we accept that how markets deal with uncertainty is reasonably consistent through time, then history provides some insight into describing what’s ahead.

Today it’s the uncertain trajectory of the Coronavirus.  As more data is gathered through the ongoing testing’ the uncertainty is translated into measurable risk, which is then reflected in expected outcomes and variability. While the stimulus package signals Congressional support in lessening the economic fallout, there is not much history in implementing a package of this magnitude. Be prepared for a trial and error process, and volatility.

Where are We?

It is hard to imagine what we are going through won’t have a lasting social and economic impact.  The level of expected unemployment claims and government spending is new territory. The highest priority right now is to reduce the uncertainty of the health crisis. It will take time to expand the testing to better understand this pandemic and for “social distancing” to begin to work.  In the meantime, commitment and perseverance is our immediate future.

Markets look to the future, which is significantly murkier than a month ago.  It may be a while before the future looks much clearer.  While especially difficult in the face of today’s falloff, the time-worn prescription for investing in these times continues to be apt – maintain established commitments, endure the volatility in the near term and expect positive returns for bearing these risks over the long term.

Claim: Stock market volatility has been crazy this month.

Our Ruling: True! This past month has been shockingly volatile. On average, there are 21 trading days in a month. Looking back on the previous 21 trading days ending 3/23/2020, we see an average daily move of 4.56%. There were more days with a 9% or greater movement (3) than days which moved less than 1% (2). The only time we saw more volatility in a month was in November of 1929. What we are seeing now is slightly more volatile than what we saw during the height of the financial crisis in 2008.

Takeaway: If the markets seem wild to you that is understandable and rational. Feeling uneasy because of this is normal.


Claim: Because volatility is so high, we will experience a market drop like we saw in 2008 or the Great Depression.

Our Ruling: False! While that claim is possible, believing it to be certain is wrong. No one knows where the stock market will be in a day, week, month, year or decade. The logic of high volatility could have been applied to the stock market in 1987, when in just 4 trading days, the market declined 28.5%. But selling stocks then would have been a mistake. Over the ensuing 10 years, the market did little besides rise, appreciating at an annualized 18.7%.

Takeaway: Timing the market is a zero-sum game, it’s not investing. Every trade has two people on either side of it. If you are selling, someone else is buying. If you sell now thinking you’ll get back in when the market calms down, you’re counting on someone wanting to sell out when the market calms down. You may find markets can rise as quickly as they fall. Investing means enduring the ups and downs and being compensated for it. And you are compensated for it! Even with this month’s move, stocks have returned 9.75% annualized over the last 94 years.


Claim: Some investors are irrational.

Our Ruling: True! We have noticed two funny examples in the last month of irrational behavior. The first involved a hot stock and the second an unfortunate trade.

Zoom Video Communications (ZM), the video conferencing company from San Jose, is up 134% this year as their remote conferencing services are growing rapidly. Zoom Technologies (ZOOM), a defunct company from Beijing that hasn’t filed a 10-K in six years, was up 1,890% on the year as of Friday, March 20th. It has no reason to be up other than people confusing it with ZM.

State Street’s Mortgage-Backed Securities ETF, SPMB, had an interesting day on Thursday, March 12th. The fund which holds AAA-rated debt guaranteed by Fannie Mae and Freddie Mac was trading close to flat before plunging 12% in the last half hour of trading. The next day, it rallied to close little changed from where it opened the day before. The reason was a single trader placed a market order, rather than a limit order to sell 500,000 shares or $13 million worth of the ETF. When volatility is high, markets can be thin, especially near the end of the day. The order blasted through the bid, costing the seller roughly $1,000,000.

Takeaway: The market isn’t perfect, and some investors are irrational at times. Be wary of trying this at home on your own!


Claim: I should try to profit off other people’s foolishness.

Our Ruling: False! While the capital markets aren’t perfect, it’s the best system there is. Anomalies happen, but they can’t be predicted or modeled, and they vanish quickly.

Trying to profit off the movement in ZOOM is a risky endeavor. You could have bought early hoping for a greater fool to come and pay more in the future. This is a dangerous game; after peaking on Friday, the stock dropped 60% yesterday. You might think you could buy put options or short the stock. Unfortunately, you’d find no options market exists on ZOOM, and good luck finding someone long ZOOM willing to lend you the shares so you can short it. What happened with ZOOM is entertaining but profiting off it isn’t practical and it’s not investing.

There was a quick 10% to be made with SPMB if you bought right at the close on March 12th. To ensure you don’t miss the next opportunity you only need to create a system that monitors the 2,000 ETFs that trade in the United States, have several million in capital ready to put to work, and have the gumption to buy a plummeting ETF on a day the stock market is down 10% and bond liquidity is extremely low. In addition to all that you need another dummy to come along and place the foolish trade. Again, it’s not practical.

Takeaway: Profiting from irrational investor behavior is like betting on a game. In hindsight, it may seem obvious what was happening, but in the moment it’s challenging. You’re only going to make money if the person on the other side of the trade is losing money.

This is separate from investing where you give companies capital, the companies in turn provide goods and services, and wealth is created. You should expect a return from investing, but not from playing a game. At Rockbridge, we try to ensure you are investing.


That concludes this edition of Stock Market Fact Checker. Please reach out to Ethan directly if you have any claims you’d like a ruling on!

So, remember all those times we’ve said that investment risks and expected rewards are related?

Coronavirus-fueled fears, driving economic insecurities, aggravating a host of simmering global sore spots, spiraling into stomach-wrenching market sell-offs …

Be it confirmed. Today’s unfolding news is the realization of those risks we’ve been talking about all along.

In case you’ve forgotten – or never experienced – what investment risk feels like, we reach out to you today with three encouraging thoughts, to help you face any challenges ahead.

  1. For Real: Risks DO Drive Expected Returns

First, be assured, our advice on how to invest during volatile markets remains the same:

As a train needs its engine to move, markets require risks to drive them onward and upward.

Rather than spending too much time tracking passing headlines or watching every market move, consider reading a good book. For example, there’s Ben Carlson’s recently released “Don’t Fall For It: A Short History of Financial Scams.”

Carlson describes how the U.S. stock market (the S&P 500) has delivered a satisfying 9.5% annual return from 1928–2008. But during that time, there were only 3 years when returns hovered tamely between 9%–11%. Usually, annual returns deviated wildly from their norm.

So, yes, markets are risky. But here’s the reward to be expected in return: Most years (66 out of 91), steadfast investors earned positive returns, usually in the double-digits. Carlson concluded:

“Every successful investor must understand there is a sacred relationship between risk and reward. There is no proven way to earn a high return on your capital without taking some form of risk nor is it possible to completely extinguish risk from your investments.”

  1. Preparation Beats Panic

It’s one thing to embrace abstract risk. It’s quite another to endure it for real. So, second, remember this:

You have never been more prepared than you are today for whatever happens next.

In other words, if you’re worrying that NOW is the time to do something about the markets, consider what we’ve already been doing all along.

We’ve already been helping you identify the right balance between your willingness, ability, and need to tolerate risks. We’ve already been working with you to create your own investment plan, with your assets allocated accordingly. We’ve already been building and managing your evidence-based, globally diversified portfolio to capture the market’s long-term expected returns.

In other words, you’re not only already “doing something,” that “something” is expected to remain your best strategy for riding out any bad news to come.

  1. In the Face of Market Risks, We’ve Got Your Back

Now that investment risks are being realized, you may also be realizing your risk tolerance isn’t what you thought it would be. No shame, no blame. How could you have known in theory what your tolerances are for real? If you’re second-guessing yourself today, there are two possibilities:

You may be right. You may not be cut out financially and/or emotionally to withstand sustained risks to your investments. If this is the case, let’s revisit your plans, and talk about how to prudently adjust your risk exposures without sacrificing too many of your financial goals.

You may be wrong. It’s possible you are experiencing blind spot bias. That is, while we can often see when someone else is succumbing to an ill-advised behavior, such as fear or risk aversion, we often cannot see it when we’re experiencing it ourselves. Carlson addressed blind spot bias in his book. He pointed to research that has suggested, even once you know you have a blind spot, you still may not be able to overcome all the damaging biases you’re still not seeing.

That’s one of the primary reasons you’ve engaged us as your fiduciary financial advisor. If the breaking news is leaving you feeling strained to a breaking point, here’s one fast action we recommend: Please be in touch with us immediately. Together, we’ll take an objective look at your thoughts, hopes, and fears. Together, we’ll continue to chart a sensible course forward.

Come what may in the days to come, we’re here for you now.

“I’m not an optimist. That makes me sound naïve. I’m a very serious ‘possibilist.’ That’s something I made up. It means someone who neither hopes without reason, nor fears without reason, someone who constantly resists the overdramatic worldview.”

— Hans Rosling, Factfulness

Whether you’re considering an investment opportunity or simply browsing various media for insights and entertainment, it has become increasingly obvious: You cannot believe everything you see, hear, or read. Much of it is “overdramatic.” Too much of the rest is just plain wrong.

Thus it falls on each of us to be positively skeptical in our search for knowledge.

To be positively skeptical, we must continue to think and learn and grow.
But we also must aggressively avoid falling for hoaxes and hype.

Social Media: An Aggravating Allure

Of course, selling proverbial snake oil and falling for falsities is nothing new. As investors, citizens, and individuals, it will always be our task to remain informed purveyors of the truth. But in today’s climate of information overload, this is no easy task. The very features that make online engagement so popular also make it a powerful forum for sowing deceit and confusion.

First, it’s now all too easy to share a claim far and wide, long before it’s been through any sort of reality-check. One or two clicks, and it’s on its way.

Second, evidence suggests false online news spreads faster than the truth. In a March 2018 Science report, “The spread of true and false news online,” a team of MIT researchers analyzed approximately 4.5 million tweets from some 3 million people from 2006–2017. They found that “Falsehood diffused significantly farther, faster, deeper, and more broadly than the truth in all categories of information.”

The authors also found that “human behavior contributes more to the differential spread of falsity and truth than automated robots do.”

In other words, we can’t just blame it all on “the bots.” We owe it to ourselves to be vigilant.

A Rigorous, But Rewarding Role

The challenge is, few of us actually enjoy engaging in detailed fact-checking. That’s not entirely our fault. It’s likely due to a multitude of mental shortcuts, or “heuristics,” which we have honed over the millennia to make it through our busy days.

In their landmark 1974 paper, “Judgment under Uncertainty: Heuristics and Biases,” Nobel laureate Daniel Kahneman and the late Amos Tversky are widely credited for having launched the analysis of human heuristics, including when they are most likely to lead us astray.

Essentially, we’re more likely to share and comment on a social media post, than to take the time to substantiate its accuracy. When considering an enticing investment opportunity, we find it easier to skim the marketing materials, than to dig for deeper understanding. Academic research that refutes current assumptions can be dense, and difficult to decipher; if a particular assumption is already widespread, we’re prone to simply accept it as fact.

Unfortunately, there are legions of cunning con artists and slick sales staff who know all this, and have weaponized our behavioral biases against us.

This means it’s as important as ever to sharpen your skeptical lines of defense. Granted, it takes more time to carefully separate fact from fiction. But the upfront due diligence should ultimately save you far more time, money, and personal aggravation than it will ever cost you.

Being positively skeptical should richly reward you in the long run.

In this multipart series, we’ll explore how to strengthen your fact-checking skills. Join us next time, as we leap the hurdle of your own emotions in the quest to be positively skeptical about specious claims.

Each year large Wall Street firms post their expected returns for the next decade. A year ago, we saw the following forecasts:

*  Denotes a seven-year forecast

The biggest thing that stands out here is the poor performance expected by U.S. Equities. Despite 93 years of annualized returns in excess of 9.5%, the best research minds in the country were only forecasting an average of 3.4% for the ensuing 10 years. It is also interesting how much better they expect returns from non-U.S. stocks to be than from U.S. stocks.

Another thing to note is how far off last year’s realized returns are from the forecasted returns. For U.S. Stocks, an annualized 3.4% for a decade works out to a gain of 39.7%. If that were to be true, we got more than three-quarters of that gain just in the last year.

The following table shows the same companies and their expected returns for the next decade.

Relative to last year, it is interesting to see that U.S. Equities still have the same expected return, despite their great run in 2019. Expected returns from non-U.S. Stocks came down some but are still quite a bit higher than U.S. Stocks. One takeaway is that the U.S. economy and expected future earnings beat expectations last year by a greater margin than they did overseas. Still, overseas prospects are apparently brighter. Another interesting item is the expected return of U.S. bonds. The prediction fell from 3.2% to 1.9%, which is a function of interest rates falling. Currently, the U.S. Aggregate bond market is yielding 2.2%. To realize a 1.9% return off of a 2.2% yield means the underlying value of the bonds must be decreasing (interest rates are rising). The implied increase interest rates over the next decade would have to be towards the end of the decade and at least 0.50% for this to hold true.

We can think of a few takeaways from this information. First, despite the poor performance of international equities over the last decade, we believe it would be a mistake to reduce international equity allocation at this time. Second, markets are very hard to predict and years or even a decade can be short when it comes to markets and economic cycles.

A foolish investor last year would have seen an expected 3.4% return from U.S. Stocks and have been tempted to look elsewhere. If they had done that, they would have missed out on a 31% gain. We are again reminded that the most prudent thing is to stay diversified and stay invested while ensuring you are making all the correct decisions when it comes to saving and financial planning.

The following article by Ethan Gilbert was recently published on Jim Cramer’s website, “TheStreet”, in their retirement section. Ethan began being a guest contributor in 2019.

With recent headlines around the increasing national debt, our firm has had clients reach out to ask if they owned Treasuries and if the national debt is something that should worry them and their investments.

Most investors own U.S. government debt in some capacity. Whether it’s a pension, an insurance product, a mutual fund or ETF, savings bonds, or a Treasury note, government debt is everywhere. Part of the reason it’s so prevalent is because there is so much of it. Currently, the government owes $23 trillion and plans to add another trillion in 2020, making it the largest issuer of debt in the world.

Through the academic lens of investing, debt obligations of the U.S. government are assumed to be free of default risk as governments can print money. But through history we see that this does not always hold true.

Countries who let their debt get too large are forced to either print money or default. Neither is a good option, especially for investors. Could this happen to the U.S.?

It could, but it will likely be three or four decades until it reaches a tipping point, and even then, it’s not a guarantee. In the meantime, investors should feel safe buying Treasury bonds; safe in that they’ll receive their interest and principal, and safe that a buyer will exist should the investor want to sell them in the future.

First let’s look at the bad, our country’s fiscal health. The most relevant figure is debt as a percentage of the economy. Specifically, debt held by the public (excluding other government agencies). For the United States, that total is $17.1 trillion. The total size of the economy (gross domestic product, or GDP) is $21.7 trillion, putting public debt as a percentage of GDP at 79%.

This is high by historical standards, but not catastrophic. Countries that have defaulted tend to do so when debt as a percentage of GDP gets above 180%.

The credit rating agency, Moody’s, and the International Monetary Fund (IMF) each publish reports assessing developed countries’ “fiscal space” or how much additional debt they could incur before no longer being able to find buyers for their debt. Moody’s and the IMF each give a few numbers when assessing the U.S. In general, we are OK with debt up to 200% to 240% of GDP, but would struggle above that level. The U.S. is thought to have a relatively large fiscal ceiling because of our size and access to credit.

The reason for the multiple numbers is the uncertainty on interest rates and the cost of servicing the debt. Looking at data from 1962 to today, our debt is at an all-time high (79% versus an average of 41%). However, interest rates are low. The U.S. 5-year note is yielding 1.62% versus an average of 5.8%. Because of this, the cost of our debt as a percentage of GDP is close to average (1.85% versus 1.90%).

This cost has been rising in recent years as debt keeps increasing and the yield curve has risen. Were interest rates to return to their historical norm, the cost of the interest would become quite burdensome. Say with debt at 140% of GDP, and interest rates at 5%, the cost of the debt would be 7% of GDP. That’s more than a third of what our government raises each year through taxes.

Adding to the concern is the trajectory of our national debt. Since 1962, annual spending as a percentage of GDP has averaged 20.1%. In 2019, it will be 21.3%, by 2029 will rise to 22.5%, and by 2049 is expected to rise to 28.2%. Tax revenue will not keep up. Over the last 57 years, revenue has averaged 17.3% of GDP. This year it is expected to be 16.1%, by 2029 it is forecast to rise to 18.3%, and by 2049 will be 19.5%. In this scenario, debt held by the public would be 144% of GDP in 2049, and our annual interest expense would be 5.7%.

These projections come from the Congressional Budget Office’s (CBO) annual “Long-Term Budget Outlook” which was published in June 2019. These numbers are derived from a set of assumptions based on current law. Unfortunately, the situation worsened in August 2019 when congress passed the

Bipartisan Budget Act of 2019, which removed discretionary spending caps and didn’t offset those costs.

In anticipation of this, the Congressional Budget Office includes in their Long-Term Budget Outlook an Extended Alternative Fiscal Scenario, which tries to forecast elected officials’ propensity for increasing spending and reducing taxes. In this alternate scenario, come 2049 we have revenues of 17.6% of GDP and spending is 33.1% of GDP. Debt as a percent of GDP would be 219% and the annual interest component would be 9.4%. It’s hard to imagine this alternate situation would fully come to fruition but as recent history has taught us, forecasts under current law don’t seem to hold.

Estimating events 30 years away is guesswork at best, but it seems reasonable to think the United States would be reaching the point of insolvency in roughly 45 years, give or take a decade. A concern people have with budget issues is that waiting makes the future changes more difficult and abrupt. Like anything in life, if you plan ahead it’s easier. But Washington is doing the opposite, they are making the problem worse.

Still, there is good news for investors. The market doesn’t seem to mind our fiscal issues and markets are ruthless. When other countries have fallen out of favor with investors, buyers don’t exist, yields skyrocket, and countries are forced to print money or default. Nothing close to that has shown itself regarding Treasuries, instead the opposite has happened.

On Aug. 2, 2019, the Bipartisan Budget Bill was passed into law. It eliminated the 2011 sequestration on discretionary spending and raised the baseline for future discretionary spending. The market didn’t blink at this additional $1.7 trillion in spending over the next decade. Rather, within a month, interest rates on U.S. government debt declined to near record, or record levels, depending on the term. The U.S. 30-year, our longest-dated bond that in theory carries the most default risk, closed at a record low of 1.94% on Aug. 28. The market is clear, it doesn’t much care about America’s fiscal challenges.

This phenomenon of low interest rates is seen around the world. In August 2019, $17 trillion in global debt was yielding negative interest rates, and only $200 billion of that was in the United States. At the time this prompted investors to wonder why America’s government debt couldn’t get to negative yields. Negative yields are more a result of supply and demand than fundamentals. There is a lot of wealth in the world, and for those with a strong aversion to risk, owning negative yielding debt is a necessity.

The U.S. dollar is the reserve currency of the world. All types of institutions, companies, and people come across dollars and need to hold them for a period of time. Those who want a guarantee that their dollars will be returned purchase treasuries. This, along with other factors, should perpetuate strong demand for treasuries into the foreseeable future.

The situation in Japan may also relieve anxiety over the U.S. debt. Japanese debt currently stands at 238% and has been above 200% since 2009. Despite this high level of debt, over half of the outstanding debt trades with a negative interest rate. Factors supporting Japan’s yields are that the country is currently running close to a balanced budget and over 90% of the country’s debt is held within Japan.

America relies on foreigners for a larger share of Treasury ownership, about 30%. The following is a breakdown of America’s nearly $23 trillion in debt.

  1. $6.8 trillion – Foreign holders (Japan at $1.2 trillion & China at $1.1 trillion)
  2. $6.0 trillion – other U.S. government agencies (Social Security, Military Retirement, FERS)
  3. $2.6 trillion – Pension funds
  4. $2.3 trillion – Federal Reserve
  5. $5.3 trillion – All other U.S. investors (U.S. based mutual funds and ETFs, state and local governments, banks, insurance companies, U.S. Savings Bonds, private investors)

While we don’t have the same type of domestic demand that Japan enjoys, America does have a diverse form of debt owners reinforcing the argument that we have good access to credit.

Even if projections come to fruition in 40 years, the market may treat U.S. debt more like Japan than Argentina. Though we’d probably struggle to reach a balanced budget at that point.

When asked to identify the greatest threat to our national security, former admiral and chairman of the Joint Chiefs of Staff, Michael Mullen, and former Defense Secretary James Mattis have both cited the national debt rather than a foreign government or terrorist organization.

I agree, I think America’s national debt is the greatest threat to the world’s long-term prosperity outside of nuclear war (you could also argue a climate-induced catastrophe).

But from an investor’s standpoint there is no reason to be concerned about the national debt or holding Treasury bonds in the foreseeable future.

Often, all you need to be an excellent investor is a healthy dose of common sense: A penny saved is a penny earned. Buy low, sell high. Don’t put all your eggs in one basket.

That said, the best way to achieve these simple goals isn’t always as obvious. In fact, many of our favorite investment insights may at first seem counterintuitive. Today, we cover a trio of weird, but wonderful “upside-down” investment ideas.

Investment Insight #1: Market volatility is the norm, not the exception.

How often have you thought something like this: “The markets seem so crazy right now. Maybe I should back away, or at least wait until things settle down before I make my next move.”

The problem is, the markets rarely “settle down.” And when they do, we only realize it in hindsight. There are just too many daily seeds of doubt, forever being sown by late-breaking news. We never know which ones might germinate – until they do, or don’t.

We suggest putting market volatility in proper context.

“Being surprised at equities’ ups and downs is like visiting Chicago in January and being shocked by 8 inches of snowfall.” — William Bernstein

In other words, it’s normal for markets to swing seasonally. It’s just part of the weather. For example, in Dimensional Fund Advisors’ commentary, “Recent Market Volatility,” we see U.S. stock markets ultimately delivered positive annual returns in 33 of the 40 years between 1979–2018. But during the same period, investors had to tolerate average intra-year declines of 14%.

Investment Insight #2: Market volatility is your frenemy.

What if markets weren’t volatile? What if all the days, in every market, were like November 12, 2019, when the Dow closed at the same 27,691.49 price as the day before?

If prices never changed, traders would become unwilling to trade; they’d have no incentive to do so. In this extreme, markets would no longer be able to serve as a place where buyers and sellers came together and agreed to price changes. Soon enough, markets would cease to exist.

What if there were just far less market volatility? You would probably soon discover how much you missed those same, downward price swings you ordinarily loathe. That’s because, long-standing evidence has informed us: By giving up extra volatility, you also must give up the extra returns you can expect to earn by tolerating the volatility risk to begin with.

“If you’re living in fear of the next downturn, consider shifting your thinking instead of your investments. Focus on controlling what you can control, such as how much you save, or finding the right stock/bond mix.” — David Booth

Investment Insight #3: You can win for losing.

Wouldn’t it be great to hold only top selections in your investment portfolio, with no disappointments to detract from your success?

Of course it would. It would also be nice to hold a $100 million winning lottery ticket. But just as the lottery is no place to invest your life’s savings, neither is speculating on the razor-thin odds that you can consistently handpick which stars are next in line to shine.

Instead, we suggest building a broadly diversified portfolio covering a range of asset classes … and sticking with it over time.

By always being already invested wherever the next big run is about to occur, you’re best positioned to earn market returns according to your risk tolerance. At the same time, spreading yourself across multiple asset classes also means you’ll always be invested somewhere that isn’t doing quite as well. This means you’re unlikely to ever “beat the market” in a big, splashy way.

Here’s a helpful way to think about committing to a mixed-bag (diversified) portfolio:

On a scale of 1-10, with 10 being abject misery, I’m willing to bet your unhappiness with a diversified portfolio comes in at about a 5, maybe a 6. But your unhappiness if you guess wrong on your one and only investment for the year? That goes to 11. — Carl Richards

Obvious in Hindsight?

We hope the insights we’ve shared now seem a little more obvious. We also hope you’ll be in touch if we can help you incorporate or sustain these three upside-down ideas within your own portfolio management. Because …

“‘[O]bvious’ is often a long way from ‘really believed and internalized’ and in the gap between those two fortunes are made and lost.” — Cliff Asness


Stock Markets

Stocks were up nicely this quarter except for Real Estate Investment Trusts (REIT) which is quite a turnaround from last year’s fourth quarter. The one-year numbers including REITs, are well above what it is reasonable to expect over the long run but are necessary from time to time to make up for the down markets we will endure going forward. Overall it has been a good year for stocks.

Domestic markets, especially large cap stocks (S&P 500), have outpaced both international and emerging markets over longer periods. Because many consider the S&P 500 as the “stock” market, looking backward makes it easy to focus only on allocations to this index. Investment decisions are made by looking ahead where global diversification is expected to payoff.

Bond Markets

A yield is what you earn by holding a bond to its maturity. Changes in yields drive returns – falling yields are positive; rising yields negative. The longer a bond’s maturity the greater the impact a given change will have on prices and returns.

Financial Common Sense

Note, to the graph above that bond yields at the longer end ticked up but fell at the shorter end producing negative returns for longer maturing bonds and positive returns for short-term bonds. This twisting of the yield curve brought the pattern of yields across several maturities although low by historical standards back to its more “normal” upward sloping shape.

Impeachment

There is a lot of noise about a coming recession. While the numbers still look reasonable, the tools to respond may not be as potent this time around. The hue and cry for the Fed to reduce interest rates notwithstanding, with rates at historically low levels and massive Treasury securities on the Fed’s balance sheet there is not much room for monetary policy to make a difference. As far as fiscal policy is concerned, the Government is already running substantial deficits due to the recent tax cut. The positive impact may be behind us and with today’s political dysfunction the opportunity to do more with fiscal policy may not be available. With the large tax cuts in place and an accommodative Fed, we have enjoyed a nice ten- years that may be difficult to repeat.

A Twenty-Year Perspective

It’s been a good year, but let’s put it in perspective by looking at some history. The past twenty years produced an average 7% return from global equity markets amid significant ups and downs. Probably a reasonable long-term expectation. This year’s 24% return was well-above this average. Over this period, we had to endure some significant down years, including a three-year run of double-digit losses at the beginning. Seeking to avoid the pain of a fourth loss would mean missing the dramatic up market of the following year. Then after a few years of up markets, we went through the gut-wrenching drop of over 40% in 2008. This year’s results are not necessarily extraordinary in view of the ups and downs of the past twenty years – it’s how equity markets work. Seeking to avoid this variability is apt to mean missing out on years like this one. The past twenty years is reasonably representative of how equity markets behave over extended periods. Don’t pay any attention to the myriad of predictions that are typical for this time of year–they’re usually wrong. Focus instead on the appropriate tolerance for variability whilst expecting commensurate returns over the long run.

Every six months, Morningstar releases their “Active/Passive Barometer.” We feel Morningstar is a good source of data as they tend to be unbiased. While Vanguard or Dimensional Fund Advisors will always tell you passive is better, and active fund managers will always mine data that trumpets the benefits of active management, Morningstar is close to neutral.

Each day Morningstar runs articles giving positive reviews to active managers but also articles on the shift in the industry out of active management into passive funds. Investment managers who select funds pay to use their star system and see reviews of fund management in determining which active funds to select. We believe Morningstar is a good source of objective analysis (if anything would support active management) when it comes to analyzing active vs. passive performance.

As seen below, Morningstar’s research shows that paying for active management is a bad bet for investors. The following table notes what percent of active management has beaten comparable passive funds over a given time period. The data was compiled as of June 30, 2019.

The data is clear, active management has a low success rate. Of the 101 numbers in that chart, 82 of them are below 50%. It’s also important to note the longer the time period, in general the less likely it is for active management to outperform a passive fund.

There does seems to be one anomaly and one exception to the rule. The 10-Yr Foreign Small-Mid Blend number is very positive. Active managers in that space will say the market is less efficient so there is more opportunity for a manager to add value. Perhaps there is truth to that, but then it doesn’t explain the dismal performance over the last 1, 3, and 5 years. Looking through Morningstar’s data, this category is very small. Only 17 active funds and 7 passive funds were around 10-years ago (compared to 451 & 122 in US Large Blend). We’re dealing with a small sample size, five to ten years ago, and the passive funds likely were relatively poorly managed and expensive compared to what is available today.

The corporate bond space is an exception to the rule, though it can be explained. Overtime, more credit risk (higher yielding, riskier bonds) should outperform higher credit quality bonds. And with normal sloping yield curves, longer duration bonds should outperform shorter duration bonds. If you wanted to manage a corporate bond fund and outperform your index, or a passive fund tracking an index, you should tilt your holdings to higher-yielding, longer bonds. For the last 10 years, companies have fared well and interest rates have fallen, both helping the tilts of active bond managers. We see this manifest itself in the 3, 5, and 10-year performance. In the second half of 2018 when stocks did poorly active managers got beat handedly by passive funds as credit exposure was a negative. Going forward we expect active corporate bond managers to outperform, but they are taking on a different risk profile. As comprehensive financial planners, we aren’t interested just in your bond holdings, but rather the performance of your entire portfolio. We look to manage the duration of a bond portfolio and credit quality as it relates to entire holdings, including your stock positions. Because of this, we believe passive funds still provide the best exposure for investors in that segment of the market.

In summary, data continues to support passive funds outperforming active funds across multiple asset classes and over most periods of time. This has persisted for many years and we expect it to continue into the future. On the whole, active fund outperformance is mathematically impossible as they charge more, and the sum of active management is the market as a whole. There also hasn’t been a model yet that can consistently identify active managers who will soon outperform. It seems the only group sure to benefit from active management is the fund managers who charge the high fees.

Trying to time the market is nearly impossible; there is no way to predict when the market is going to perform well and above what we expect it to. However, by buying and holding a low-cost, globally diversified portfolio, we know that we will not miss out on the returns of the top performing days in the market. Take the hypothetical situation below from our friends at Dimensional Fund Advisors which shows how the impact of missing just a few of the market’s best days can be profound.

A hypothetical $1,000 in the S&P 500 turns into $138,908 from 1970 through the end of August 2019. Miss the S&P 500’s five best days and that’s $90,171. Miss the 25 best days and the return dwindles to $32,763. There’s no proven way to time the market—targeting the best days or moving to the sidelines to avoid the worst—so history argues for staying put through good times and bad. Investing for the long term helps to ensure that you’re in the position to capture what the market has to offer.


Source: Dimensional Fund Advisors

In the last year, interest rates have fallen dramatically. At the end of the 3rd quarter in 2018, the yield on a 10-year note from the U.S. Government was 3.05% and today it stands at 1.68%. This decline in interest rates is unusual, but not unprecedented. Given the vast resources of the world’s largest money managers, banks, insurance companies, and universities, surely someone saw this coming.

By and large no one did, and, unless we see a rise in yields in the fourth quarter, no one will be very close. The data above comes from the Wall Street Journal Economic Forecasting Survey. Each month, the WSJ surveys over 50 economists on a wide variety of things, one of which is what they expect the U.S. 10-year Treasury bond will be yielding at a future date. The chart shows what each economist predicted, versus what actually happened.

The difficulty in forecasting rates is well shown by looking at yields at the end of June. Nine months prior, the world’s leading economists’ predictions ranged from 2.75% to 3.94% with an average of 3.40% and a standard deviation of 0.28%. The actual yield on June 30th was 2.00% or 5 standard deviations below expectations. A 5 standard deviation variance should happen 1 out of every 3.5 million times, or effectively never, when events are normally distributed. This reinforces what we already knew:  markets aren’t normal, and people can’t predict them.

As we’ve seen here with interest rates, it is very difficult to time markets, getting in or out at the right time to take advantage of the market’s next move. Smart and highly compensated people who work on large teams with unrivaled access to data spend all day trying to forecast the market. And still, they are wrong as often as they are right.

The best-case scenario for average investors trying to time the market is that it will insert an element of chance into their financial lives. For those willing to accept a materially less comfortable retirement for the chance at having a relatively lavish retirement, market timing may make sense. But that is not most people, and the universe of investors who try to time the market on average underperform for the following reasons:

  1. Excessive Costs: Market timing requires buying and selling positions which comes at a cost. Every time you transact a security you cross a bid/ask spread and some securities come with a fee to trade. While small individually, when done repeatedly these little costs add up. Some use options to time the market. Options are a terrible investment over the long run. Options trading is like playing in the poker room at a casino. With every bet you make, there is someone else on the other side. The only one sure to profit is the house.
  2. Holding Cash: Most who try to beat the market end up holding an unnecessarily large amount of cash for extended periods of time. As cash is a poor long-term investment, this generally reduces returns.
  3. Poor Decisions: Theoretically, every future movement in the market is random, securities are efficiently priced, and investors should not be able to pick winners or losers. Still, there is data that shows the average investor who trades frequently has an uncanny knack of buying high and selling low. The psychology of investing is difficult for anyone to master and frequently instincts work against investors.

The markets future movements are unknown, even to “experts.” Timing the market or picking stocks will usually hurt your wallet, not to mention the mental stress that comes with it. Having a long-term strategy and sticking with it is the best way to build wealth in the long run and to position yourself for an enjoyable retirement.

Stock Markets

It was generally an off quarter for stocks, except for Real Estate Investment Trusts (REITs). The year-to-date numbers look good. Recent periods show variability among individual markets as well as within various time periods – REITs continue to do well, no doubt reflecting declining interest rates. One theme running throughout the past ten years’ stock returns is the better-than-average numbers for domestic stocks versus international stocks.  While this behavior is clear by looking back, investment decisions are made by looking ahead.  Markets have no memory so we can’t bank on superior results from domestic markets continuing.

Another theme in these ten-year numbers is that the domestic large-cap market (S&P 500) returns consistently exceeded those of other benchmarks. Expected earnings and growth drive stock returns, and any surprises that alter these expectations produce volatility.  S&P 500 stocks are well-followed by analysts; there is no reason to think that they will consistently provide positive surprises.  So, what’s going on?  It may be simply that S&P 500 stocks are the default investment when investors desire more risk in the face of anemic returns in other markets.  These results are by and large unrelated to company earnings and investments opportunities – suggesting a “passive management bubble”.  If that explains some of what is happening, then the relative results in this market won’t go on forever.

We know that maintaining a globally diversified stock portfolio has the best chance for long-term success.  However, because domestic markets, especially the S&P 500, are so popular and familiar, it has been especially difficult for investors to maintain strategic commitments among several other markets this time around.

Bond Markets

A yield is what you earn by holding a bond to its maturity. Changes in yields drive returns – falling yields are positive; rising yields negative.  The longer a bond’s maturity, the greater the impact a given change will have on prices and returns. 

The Yield Curve is a picture of how these yields vary across several bond maturities.  Shown to the right are U.S. Treasury securities a year ago (September 2018), at the end of last quarter (June 2019) and today.  Not only can changes help us better understand bond returns, they can also be useful predictors of the direction of interest rates.  The sharp fall-off over the past year means positive bond returns, especially at the longer end – the long-term Treasury benchmark (7-10 yrs.) earned nearly 10% while the short-term benchmark (1-3 yrs. Treasury) earned only 3%. Bond returns were positive over the past quarter reflecting the downward shift in the Yield Curve.

Last year’s curve is typical; the more or less “flat” curve we see today is not.  However, it is consistent with expected lower rates in the future.  The story behind this prediction is that the Fed will continue to reduce rates to fight the upcoming economic decline. However, while there is some indication of a slowdown, neither the stock market, nor labor markets (where unemployment is at historical lows) seem to anticipate much of a slowdown.  The recent cut in interest rates is more in response to political pressure – at these levels the effect of any decrease will be mostly perception.

Recessions and the Tools to Respond

There is a lot of noise about a coming recession.  While the numbers still look reasonable, the tools to respond may not be as potent this time around. The hue and cry for the Fed to reduce interest rates notwithstanding, and with rates at historically low levels and massive Treasury securities on the Fed’s balance sheet, there is not much room for monetary policy to make a difference. As far as fiscal policy is concerned, the Government is already running substantial deficits due to the recent tax cut.  The positive impact may be behind us and with today’s political dysfunction, the opportunity to do more with fiscal policy may not be available.   A lot of uncertainty – little wonder the stock market is volatile.  With the large tax cuts in place and an accommodative Fed, we have enjoyed a nice ten years that may be difficult to repeat.

The word “recession” makes investors feel uneasy and with good reason; the correlation between a bear market and an economic recession is very high. For anyone with money in the stock market, especially those nearing retirement, this can be scary. The “r” word has been making headlines in recent months as investors worry about trade wars, the yield curve inverting, and drops in manufacturing activity. In this piece, we’ll unpack what a recession is, what it means for markets, and what can be done to protect a portfolio against one.

A recession is defined as a period of two consecutive quarters where economic activity declines on an inflation-adjusted basis. The main cause of this is economic activity decreasing; however high inflation and population growth can play a factor as well. For example, Japan has had three recessions in the last 10 years as their population has shrunk by 1.52%.

In the United States, economic activity is measured by the Bureau of Economic Analysis’ calculation of Gross Domestic Product (GDP). This measure takes three months to publish and is then revised each of the next two months before we are given a final reading. Because of the definition and the time it takes to report, we don’t know we’re in a recession until 9 months after it is upon us.

Regarding impact, we analyzed the six recessions we’ve seen over the last 50 years.

For example, in November 1973, a 16-month recession began in the United States which saw GDP shrink by 3.2%. The stock market peaked 11 months prior to the start of the recession (December 1972). It took 21 months to bottom out with a loss of 45.6%. During that time international stocks dropped 29% and five-year government bonds rose 4.5%. Fourteen months after the bottom, a balanced portfolio recovered all it had lost.

A recession’s impact on the market varies. Sometimes the impact is small (the drop we had in Q4 of last year was worse than the market’s reaction in three of the recessions) and other times it is very large. The thing that struck our team was how quickly a balanced portfolio recovers from a recession. A 60% stock portfolio that is diversified among international stocks, and is rebalanced quarterly, recovered on average 9 months after the market bottom. When you’re living through the drop, it can feel like a long time, but for investors whose money has a 30+ year investing horizon, it isn’t that long.

Another thing to remember is we don’t know when/if the next recession is coming. The Wall Street Journal Survey of Economists puts the odds of a recession in 2020 at less than 50%. Australia has gone 28 years since their last recession.

While there is no such thing as an average recession, let’s play one out. Say we begin a recession in January of 2020. We won’t know it’s a recession until next September. The market will have peaked this past July and will drop 31% before bottoming in October of 2020. A diversified 60/40 portfolio will decline 13.3% and recover those losses by July of 2021. Again, it’s not fun, but it’s not the end of the world.

And to reiterate, we don’t know when or if this will happen. We’d bet a lot of money a recession won’t start in January of 2020, not because we think we know what the economy will do, but because it’s a low probability event. In the 48 hours we took to research and write this piece, we’ve had a bit of good data and positive news from trade negotiations. The market is up 2.7% over that time and the headlines talking about a recession have vanished. That could easily change; the only point is that no one knows, and headlines are fickle and sensational.

If the fear of a recession is keeping you up at night, it’s a good idea to reach out to your advisor and discuss your asset allocation. A financial planning best practice is to periodically make sure you’re appropriately allocated for your long-term goals and individual risk tolerance. But alterations that are “short-term” by nature or “tactical” are usually mistakes. As Peter Lynch (one of the most successful investors of all time) once said, “Far more money has been lost by investors preparing for corrections, or trying to anticipate corrections, than has been lost in corrections themselves.” Our job as your fee-only fiduciary advisor is to make sure you don’t prove Peter Lynch right.

Most people think of bonds like Certificates of Deposit (CDs). You loan someone money, they give you interest each year, and then at the end of the contract you get back the full amount you initially lent. Over that time, your return should be whatever the interest rate was and if you think of it from a cash flow perspective, at any point during that period your return should also be that (positive) interest rate.

But in reality, bonds can lose value over shorter periods of time, even if they don’t default. Last fall, we published a piece discussing this phenomenon. At that time, we had many clients reaching out with well-founded concerns that their bonds were losing money. Since then, bonds have gone up in value as interest rates have fallen. We haven’t yet had any concerned clients asking why their bonds have made so much money in the last 12 months, but we figure calls will soon be coming (haha). As your favorite Syracuse based fee-only fiduciary advisor, we wanted to revisit the issue to help explain it again.

Let’s say an investor bought a $1,000 face value, five-year bond that paid 2.0% for $1,000 (par) when it was issued. A year later, the investor has received $20 in interest payments and now owns a four-year bond. But market conditions have changed, and new four-year bonds are being issued with a yield of 3%. If the investor wanted to sell the bond he or she bought last year, other investors wouldn’t pay full price for something that will give them 2% when they can get 3% out in the market. As a result, the original investor would have to sell his bond at a discount. In this case, the investor would probably only be able to get about $960 for this bond. This combined with the $20 in interest leaves the investor with $980 in proceeds on something that cost $1,000. This works out to a loss of 2%.

Over the last year the opposite has happened. Interest rates have fallen and the returns on bonds have exceeded their yield.

To complicate things further, most of our investors don’t own individual bonds, but rather bond funds. These funds own thousands of individual bonds and are constantly buying newer, longer dated bonds with the proceeds from maturing bonds. Through this process, the bond fund never matures and maintains a somewhat steady duration.

The most common fund our investors own is one which tracks the Bloomberg Barclays Aggregate Bond Market. The following table shows a first cut at how this fund has performed over the last year.

The decline in interest rates of 1.02% would lead to an estimated 6.12% increase in the mark to market value of the bonds it is holding. Over the last year it has also earned an estimated 2.58% in interest for a total return of 8.7%.

In reality, aggregate bond funds are up roughly 11%. The reason for the difference in this and the 8.7% we calculated above is two-fold.

  1. The majority of the decline in interest rates is from longer-dated bonds which appreciate more when rates fall. For example, a year ago the 1-month treasury yield was 2.11% and today it’s 2.05% – almost no change. However, the 10-year yield was 3.06% and today it’s 1.55% – essentially half of what it was a year ago! This different change in yields of different maturities has caused funds to appreciate more than you’d expect from their change in interest rates.
  2. The second and less impactful factor is that interest rates haven’t fallen in a straight line over the last 12 months. Interest rates peaked in November and still stayed relatively high until about May of this year. More time with higher interest rates means the interest earned over the last 12 months will be higher than our 2.71% estimate from the average.

The last 12 months has been great for bonds. Unfortunately, it’s nearly certain the next year, or five years, won’t be as good. Still, bonds add value to a portfolio by reducing volatility and earning a positive return over time. If you have any concerns regarding your bond holdings and how they impact your financial plan, please contact your advisor. It may be tempting to alter your investments based on future predictions of interest rates, but history has shown this to be difficult. Look for an article in our next newsletter documenting how poorly expert predictions were a year ago.

Stock Markets

Stocks rebounded nicely. Tech stocks (FANGs – Facebook, Amazon, Netflix, Google) after leading the way down in last year’s fourth quarter (off 22%) led stocks back up (up 23%). A global stock portfolio earned about 12% this quarter and domestic stocks continued in the forefront.

Looking past this quarter, non-domestic markets have fallen short of domestic market returns.  There is no reason to think this pattern will continue. Stock markets seemed to have calmed a bit, and some of the uncertainties that have plagued stocks in the recent past seem to be coming into sharper focus.  Trade negotiations with China are moving along in a more positive vein and stocks continue to respond nicely to positive news about any possible resolution.

Concerns of looming deficits due to tax cuts appear to have moved to the back burner as inflation and interest rates remain at historically low levels. Markets continue to shrug off any dysfunction in Washington.  Yet, concerns remain. How Brexit (Britain leaving the European Union) eventually plays out remains a mystery.

Bond Markets

Bonds, especially longer-term bonds, are up this month, which is consistent with declining yields, at longer maturities.  Look below to see how bond yields beyond a year are below last quarter and a year ago.  The ten-year yields are below one-month yields – the lowest is at the 5-year mark. This pattern is unusual. Perhaps the best explanation is as simple as this: in a world of low and negative interest rates, U.S. Treasuries are the “best deal in town” for safe assets.

Interest Rates

Interest rates are historically low and have confounded many observers – more than a few predictions have gone awry, and crafting a compelling story to explain why there is little difference between short-term and long-term rates remains elusive.  Additionally, by historical standards the Fed has massive levels of Treasuries and Mortgage-backed securities on its balance sheet, which it must deal with, creating even more uncertainty.

Interest rates are important to the economic landscape. They are the price of capital – interest is what must be paid to use someone else’s money. The Fed only controls short-term rates.  Longer-term rates are where supply and demand for capital intersect. Demand depends on the expected payoff for putting capital to work; supply depends on what you expect to earn for giving up the use of your money. The horizon for suppliers and users of capital is distant – slight changes in interest rate’s can have a significant effect.

Stock prices are the present value of all future cash flows, which theoretically go on forever.  Falling interest rates translates into rising values of these cash flows.  The historically low levels and generally downward trend in interest rates help to explain the long-running bull market.

Bond returns are affected by both absolute levels and changes in interest rates – rising rates produce lower bond prices and returns; falling interest rates work in the opposite direction.  The longer the maturity, the greater the impact of changing rates.  Declining yields at the long end mean better returns for longer-maturing bonds.

Where interest rates go from here is anybody’s guess.  However, right now there doesn’t seem to be much pushing rates up, especially with an expected slowdown in worldwide growth.  All indications are for rates to remain low with little difference between short and long rates for a while.

Jack Bogle

Jack Bogle, the godfather of index funds and founder of Vanguard, passed away in January at age 89.  His influence on the investment world over the past forty years is immense; his accolades are well-deserved. Jack Bogle’s unwavering commitment in his ideas alone set him apart.  While the underlying concepts behind index funds are now the mainstream, they surely weren’t when he first championed them.  Jack Bogle clearly did more than anyone for small investors.  The notion behind Index Funds (achieving market results at the lowest cost to have the best chance for long-term success) is equally applicable to all investors – both large and small.

Congratulations! You are officially married and get to enjoy all the financial benefits that come along with it. After you’ve had some time to relax after the big day, be sure to consider the following.

  • Beneficiary Designations – Update beneficiary designations on any life insurance, retirement accounts, etc., to name your spouse as primary beneficiary.
  • Income Tax Withholding – Review the amount you are withholding from your paycheck. You may want to make an adjustment if you plan on filing a joint tax return in 2019. Remember you can file a joint return if you are married by the last day of the calendar year.
  • Review the benefits you are receiving, or are eligible to receive from your employer.
    • Health Insurance – If only one spouse is working, make sure both of you are covered under your company plan. Most companies only allow their employees to change their insurance elections once a year during their “open enrollment” period. However, exceptions are permitted for certain qualifying life events, which typically include marriage. If you are both working, it may be less expensive to pay for a plan that includes a spouse at one employer rather than paying for two single plans. One of you could even have better coverage than the other. It is in your best interest to review all the options available to you.
    • Life/Disability Insurance – You may have declined life insurance or disability insurance coverage when you were single. Now that there is someone else in the picture, you will want to review your options. Even if you are covered by an employer plan, you may want to purchase additional term life insurance coverage which would help to cover any joint debt and provide income replacement for the surviving spouse.
  • IRA Contributions – Getting married can affect your ability to save in certain retirement accounts, such as Roth IRAs. Roth IRAs allow you to save up-to the lessor of $6,000/year ($7,000/year if you are 50 or older), or the amount of income you, and or, your spouse earns in 2019. Contributions are made with after-tax money, and investment earnings and gains are not taxed when distributed (unlike with traditional IRAs). Getting married can affect your ability to save in these types of accounts in the following ways:
    • Individuals can contribute to a Roth IRA for their spouse as long they file a joint tax return. This allows a spouse who may have not been able, or eligible, to contribute to a Roth before getting married, to benefit from the favorable tax treatment of saving in Roth accounts.
    • The ability to contribute to a Roth is reduced when a taxpayer’s adjusted gross income (AGI) reached certain levels for the year. In 2019, someone filing an individual tax return is forced to reduce the amount they can contribute to a Roth once their AGI reaches $122,000, and is no longer eligible to make contributions once their AGI reaches $137,000. These amounts increase to $193,000 and $203,000 respectively, for married couples filing jointly. Therefore, someone who makes over $137,000, but less than $193,000 on a joint return, can now make Roth IRA contributions for both themselves and their spouse.
    • There are similar opportunities with regards to traditional IRA contributions. However, because most people are covered by an employer retirement plan, these contribution strategies can be more complex.

While the points above illustrate many of the common planning items that are relevant to newly married couples, each piece is only one part of a comprehensive financial plan. Please contact your Rockbridge advisor with any questions! Keep checking back for more articles as part of the “Life Events” series.

Stocks for this quarter maintained the above-average trend in the year-to-date numbers.  The primary market drivers are the Fed activities and the status of tariff discussions with China and Mexico.  As the prospects for reduced interest rates and resolution of the tariff negotiations wax and wane, stocks move up and down.

The graph below shows returns in several equity markets for various periods ending in June.  A few things stand out:  (1) domestic markets have done better than non-domestic markets; (2) there are significant differences among the various markets and; (3) while volatile, it was a reasonably good period for stocks.  Keep in mind that ten years is a short period and that markets have no short-term memory – what we see here may not be indicative of what the next ten years hold.  Consequently, the need for diversification.

Bond Markets

The yield curves below show what’s earned over several periods from holding U.S. Treasury securities to maturity.  These curves are sometimes indicative of the future direction of interest rates – upward sloping is consistent with a reward for taking interest rate risk and increasing rates; flat and downward sloping for decreasing rates. Note the parallel shift downward over the past quarter – positive for bond returns.  The typical yield curve slopes upward – greater return for longer maturities.  Note the June and March yield curves do not follow this pattern.  Look at the uptick in short-term yields and decline in yields for longer maturities over the past year – positive for long-term bonds, negative for short-term.

Diversification

Diversification can bring short-term uncertainty, but unless you can predict the future consistently, it is still the best strategy for the long run. Holding a diversified portfolio means in most periods, there will be at least one market we wished we avoided.  Recently, value stock returns are well under those in other markets. Yet, to realize the long-run benefits of diversification, we must deal with this short-term regret and uncertainty. There is evidence that over the long run, markets tend to move towards averages – periods of above-average returns are followed by periods of below-average returns.

International Trade

Markets move as the prospects for tariff negotiations wax and wane.  International trade ties world economies together – it’s fundamental to the workings of today’s global economy. Through time the world changes and comparative advantages shift.  International trade continuously affects various industries differently.  Recent volatility in stocks is consistent with ongoing trade negotiations with China and now Mexico.  As the specter of increasing tariffs becomes an issue, markets tend to fall when first introduced, then rise with anticipated resolution. These ups and downs are something we must live with today.

Capital Markets and the Fed

All eyes are on the Fed and the prospect for reduced interest rates.  While this noise is apt to be positive for stocks in the short run, it is hard to put together a compelling story for the longer term.  First, the Fed can only directly affect short-term rates.   Second, there is not much room for rates to fall from today’s historically low levels.  Third, Fed actions only impact long-term rates and borrowing costs to the extent they change market expectations. Finally, the reason for a rate cut is an economic slowdown – generally not positive for stocks.

Stock prices are the present value of expected future cash flows, and so move in sync with an increase’s or decrease’s in expected cash flows and move inversely with interest rates.  For reduced interest rates due to an economic slowdown, the positive impact of falling interest rates would offset the negative effect on expected cash flows.  It appears the market is making that tradeoff today.

The impact the Fed has on the bond market is mostly perception.  It can only affect short-term rates.  A bond’s yield (the amount it will earn if held to maturity) depends to an important extent on expected inflation.  Changes in these yields, which affect periodic returns, follow changes in expected inflation.  This is where the Fed and bond returns come full circle – the Fed watches expected inflation and signals its views by adjusting short-term rates. While it is comforting to have explanations for short-term market behaviour, often it is random noise. This time around the explanation seems to be an anticipated reduction in interest rates by the Fed.

For nearly all investors, the importance of asset allocation and security diversification cannot be overlooked. Diversification can mean different things to investors, but the concept is pretty well understood – hold several different types of investments and you will be better served than those who are concentrated in one stock or in one narrow investment strategy.

I would like to introduce the topic of “tax diversification” here – since it’s not a phrase that is generally understood or discussed among a large percentage of investors and retirees.  The type of account you are eligible to open and maintain will determine how and when the funds are taxed.

For example, whether a withdrawal from your account will affect your taxable income, and ultimately how much you pay in federal and state income taxes depends on the type of account.

Account types generally fall in one of three categories: Tax-Deferred, Tax-Free and Taxable.

  • Tax-Deferred: Funds held in Traditional IRAs, a 401k, 403b, pensions or profit-sharing plans are tax-deferred. Contributions to an employer’s sponsored plan are made on a pre-tax basis before wages are taxed (such as with a 401k or 403b or 457 plan). Most insurance annuities are tax-deferred – gains are taxable when you or a beneficiary receives a withdrawal. In the case of a Traditional IRA, contributions are normally made on a pre-tax basis. Contributions are allowed but complicate the future reporting that is required to avoid paying tax again.
  • Tax-Free: Funds held in Roth IRA’s are tax-free. Contributions to the account are after-tax, but there is no tax charged on earnings or normal distributions. Additionally, certain types of municipal bonds produce tax-free income and may not have to be reported as income on either your state or federal return – or both.
  • Taxable: A typical Brokerage account is taxable. The dividends, interest, capital gains or capital losses are reported to the taxpayer at the end of each year and you will have to pay tax on any income or realized gains. A withdrawal from this type of account are not a taxable event, because tax is paid on the income each year.

When in retirement, there may be compelling reasons to accelerate or delay tax-deferred distributions or rely on those that are deemed tax-free. Rather than simply withdrawing from only one account type, it may make sense to rely on two or even three of those category-types in later years, depending on personal circumstances.  We generally advise our clients, when appropriate and advantageous, to have and maintain a combination of accounts that are “tax-diversified” to maximize the efficiency of distributions, and the favorable tax treatment given to long-term capital gains, dividends and capital losses.  Certain account types are better suited for gifting to individuals or charities during life, while others can more effectively meet philanthropic goals upon death and avoid income tax.

As with many facets of financial planning, there is rarely an absolute right or wrong method, but rather, a better method for distributions, gifts and asset classes held in certain account types. If you believe you stand to benefit from being more “tax-diversified” with your account types, please contact your Rockbridge advisor for a more detailed discussion of this topic.

The financial crisis of 2008 put the financial services industry under significant scrutiny. While the biggest headline grabbers were overleveraged investment banks and practices around mortgage origination, retail investment services also underwent additional regulatory oversight. Specifically, Section 913 of the Dodd-Frank Wall Street Reform and Consumer Protection Act directed the Securities and Exchange Commission (SEC) to rule on the obligations, actions, and standards of brokers, dealers, and investment advisers.

The legislation requiring a ruling came about because the sentiment among average Americans is that their interactions with the investment world tended to benefit those working in the investment world more so than themselves. These feelings were not unfounded. In the 80s and 90s, almost all “retail” (individuals purchasing for their own accounts, not part of a larger group) investing happened through brokers and the only fund offerings were high-cost actively managed accounts. Between advisory fees, sales loads, fund fees, trading commissions, and custodial fees, the cost of investing was often in excess of 3%. Read more

Target date funds have become some of the most common investments in America. Not coincidentally, their rise in prevalence has coincided with 401(k)s gaining in popularity. We have seen it here locally; many of the largest employers in Syracuse (Syracuse University, Carrier, Lockheed Martin, General Electric, Welch Allyn, and Niagara Mohawk/National Grid) had pensions. In almost all cases, the pension has been frozen and replaced with a 401(k)s that provides a target date fund (often the default investment when an employee enrolls).

Target date funds are good investments, they achieve two important goals to help satisfy the fiduciary obligation of the 401(k) plan’s advisor:

Diversification: They are generally diversified over thousands of stocks and bonds incorporating multiple asset classes.

Simplification: Target date funds are logistically simple. You only need one holding and it automatically adjusts your allocation from being aggressive when you are young to more conservative as you near retirement.

In most 401(k) plans which have automatic enrollment (73% of plans are now set up for automatic enrollment), target date retirement funds are the default investment. This means without any action taken, you’ll be investing in your 401(k), and it will be through a target date fund based on your age. Generally, you are placed in the target date fund closest to when you’ll turn 65, regardless of whether you plan on retiring at 55 or 75.

It is important to understand not all target date funds are the same, they can vary in allocation and cost.

In terms of allocation, the most famous instance of allocation discrepancy was in 2008. During that year, returns on 2010 target date funds (designed for those retiring in two years) varied from -3.5% to -41.3%. Since then, companies managing target date funds have more standardized their allocations, but differences still exist. The following chart shows the stock allocation for different target date funds of various companies or organizations.

The largest disparity is in funds close to retirement. Federal Employees invested in the Thrift Savings Plan (TSP) who have chosen the Lifecycle Funds will have a very heavy allocation towards bonds as they near retirement. However, those who are invested with T. Rowe Price (common for employees at Syracuse University), are close to 60% equities despite being invested in the exact same fund year. In 2008, the TSP’s 2010 fund would have lost about 6% while the allocation held by T. Rowe Price would have dropped 20%. This is not to say the T. Rowe Price allocation is too risky, but rather a reminder that it’s important to understand exactly how your funds are invested.

While not a 30% disparity, we still see decent differences in the allocation of 2040 target date funds. Fidelity comes in most aggressive with a 90% equity allocation – that’s a lot of stock market risk for someone who is 45, especially if they plan on retiring in their 50s.

For 2060 target date funds, we see Blackrock has an effective all equity allocation while JP Morgan inexplicably has a more conservative allocation than their 2040 fund, with 15% in bonds and 7% in money market funds.

Another discrepancy between target date funds is cost. The following table shows the expense ratios associated with each 2040 target date fund.

The expense ratios of target date funds are confusing if you work in the industry. If you work outside the industry, good luck. Fidelity, the largest custodian of 401(k)s in the country, is a perfect example. The average investor would assume they are in Fidelity’s 2040 Target Date Fund. But Fidelity alone has 21 different 2040 Target Date funds. The expense ratios of these funds range from 0.08% to 1.75% despite more or less doing the same thing. This price complexity comes from two things:

Multiple Series: The largest fund companies have many series for the same type of investment. Fidelity, Blackrock, and Schwab all have actively managed target date funds that charge high fees and low-cost non-active target date funds. Look for the word index as that is usually low-cost.

Different Share Classes: Clients of Rockbridge don’t have to worry about share classes because they are associated with commissions. As fee-only fiduciary advisors, we are prohibited from receiving a commission on a product we recommend, but some 401(k)s will have commission-based investment options. Even among choices that don’t receive a commission, you can have difference expense ratios. Fidelity’s Advisor Freedom series has an “Institutional” share class which costs 0.75%, a “Z” share class which costs 0.65% and a “Z6” share class which costs 0.50%.

We’ve found investors can sometimes get the same exposure as the more expensive target date fund options through the use of low-cost funds within the same 401(k) plan. Saab Sensis, a successful local employer uses a lineup which includes Principal as their target date fund family. These target date funds charge from 0.57% to 0.79% depending on the year. However, they offer lower cost mutual funds which can get the same exposure for around 0.25%, leading to substantial savings for the investor.

Lockheed Martin is similar. Most of their target date fund options cost 0.54%, but you can get the same exposure through individual index funds for 0.08%.

In conclusion, target date funds are generally good investments, but it’s important to know exactly what your getting in terms of allocation and cost. As always, if you have questions or concerns, please contact your advisor at Rockbridge and we can help look through your specific situation as it relates to target date funds or more general financial planning.

If you watched the Preakness Stakes, you and about 90% of all viewers were fixated on the horse named Bodexpress that threw his jockey right out of the gate and ran the entire race without him. It was an amazing feat. That’s right – no jockey steering him and whipping him with a crop around the entire 1.3-mile track.  At any point, Bodexpress could have stopped, turned around, or succumbed to side riders who tried to stop him during the contest. Bodexpress finished the entire race, and ran with the pack for nearly the entire contest. In fact, it almost appeared he would take over the lead horses before entering the final stretch.  While Bodexpress did not win, nor did he even finish in the top three, he made for a remarkable story. However, you may be asking yourself, what is the point of mentioning the jockey-less horse in one of the nation’s most prestigious races on our firm’s blog?  If you’re familiar with our past articles, you may have already guessed where this piece is going.

Bodexpress did not need to be over-managed – he had a job to do, one in which he was trained to do almost from birth. While I don’t want to overuse the analogy, I could not help but think that if Bodexpress was a mutual fund, he would have been an index fund. He didn’t need a jockey. Nor do most of your investments need a hyperactive “fund manager” dictating which stocks to buy and sell on a daily basis. Frankly, evidence states, most baskets of stocks or bonds generally do not need constant buying or selling from an expensive fund manager or “jockey,” as they are sometimes called in our industry.  Bodexpress, the horse with some of lowest odds at the start did not come in last, even sans jockey – some other horse named “Market King” came in last at the Preakness, which I find ironic for this analogical piece.

How do you think the owner of Market King felt, much less the jockey, after the Preakness? Humbled? All that steering, whipping and guiding and they still couldn’t beat a horse that was just following the track and taking his energy from the horses he ran alongside for a little over a mile. My bet is the owner, trainer and jockey of Market King felt a little foolish – not unlike an investor who has little value to show for their extra investment efforts (fretting over stock selection and market timing) when compared to the “jockey-less” index mutual fund.

Next time you watch a business show, read a book on the stock market, a personal finance magazine article extolling the virtues and benefits of picking stocks, timing markets or using derivatives, think of Bodexpress and know that sometimes in life, it just may better to ignore the conventional wisdom and leave some matters as they are meant to be. Even Bodexpress decided to take a victory lap all by himself after the race concluded.

Stock Markets

Stocks rebounded nicely. Tech stocks (FANGs – Facebook, Amazon, Netflix, Google) after leading the way down in last year’s fourth quarter (off 22%) led stocks back up (up 23%). A global stock portfolio earned about 12% this quarter and domestic stocks continued in the forefront.

Looking past this quarter, non-domestic markets have fallen short of domestic market returns.  There is no reason to think this pattern will continue. Stock markets seemed to have calmed a bit, and some of the uncertainties that have plagued stocks in the recent past seem to be coming into sharper focus.  Trade negotiations with China are moving along in a more positive vein and stocks continue to respond nicely to positive news about any possible resolution.

Concerns of looming deficits due to tax cuts appear to have moved to the back burner as inflation and interest rates remain at historically low levels. Markets continue to shrug off any dysfunction in Washington.  Yet, concerns remain. How Brexit (Britain leaving the European Union) eventually plays out remains a mystery.

Bond Markets

Bonds, especially longer-term bonds, are up this month, which is consistent with declining yields, at longer maturities.  Look below to see how bond yields beyond a year are below last quarter and a year ago.  The ten-year yields are below one-month yields – the lowest is at the 5-year mark. This pattern is unusual. Perhaps the best explanation is as simple as this: in a world of low and negative interest rates, U.S. Treasuries are the “best deal in town” for safe assets.

Interest Rates

Interest rates are historically low and have confounded many observers – more than a few predictions have gone awry, and crafting a compelling story to explain why there is little difference between short-term and long-term rates remains elusive.  Additionally, by historical standards the Fed has massive levels of Treasuries and Mortgage-backed securities on its balance sheet, which it must deal with, creating even more uncertainty.

Interest rates are important to the economic landscape. They are the price of capital – interest is what must be paid to use someone else’s money. The Fed only controls short-term rates.  Longer-term rates are where supply and demand for capital intersect. Demand depends on the expected payoff for putting capital to work; supply depends on what you expect to earn for giving up the use of your money. The horizon for suppliers and users of capital is distant – slight changes in interest rate’s can have a significant effect.

Stock prices are the present value of all future cash flows, which theoretically go on forever.  Falling interest rates translates into rising values of these cash flows.  The historically low levels and generally downward trend in interest rates help to explain the long-running bull market.

Bond returns are affected by both absolute levels and changes in interest rates – rising rates produce lower bond prices and returns; falling interest rates work in the opposite direction.  The longer the maturity, the greater the impact of changing rates.  Declining yields at the long end mean better returns for longer-maturing bonds.

Where interest rates go from here is anybody’s guess.  However, right now there doesn’t seem to be much pushing rates up, especially with an expected slowdown in worldwide growth.  All indications are for rates to remain low with little difference between short and long rates for a while.

Jack Bogle

Jack Bogle, the godfather of index funds and founder of Vanguard, passed away in January at age 89.  His influence on the investment world over the past forty years is immense; his accolades are well-deserved. Jack Bogle’s unwavering commitment in his ideas alone set him apart.  While the underlying concepts behind index funds are now the mainstream, they surely weren’t when he first championed them.  Jack Bogle clearly did more than anyone for small investors.  The notion behind Index Funds (achieving market results at the lowest cost to have the best chance for long-term success) is equally applicable to all investors – both large and small.

It’s no secret that since the Financial Crisis value stocks have underperformed growth stocks.   Many theories exist as to why this has happened, none of which can be confirmed as truth.  This begs the question “what does this last decade of value underperformance mean?”  The answer, truthfully, is that it means nothing.

For starters, value stocks have outperformed growth stocks over long periods of time.   Because of this, we have a mix of value and growth stocks in our portfolios, with a tilt towards value stocks.  What we do know is that there have only been three significant periods where value stocks have underperformed growth stocks in the last 90 years.  One of those three periods happens to be 2008(ish) to today (see chart below):


Source: Kenneth French’s Data Library, 1926-2017

Although there is uncertainty around how long these periods of value underperformance last, history suggests the frequency of a positive value premium has increased when you look at longer-term data (see chart below).

Source: Dimensional Fund Advisors

What does all this mean?

Quite frankly, it’s unlikely to expect value stocks to underperform growth stocks.  It’s even more unlikely to endure this underperformance over long periods of time.

This value premium isn’t all that steady or predictable, but a consistent investment approach that maintains an emphasis on value stocks will allow investors to more reliably capture the premium over the long run.

This recent market downturn has many investors drawing parallels to how they felt during the infamous 2008 financial crisis. The last 11 years have been a roller-coaster ride for investors. Right after seeing market highs in late 2007, investors experienced a nearly 50% market decline of the S&P 500 in 2008. In the following 9 years, the S&P 500 delivered double-digit positive returns in all but two years, and then unfortunately had that barbelled with today’s most recent threat on a bear market with the S&P 500 going down 19.77% since late August. Well, to summarize, it has been a volatile ride!

So how does this 11-year ride stack up in the history of stock returns? There have been 83 trailing 11-year periods since 1926 for the S&P 500. 2008-2018 ranks in the bottom 25% for these periods when measuring performance. To make things worse, the S&P 500 was the shining star over this time period beating out the returns of U.S Small-cap, International, and Emerging Market Stocks.

Knowing this, you would assume a diversified investor (60% stocks and 40% bonds) probably didn’t fare too well over these past 11 years. They didn’t get the 6-7% return we would expect for the long run, but still managed a return of 5.14%.

When put into perspective, a 5.14% return doesn’t sound too bad given the period we just went through. Contrary, a saver who invested in 1-year CD only averaged 1.05% during the same period, losing over 1% per year to inflation. $500,000 invested in January of 2008 grew to $867,796 with the 60/40 portfolio vs $560,395 if saved in 1-year CD.

There are many takeaways here, but most important is the reminder to stay the course. Being invested in the market certainly will come with volatility at times (see at left), but it is one of the best ways to get returns that keep up with inflation and help us meet our long-term goals. We don’t expect future equity returns to be in the bottom 25% going forward. Things will turn around like they always do. As investors, the only thing we can do is make sure we are participating when that time comes.

2018 was a woeful year for investing. All major stock market indexes were down, bonds enjoyed a year-end rally to finish flat, and commodities such as gold and oil fell. Seeing all asset classes drop in unison is unusual and unlikely to continue.

Stocks

Stocks began the year on solid footing, but fortunes quickly changed as early February saw a 10% drop in equities. Markets steadied over the spring and summer, with domestic stocks reaching new highs in the early fall. And then the 4th quarter happened. All equities suffered substantial losses. In aggregate, U.S. Large Caps and REITs were the best performers of 2018, followed by U.S. Small Caps, and then International Stocks.

2018 was a poor year for International Stocks, but Emerging Markets are still the best performer over the last two years (after being up 38% in 2017). December was a reminder of why we stay diversified. While U.S Stocks were down 10%, International Developed lost 4.8% and Emerging Markets lost 2.6%. Again, we see diversification help to dampen volatility.

Bonds

Yields rose in 2018 and the curve flattened substantially. The Federal Reserve hiked rates four times last year as they viewed a strong economy and a tightening labor market reason enough to aggressively unwind their accommodative monetary policy. The U.S. 5-Year Treasury, a good proxy for our Bond holdings, began the year with a yield of 2.25%, before selling off to reach a high of 3.09% in early November. At that point, the aggregate bond market was down 3% for the year and it looked certain we’d finish the year negative for the 4th time in the index’s 43-year history. But a 58 basis point rally in the final two months spared Bonds, allowing them to finish 2018 with a positive return of 0.01%.

The yield curve is now the flattest it’s been in a decade. The 1-Year Treasury Bill is yielding more than the notes maturing in 2-7 years. It appears the market is pricing in one more hike in interest rates, followed by a few cuts from the Federal Reserve. These cuts could come as a result of a recession or simply because global growth slows (but doesn’t contract) and inflation softens below the Fed’s goal of 2%.

Near Bear Market

On Christmas Eve, the S&P 500 closed down 2.7%, ending a 7-day stretch where stocks lost 11.3% of their value. That selloff put us on the cusp of a “bear market” meaning a drop-in price of 20% or greater from a previous high.

The causes of the selloff are numerous. America and China are involved in a growing trade war, the Fed is raising interest rates, analysts lowered global GDP growth estimates, manufacturing activity is below expectations and our government is in a shutdown with no end in sight.

On top of that, we’ve had a record long 10-year run of strong stock market performance and economic expansion that is the second longest in history. It seems there is plenty to be fearful of. Our cognitive biases aren’t helping. Some of us may be experiencing  recency bias. In the last 30 years, the only two times the market has dropped more than 20% were because of the dot-com bubble and the financial crisis. In those instances, we saw the market sell-off 49% and 57% respectively. Being 20% off the highs investors think, “I know what happens next.” The next logical question is– shouldn’t we sell out of stocks now, wait until the market falls 50% and buy back in? But just because that’s how the last two drops have happened doesn’t mean this one will be the same. It’s possible the bottom of the market will be a 21% selloff, or 23%, or 27%, or 32%. Or it’s possible that the bottom was the 19.78% we saw on December 24th.

Some of us also suffer from negativity bias; we remember the things that ended poorly but forget instances where things turned out well. In 2011, the market was in the middle of its recovery from the financial crisis when cracks began to appear. Greece was heading towards bankruptcy and there were concerns the Eurozone would break apart. Bank of America was experiencing extreme volatility, and some feared they may be insolvent. High-profile investors such as Ray Dalio, who predicted the 2008 crash, were warning of a “double-dip” recession, pushing markets back to levels in 2008 & 2009. In the five months from May until October, the market sold off 17%. But the crash never came. Greece and the rest of the EU didn’t implode, Bank of America got a $5 billion investment from Warren Buffet, and the economy kept chugging along.

The same fear investors feel about the market today they could have felt in 2011. But we forget 2011 and remember 2008, though there is no reason to think that 2019 will be like 2008 and not 2011 (throughout history there have been a lot more 20l1’s than 2008’s).

2019 and Beyond

We do not know what the stock market will do in 2019, and neither does anyone else. Despite the pessimism in the markets and in the media, there are plenty of reasons to feel good about stocks. America’s economy is expected to grow at 2.3% and the broader world is expected to grow at 3.0%. 2018 ended with a very strong jobs report as wages and hiring continues to be robust. Perhaps most promising of all was an increase in the labor force as those who had previously not been looking for jobs re-entered the market.

Every Wall Street Bank that puts out a price target for the S&P 500 is predicting a positive year in 2019. The average earnings for the S&P 500 are expected to be $173. With a 2018 close of $2,507, that works out to a forward P/E of 14.5, which is low by historical standards meaning stocks are currently a good value. This puts equities on par with where they were at the start of 2013 – that year the market rallied 34%.

We don’t know what next year and beyond have in store for stocks, but we do know over time it pays to be invested. Investing in the market isn’t easy which is why it pays so well in the long-run. Volatility like we saw in the last quarter causes people to sell out of stocks. This is beneficial to the disciplined investor as there are fewer people with whom he or she has to share corporate profits.

The best thing a person can do is find the right mix of stocks and bonds that fits their individual needs and then stay the course. And lastly, if the market closes next year right where it started at $2,507, your return won’t be 0, you’ll have made 2.2% because companies pay dividends!

I’ve been watching people drive all my life. I’ve been an individual investor and an investment advisor guiding clients for more than half of my adult life.  I’m a curious soul and during a recent trip from Syracuse to Atlanta, I had quite a bit of time to watch and observe the behaviors of all sorts of motorists and their driving habits.  I could not help but draw comparisons between peoples’ driving habits and their investing habits; impatient drivers expose themselves to all sorts of unnecessary risk and stress.

On a long trip, my GPS estimates the time I will arrive at my destination, usually within a few minutes.  As advisors, we tell clients what they should expect in terms of average market returns knowing that, in any one year, those returns could be considerably higher than expected (2017) or perhaps lower than expected (2018).  Over your investing lifetime, you will likely achieve what you set out to accomplish in terms of investment results if you stay the course and remain committed.  Your GPS will do the same; despite the fact that you may be driving faster or slower than expected at certain times along the way, you will generally arrive on time.

While not always the case in Syracuse, in Atlanta, traffic jams are ever-present during the rush hours.  Undeniably, some drivers feel the need to constantly change lanes expecting something better to happen.  Rather, I conclude, the best option is to stay in one lane and let the “jam” naturally work itself out – no different than what long-term investors should do in an efficiently functioning market.  We have all observed motorists who change lanes whenever they suspect that other drivers may be getting an advantage.  Just as there is added risk in changing lanes and avoiding bumpers and accidents with other moving vehicles, there is risk in jumping from one investment to another based on news reports or a gut-feeling that you are not moving forward fast enough.

The next time you are in a traffic jam, observe the experienced drivers who do in fact stay in their lane – they have been there before, they have seen it play out and they know the stress and risk is not worth the potential reward.  Although they may be frustrated, they tend to remain calm and logical at the same time – accepting the inevitability of certain occurrences.

The best drivers I have observed in my lifetime have a high degree of patience.  And you guessed it, the most proficient investors are very patient as well.  Successful investors understand that some years will be better than others.  Poor economic cycles or market corrections (although fairly common and expected) are impossible to predict in terms of veracity or duration.  This is a valuable lesson I have learned over the last twenty plus years as an investment advisor.  If you feel the need to change lanes, end your investment journey, or simply seek assurance that you’re headed in the right direction, be sure to reach out to your Rockbridge advisor!


Stock Markets

December’s market reminds us that risk is real – even after the uptick at the end of the month, a global stock portfolio is down about 15% for the quarter and 12% for the year. Technology stocks (Amazon, Apple, Microsoft, Google, Facebook, Netflix), which have been driving the market to new heights in recent years, were off nearly 20% this quarter.

Future returns depend on news, which, of course, can’t be predicted. (If it could it wouldn’t be news!) Maybe markets have exaggerated today’s concerns or maybe there is more to go.  For sure, increased volatility lies ahead.  We have been lulled into a stock market that has provided a mostly smooth ride upward over the past few years.  That pattern is not typical – risk matters.

Up until now, the market has shrugged off the myriad of issues that have been plaguing us for a while. These include:  international trade wars and tariffs, rising interest rates, privacy and social media concerns, impact of last year’s Tax Bill, resolution of Brexit, slowdown in global growth, sliding oil prices, political dysfunction and Government shutdowns.  Market prices reflect a continuing forecast of the eventual economic impact of these issues.  In December, these forecasts turned negative.

The ten-year numbers above tell us there is a reward for enduring the normal ups and downs of stock markets, including recent results.

Bond Markets

Bonds earned positive returns for the quarter, fulfilling their role of reducing the overall risk of a diversified portfolio. 

The shape of bond yields across various maturities is unusual.  Even as the Fed increased interest rates, the market-determined yields on longer-term bonds fell.  This pattern can be a harbinger of a difficult economic environment ahead. On the other hand, it is also consistent with an overall move to reduce exposure to risky assets.

We are now dealing with the risk side of investing, which we can divide into two categories:  (1) the impact of factors that affect all securities, and (2) the impact of what affects only an individual security.  By diversifying, the effect of any individual security becomes minimal.  Expected return is the reward for enduring the variability of market-wide uncertainties.

Stock markets are risky, but what about the eventual reward?  Do investors eventually earn what they expect?  We look for answers in two places:  (1) If market participants, who are constantly buying and selling, didn’t eventually earn what they expect, they wouldn’t play, and (2) There is evidence that over the long run, returns tend toward long-term averages.  But long-term means long and succumbing to short-term variability ensures failure.  It’s why risk matters.  It’s why the urge to give up makes success hard to achieve.

Depending on the news you read, you may have come across headlines talking about bear markets and stock market corrections. The following is a guide to what they mean and how to put them in the context of history.

The conventional definition of a bear market is a price drop in a stock market index of 20% or greater from its high. The most quoted stock market index in America’s investment community is the S&P 500. When people reference our being in a “bear market,” they are likely talking about the S&P 500.

With Monday’s close at 2,351.10, the S&P 500 is 19.78% off its close of 2,930.75 set on September 20th of this year. That means we are a 0.28% drop away from entering a bear market. However, other markets are already in bear territory:

A 20% drop feels pretty bad and it is. Since 1950, we’ve witnessed 9 bear markets:

Nine bear markets over 68 years works out to one every 7.5 years. And it has been nearly 10 years since our last bear market bottom. Are we due? Maybe…

Another term in the news is market “corrections.” A market correction is generally defined as a drop of 10% or more. The following table shows all the stock market corrections since 1950 that never became bear markets:

When looking at the current correction compared to all drops of 10% or greater since 1950, we see:

Our last two bear markets (2002, 2009) have been big ones, the two largest since the great depression. In the last 30 years, the only times the market has dropped more than 20% it’s kept falling, eventually being cut in half. Our recency bias tells us once we’re 20% off market highs we have much pain ahead, but that is not certain. It is imperative we remind ourselves that twice doesn’t make a trend and is woefully short of being statistically significant.

Maybe stocks will continue to drop, reaching a 40%+ bear market, or maybe 2018 will be a repeat of 1990. In 1990, we had a correction that barely eclipsed 10% very early in the year, followed by a larger drop at the end of the year that came within 0.1% of being a bear market. But if you had temporarily reduced your equity exposure it would have been to your detriment. For the rest of that decade, the S&P 500 appreciated at an annualized 20.9% over that 9-year span.

No one knows what the market will do next, but we do know it’s folly to try and time it. $10,000 invested in the S&P 500 in 1950 would have grown to $14,000,000 today for an annualized return of 11.1%.  One way to think of it is that every day you are in the market you are earning nearly 0.03%. If only it were that easy…

At Rockbridge, we believe that the role of an investment advisor is changing, and investors should be expecting more from their advisors than they have in the past. With options like Vanguard, robo advisors, and all the other investment-only solutions popping up each day, it’s clear that advisors who focus solely on investment management are a thing of the past – or certainly should be!

Yes, even our name “Rockbridge Investment Management” demonstrates that investment management is at the heart of what we do, which it is, but I wanted to take a few moments to share with you some of the additional things we help clients with each and every day:

  1. Asset distribution planning: In retirement, most retirees have pre-tax and post-tax investments, Social Security, and possibly even pensions. Deciding how and where to take distributions in retirement is very important and something we help clients with every day.
  2. Taxes: With the tax code changing for 2018, what does that mean for you? Rockbridge employs experts who help clients make sure they are saving or spending in the most tax-efficient way. Below are some timely examples:
    1. Using Donor-Advised Fund for annual charitable gifts
    2. Using your RMD’s to maximize tax deductibility of charitable gifts
    3. Maximizing employer retirement accounts/Roth IRA’s
    4. Minimizing overall taxes paid with Roth conversions
  1. Goal tracking: Retired or saving for future retirement, Rockbridge advisors help develop and track your financial goals. We make sure you are maximizing every opportunity to maintain or reach your desired standard of living.
  2. Medicare: This is a decision every 65-year-old has to wrestle with and at Rockbridge, we have in-house experts to make this process easier.
  3. Social Security: For most retirees, Social Security is the only retirement asset with a built-in inflation hedge. Determining the ideal time to take this for you and your spouse could be one of the most important retirement decisions you have to make. Rockbridge is here to help you navigate the pros and cons on taking this early or delaying.

Our team is also involved in many projects, such as the Northeast Agricultural Education Foundation and their Agricultural Education Grant.

We expect a lot out of ourselves here at Rockbridge, and we continually try to become better at what we do and provide more for our clients. If any of these things resonate or seem timely, please give your Rockbridge advisor a call.


Stock Markets

For the last quarter, stocks are up except for Emerging Markets, which were close to flat. Domestic stocks are seemingly shrugging off the uncertainties of increasing interest rates, trade wars and tariffs.

Year to date, an Emerging Market stock portfolio would be down almost 9%. It is not surprising that today’s uncertainties are having a greater impact on developing economies as they tend to have larger debt levels denominated in dollars and exports are a bigger part of their economies.  Consequently, the value of the dollar is increasing, interest rates are rising, and tariffs will have a greater impact.

Non-U.S. markets have not kept pace with U.S. markets over the periods presented. Subsequently, stock returns from a globally diversified portfolio over these periods would be below those of the popular domestic indices (e.g. S&P 500).  This environment makes maintaining commitments across all markets especially hard.  The benefits of diversification are clear, but it often means enduring periods of below average results in various markets for extended periods of time. For example, since 1971 the annualized ten-year return for the S&P 500 has varied between 5% and 17%.  It is reasonable to think markets will eventually earn their expected returns (in the “long-term”), but this variability gets in the way of considering ten years the “long-term”, as we would expect a much tighter range in these results if it were indeed the long-term.  So, when we see non-U.S. stocks underperform in every period reported in the chart above, we do not conclude they will always underperform, but instead that more patience is required to reach the “long-term” and achieve expected returns.


Bond Markets

The Yield Curves to the right shows that bond yields ticked up for all maturities over the past year and quarter.  The Fed recently affirmed its commitment to increase interest rates and the change in yields is consistent with that objective.

How much room is left for bond yields to move?  The yield on the 10-year Treasury is currently about 3.1%.  Theoretically, a bond’s yield should include a premium for (1) the time value of money, (2) risk and (3) expected inflation. For example, let’s pick 2% as a premium for investing instead of spending money.  Note the difference in yield between one-year and ten-year bonds is 0.5%.  This leaves 0.6% as expected inflation over the next ten years. If this expected inflation number is reasonable, then today’s yields might be about right – if this number for expected inflation over the next ten years feels low, then yields might have some ways to go.  While these observations are not a prediction, they are intended to provide some context for what we see in today’s bond markets.

As we think about the recent bull market in U.S. stocks, below-average results in non-U.S. markets, and historical low interest rates, keep in mind that markets have no memory.  Remember that prices are based on expectations not the past.

Interest rates are rising, and yet you may not be earning much on your cash.  As financial markets finally begin to reflect a recovery from the crisis of 2008-09, the brokerage industry is changing the way they handle customers’ cash, and investors need to pay attention.

Over the past ten years we have become accustomed to earning nothing on our cash.  The Federal Reserve kept rates at essentially zero for so long that investors came to expect no return on uninvested funds.  It has been a difficult time for savers.  Bank CD rates are generally very close to U.S. Treasury rates, and until mid-2016 a 3-month treasury security yielded less than 0.25%.  In fact, the Fed dropped rates effectively to zero in December 2008 and finally began to raise them again in December 2015.  The 3-month treasury yield has steadily risen along with the Fed Funds rate, from 0.25% in 2016 to over 2% today.  By historical standards interest rates are still low, but the increase from zero to 2% is significant for savers and investors of short-term cash.

So why am I still not earning anything on cash?

The short answer is that the brokerage industry is keeping most of the interest earned in sweep accounts for themselves and forcing investors to deliberately invest cash to earn a competitive rate.

Borrowers who compete for funds are compelled by market forces to pay similar rates – otherwise they don’t get the funding they need.  So banks selling CDs in the open market have seen rates rise along with treasury yields.

Not all borrowers are forced to compete.  Bank deposits and cash balances in brokerage accounts represent something of a captive audience.  Years ago, when interest rates were high, and the market was competitive, banks and brokers began offering sweep accounts, where excess cash was automatically swept into an interest-bearing account each night.  This arrangement was an important source of profit for banks and brokers as they were able to invest the cash and earn a positive spread, or margin, above what they paid the customer.

When the Fed dropped short-term rates to zero in 2008, the profit margin disappeared from sweep accounts, along with the return to savers and investors.

Fast forward to 2018 and we see that short-term rates have crept back to 2%.  At the same time brokers and investment firms have continued to experience competition in other areas of their business; $19.95 was once thought to be an incredible bargain for a brokerage trade.  Many brokers now offer trading on an electronic platform with rates below $10, and certain transactions are free.  Likewise, the internal management fees or expense ratios for mutual funds and ETFs have been driven downward to the point that Fidelity recently announced some index ETFs with an expense ratio of zero.

In their search for profits, brokerage firms have seized on the sweep accounts as a way for them to make money.  Most have transitioned to where excess cash is swept to a bank deposit fund that earns something, but very little.  Profits flow back to the brokerage firm because they either own the bank or have some affiliation that returns profit to the brokerage firm.  This arrangement has at least one advantage for investors because the bank sweep funds are FDIC insured, but returns are substantially below what we would historically expect from money market funds.

So, what am I supposed to do?

Well the good news is that investors have alternatives.  The first strategy is to reduce cash balances where practical.  Schwab for example explains that their sweep account is only intended for the minimal cash balances required for near-term transactions.  Cash held for a longer period, where the investor wants a return without taking investment risk in stocks or bonds, can be invested in a purchased money market mutual fund.  Money invested in these funds is available next-day, rather than same-day in a sweep account.

For Rockbridge clients we are implementing a tighter cash management protocol to reduce balances held in sweep accounts and using money market mutual funds or ultra-short bond funds to generate some return on funds that are not allocated to long-term investment risk.

It is also important to keep this issue in perspective.  Our target is to keep cash balances at 1% (now less than 1%), so a $1 million account would have a cash balance of $10,000 or less.  If left in the sweep account rather than a fund with 2% returns, the lost income would amount to less than $200 per year.

The terminology and nuances of sweep accounts and purchased money funds can be confusing, so if you have any questions, please give us a call to discuss.

We had several clients this year reach out to ask how bonds were performing in their portfolios. These are great questions, so we created a few items to address what you see in your statements.  Some people notice they have held bonds for several years but seem to have a loss with their holding. This may come from their monthly statement from the custodian. Below is an example of how that looks:

From looking at this statement, it seems this investor has lost almost $9,000 from their bond holdings in the last 2.5 years (1/25/16 to 7/31/18). However, if you look at the returns from the bond funds over that period you see they were positive.

This is possible because the bond funds pay interest every month. That interest goes into the account as a monthly cash deposit and is used when we rebalance the portfolio. Interest paid in cash does not increase the market value column. Despite showing an unrealized loss, the investor did make money through these holdings.

All that said, bonds can lose money. When interest rates rise, the value of existing bonds goes down, and returns can be negative even when accounting for interest payments.

Real life application of interest rates:
  1. How it’s playing out this year (numbers from 1/1/2018 to 9/26/2018):An aggregate bond fund holds thousands of bonds. In their entirety, they have an average weighted life (duration) of 6 years. This number tells us how sensitive they are to interest rate changes.At the start of the year, an aggregate bond fund was yielding 2.57%. It is now yielding 3.22%. That means it had an interest rate increase of 0.65%. If you multiply that increase by the bond duration, Sabine’s blog you get the change in value of the underlying bonds. In this case, 6 x 0.65% = 3.90%, so the bonds’ market value dropped by 3.90% from January through September 2018.However, the bonds are paying interest. If you average the yield at the start of the year and currently, you get 2.90%. For roughly 9 months in the year, 2.90% x 9 / 12 = 2.13% of earned interest. This nets out to a loss of 1.77% so far this year.
  2. This isn’t a bad thing! Rising interest rates generally aren’t a problem for the following reasons:
    1. Your returns going forward will be higher! If bond yields start at 2.57% and never change, you’ll earn 2.57% for the rest of your life. If they start at 2.57%, jump to 3.22% and then never change you’ll eventually have more money because of it. Remember, the 3.90% drop in principal came because yields went up 0.65%. Every year from now on you’ll be getting 0.65% more in return. 3.90% / 0.65% = 6. In six years, you’ll have made up the lost principal in extra interest. From that point on you’ll be getting more in yield, leaving you better off in the long run!
    2. Usually, bonds and stocks have an inverse relationship. Historically, the price of stocks and bonds move inversely with each other. This means when stocks are falling, interest rates go down and the value of existing bonds goes up. The opposite is true as well; if the economy is doing well and stocks are rising, interest rates are also going up and the value of existing bonds goes down. Quantitative easing by the Federal Reserve has skewed this some, but overtime we expect this to continue. For a balanced investor who holds both stocks and bonds – when bonds are losing value for an extended period, the stock portion of the portfolio is likely going up. Remember, a few months, quarters or even years is a relatively short time when it comes to investing. And for most of our clients, our time horizon is decades not years.

In summary, we feel bonds add value to most individuals’ portfolios. Over the long run they provide a positive return and have much less volatility than stocks. Additionally, they usually move in the opposite direction of stocks which limits large fluctuations in portfolio value and amplifies the benefit of rebalancing.

  1. How does/and how much does your advisor get paid?

Fees matter.  It is important to know how much you are paying and the value you receive for that payment.  If you’re paying 1% or more for only investment management with no in depth retirement planning, we should talk.

  1. Is your advisor required by law to act in your best interest? If not, why?

Most advisors are only required to do what’s “suitable” for you and are not required to act in your best interest.  If your advisor is anything but a fee-only registered investment advisor (ex. Fee-based, commission based, insurance salesman, bank advisor etc.) they have intentionally decided against being held to a fiduciary standard (acting in your best interest).

  1. Does your advisor invest his own money in the same manner he recommends to his clients?

Rockbridge advisors believe all money (theirs, as well as their clients) should be invested according to an evidence-based investment philosophy studied by academics since the 1960s. If your advisor is investing their own money differently than they are recommending you should invest yours, it should make you stop and think.

  1. Does your advisor help you save money on taxes?

We help clients focus on factors they can control.  Together, we build and create a financial plan incorporating a tax-efficient investing and withdrawal strategy so you end up with more of your own money (and the government doesn’t!).

  1. Does your advisor help you understand how much money you can spend in retirement?

Investment management is just one piece of sound financial advice.  We solve financial problems beyond just the investment management component.  The first step of our process is to help you understand how much you are able to spend throughout retirement relative to how much you are spending today.

  1. Does your advisor have industry professionals to help you in all aspects of your financial life? If not, why?

At Rockbridge, we have built a team of industry professionals (CFP’s, CFA’s, CPA’s, and Legal),  that are committed to client care.  We have the expertise to provide unrivaled advice in all aspects of your financial life.

It’s simple. Don’t.

A common question we receive is “how do I prepare for the inevitable stock correction?”  There are two answers to this question: the one you want to hear (which is wrong), and the one you don’t want to hear (which is right).

Mainstream media wants you to believe that you can outsmart the market.  Everything you read and hear from news sources and financial “experts” will make you think this (almost) 10 year bull run is coming to an end.  “Trump, North Korea, inflated stock prices, interest rates, trade wars, Trump (again), etc.” is blasted through your television sets every day of the week followed by “sell stocks, buy bonds, no don’t buy bonds because of interest rates, buy bitcoin, no sell bitcoin and buy Alibaba.”  Here’s the million dollar question: “With all this information and all this uncertainty, what should I do?!”

Nothing.  Often times in the face of fear, the best course of action is to stand still.  The problem is that this type of “inactivity” is perceived as unintelligent behavior when actually the opposite is true. This is proven by math and science.  This is a fact.  Mainstream media won’t tell you this for a simple reason; If Jim Cramer got on the air and told his viewers to hold a diversified portfolio and not to worry about the uncertainty in the markets, he wouldn’t have a whole lot of viewers.   It’s boring, it’s not entertaining, but it is the best way to build wealth.  Ignore these expert opinions.  They don’t know any more than you do.

Market returns typically come in short and unpredictable bursts.  We don’t know when these bursts will happen, but it’s of crucial importance that you are there for them.   You must be there when opportunity knocks, whenever that may be.

I’ll bore you with some facts: If we look at the last 1,100 months (90 years) and removed the best performing 91 months, the average return of the remaining ~1,000 months is practically zero.  In other words, 8.50% of the months provided almost 100% of the returns over the last 90 years!  We don’t know when these months will come, but we must participate in them!

Legendary investor Peter Lynch said it best – “Far more money has been lost preparing for corrections, or anticipating corrections,  than has been lost in the corrections themselves.” Stay invested, construct a plan, and stick to your plan through good and bad times.  And most importantly, focus your time and energy on factors you can control; how much risk to take, what mix of investments, and how much the investments cost to name a few.

Stock Markets

Returns from various stock market indices over several periods ending June 30, 2018 are shown to the right.  Here are a few highlights:

  • Domestic stocks continue to lead the way. REITs were up nicely for the quarter, but non-domestic stocks were down.  Due to political turmoil and the specter of a trade war, stocks traded in developed international markets are reflecting uncertainty.
  • Emerging markets gave back much of their positive result of recent periods. This is driven by increasing interest rates and the strength of the dollar.
  • Returns from domestic small-cap stocks have done well over these periods.
  • Look at the variability among the different markets over the shorter periods and how it tends to even out over longer periods. Keep in mind:  ten years in capital markets is a short period over which there can be plenty of anomalies.

Bond Markets


The Yield Curves graph to the right shows the yield to maturity of U.S. Treasury securities, from short-term (one month) to the long-term (twenty years).  Recent changes in these curves are presented below.  Note:

  • Look how short-term yields have climbed over the past year with little change in longer-term yields. As yields move up, prices and returns go down.
  • There is not much change over the quarter. Notice the flatness of today’s yield curve – hardly any difference between 5-year and 10-year yields.  A flat yield curve is generally an indicator of a difficult economic environment ahead.
  • While there is no sign of it yet, it seems reasonable to expect increasing inflation due to the introduction of tariffs, plus today’s robust economy and low unemployment.  Expectations of increasing inflation should produce higher yields for longer-term bonds.

Last week, we introduced you to our weekly Investment Committee meetings. When we met for class on 4/27/18, we began our discussion on the subject of an “optimal portfolio.”

The centerpiece of investment management is portfolio construction. Alongside financial planning, the manner in which one’s money is invested is critical to meeting one’s financial goals.

Before attempting to construct the best portfolio possible, it is important to identify some core beliefs when it comes to investing. There are many, but a few we would like to highlight are:

  • Markets are efficient: By and large, the best estimate of the true intrinsic value of a stock or bond is whatever price the security is currently trading at. Free lunches almost never exist, though in hindsight may seem obvious. No one really knows what will happen to the market tomorrow or the next day.
  • Only take systematic risk: When you own the broad stock market, you are exposed to variability in the value of your investment (risk). When the economy is good, a diversified stock portfolio will go up, and when recessions hit, it will go down. The investor is rewarded for taking that risk. Over time markets go up, but the ride is bumpy. When one owns individual stocks, they are still exposed to that same economic risk. However, they are also exposed to company specific risk. The company specific risk associated with each individual stock averages together to get the broader market, meaning on it’s whole provides no additional return. By concentrating your investments into specific holdings, you are exposing yourself to increased risk without improving expected returns.
  • Risk and return are highly correlated: As markets are efficient, and assuming only systematic risk is being taken, the more (less) risk you are taking the higher (lower) your return should be over long periods of time. Since 1926, U.S. stocks have averaged a 10% return. If you were told going forward you’d get 10% every year, everyone would sign up, driving the price up until the expected return was lower. The fact that the market can be up or down 40% in a year is what makes it risky and along with that comes a return.

Keeping these “truths” in mind, we construct an optimal portfolio with the goal of achieving the following things:

  • Achieve the highest risk-adjusted return: Through the application of modern portfolio theory, we want every portfolio to deliver the largest return for a given level of risk. Financial advisors and investors together are responsible for determining how much risk the investor can and should take. At that point, we find the combinations of investments that deliver the highest expected return.
  • Keep costs low: Research shows that paying too much in fees and commissions eats into returns. Keeping costs low and achieving market returns in the most efficient manner is the proven way to build wealth.
  • Simple and customizable: Research has shown a few factors drive returns. Introducing a multitude of strategies and products generally complicates things, often driving costs up without improving returns. Additionally, every client is unique and an optimal portfolio must be customizable to their specific situation. Whether it’s a legacy stock position with large capital gains, or an employer sponsored retirement account with poor/limited investment choices, an optimal portfolio needs to be able to be customized. Simplicity meshes better with customization than complexity.

Having a plan and sticking with it is critical when it comes to investing. Cognitive and behavioral biases cause people to make emotional decisions which harm their financial well being. Understanding and buying into the investment management piece of one’s finances, helps the investor and the advisor stick to the plan and avoid the mistakes that harm most investors.

Introduction

People from all across the world look forward to Friday.  Friday marks the end of a (usually long) work week and the start of what is supposed to be a relaxing weekend.  At Rockbridge, we look forward to Friday’s, particularly Friday mornings, for a different reason.

Friday mornings have become a tradition, some say a “tradition unlike any other” (not the masters), where great minds (some) sit around our conference room table and discuss the core principles of our investment philosophy and what, if any, changes should be made to our portfolios.  These meeting are led by Bob Ryan, Rockbridge’s Chief Investment Officer, and topics include anything and everything investment management related.

The purpose of these weekly articles is to inform clients what we are discussing each week and how it relates to their wealth at Rockbridge.  Our investment philosophy is proven in academia and the ideas we implement in our portfolios have been around for several years.  It’s important to us to not have a “whimsical” approach to managing wealth; something we see all too often in the investment management world.  Although we are seen as a financial planning/wealth management firm in the eyes of our clients, investment management and portfolio construction is the backbone of this process.

We hope to provide valuable insight on our Friday meetings; what some have coined “Bob’s Investment Class.”  This marks the beginning of a series of weekly posts sharing some of these ideas with you.

Thoughts from Friday 4/20/18

Mike, Ethan, and Claire, attended the Dimensional Fund Advisors (DFA) conference in New York City this week and came away with some interesting ideas for our Friday discussion.

Topic: Corporate Bond Credit Risk Premium

There are risks to consider when investing in the bond market, one being credit risk.  Credit risk is the risk of a bond “defaulting”, and in a normal market riskier bonds will have to entice investors by providing higher coupon payments.  We ran across data suggesting that bonds with lower credit quality have similar default rates to similar bonds with higher credit quality.  This begged the question of “why not invest in riskier bonds and pocket the higher coupon payment if said bonds have the same default rate as  similar higher quality bonds?”

One of our core rules is to be suspicious of any “free lunches” when it comes to investing; achieving a higher return without enduring additional risk, which is what we see here.    This situation is no exception to our core beliefs.

We discussed that although increasing credit risk in the bond portfolio might not result in a higher default rate, it would actually increase the correlation to the equity portfolio.  Bonds should be inversely correlated with equities, and increasing credit quality too much creates positive correlation to equities; meaning equities and fixed income would behave similarly, something we don’t want to happen.  Bonds provide a “buffer” in the portfolio, helping to “smooth out the ride.”  For example, in 2008 the Barclay’s Aggregate Bond Index finished the year earning 5.24% while the S&P 500 Index finished losing nearly 37%.

In summary, the role of bonds is much more than the eye sees.  Sure, we could increase expected bond returns by exposing portfolios to more credit risk, but we would increase the correlation between the stock and bond components of the portfolio as well.


Stock Markets

Returns from various stock market indices over several periods ending March 31, 2018 are shown to the right. Here are a few highlights:

  • While not observed in these graphs, volatility seems to have come back, which is normally how stock markets work.
  • Except for emerging markets, stocks were down over the past quarter – REITs continue to lag.
  • Even with the off quarter (with the exception of REITs), stocks were up nicely over the past twelve months.
  • Note that over the past five and ten years, returns from stocks traded in domestic markets were well above those in non-domestic markets. However, don’t let these results fool you. Diversification to non-domestic markets is still important to long-term success.


Bond Markets

The Yield Curves to the right show the yield to maturity of U.S. Treasury securities over several maturities, from the short term (one month) to the long term (twenty years).

  • Look at how the curve has moved since the beginning of the year. It is essentially showing a parallel shift upward. As yields move up, prices and returns go down.  Consequently, we realized negative bond returns this past quarter – the longer the maturity, the greater the loss.
  • Now look at the changes since a year ago. Yields for longer maturities did not change much over the past year and, in fact, fell between March and December.  Notice how yields on shorter-term Treasury securities moved up.  These shifts explain the negative annual returns on bonds of shorter maturities and positive returns on bonds of longer maturities.
  • The Yield Curve got flatter over the past year.  The Fed’s activities have increased short-term yields without much effect on longer-term bond yields.  Generally, longer yields are driven by the expectation of future short-term interest rates and inflation.  Today’s Yield Curve implies lower interest rates in the future – quite different from both the announced goal of the Fed and what is usually experienced in a robust economy.


It’s common for investors to feel nervous when looking at investments by themselves. Are you saving enough? Are you saving in the right place? Are you holding the right mix of investments? Should you own individual stocks or funds? Are you paying too much in fees? What are you actually paying in fees? For the average investor, this is enough uncertainty to make someone feel uncomfortable, and this isn’t even the whole picture.

Dealing with a pension can seem daunting too. How does my retirement date affect my payout? When should I claim my benefit? Should I take the lump sum or the annuity? What, if any, survivorship benefit should I select? The same goes for Social Security:  When should I collect? When should my spouse collect? Will I get the full amount promised to me once I retire?

Any of these items, in a silo, is enough to make an investor nervous. Add them together and you get anxiety. When investors are nervous, they are more likely to make mistakes. That’s where Rockbridge comes in. We can help you answer these questions by framing your financial decisions in a comprehensive financial plan.

Numerous studies have shown investors harm themselves when they act impulsively. This boils down to investors holding cash because they are afraid of the market declining. This may be when the market is at an all-time high and they’re afraid of a correction, or when the market is rapidly falling and the person is worried it will go to 0.

In reality, neither is certain and no one knows what the next day will entail. However, we do know markets go up over time, and every day you hold cash is a day you’re missing out on the next incremental gain.

As advisors, we’ve found investors are less likely to make mistakes or act impulsively when they see their investments as part of a larger plan. Knowing the role each piece of the puzzle plays is helpful in reducing the stresses of personal finance, and makes one more likely to adhere to a course of action that is in the person’s best interest. It can be hard to forego income when you’re middle aged, but understanding the benefit of saving in your 401(k) makes this more doable.

Perhaps a family has a large fixed pension that, combined with Social Security, covers all their living expenses right as they retire. Their investment savings will become important over time as inflation erodes the value of the fixed pension. Knowing this helps a family stay the course when the stock market is volatile.

Alternatively, a person might need to rely heavily on their portfolio in their early 60s while they wait to take Social Security and receive a small inheritance. This investor will want a less risky allocation to protect against large declines in the stock market. They should also stick with their plan and not pursue a riskier allocation because they think the market is about to shoot up. This person’s portfolio plays a much different role than the portfolio of the family in the previous paragraph, despite being close in age.

This is all not to say plans can’t change. For example:  Someone is 68 and delaying their Social Security to claim a larger benefit; if the stock market drops 50%, the course of action giving them the highest probability of success might be to claim Social Security now and not draw down on an investment account while stocks are at depressed levels. These decisions shouldn’t be done impulsively. They should be well thought out and analyzed with mathematical probabilities to ensure that an unemotional, best course of action is being pursued.

No commentary or article you read is going to be perfectly relevant to you because every situation is unique. Investors are best served when they have a plan they buy into that addresses all facets of their financial life. This improves mental well-being and helps families avoid mistakes that can be costly. Rockbridge can help you look at the whole picture and guide you in making the important financial decisions.


The markets have seen several ups and downs over the years, but remember – Volatility is normal. At Rockbridge, we believe financial advisors play a vital role in helping you understand what you can control while providing expertise, perspective and encouragement to keep you focused on your long-term goal. We are here to help you tune out the noise.

Check out this insightful video that our friends at Dimensional Funds Advisors put together!

Yesterday evening, Rockbridge’s own Ethan Gilbert, CFA was featured on our local Spectrum news network. Check out the interview below where Ethan discusses the recent market shifts, how these swings can affect your retirement accounts, and how to protect your accounts from this volatility.


Click here to learn more about Ethan!

This past weekend, the New England Patriots did it again. Down 10 in the 4th, star quarterback Tom Brady orchestrated two scoring drives to pull off another comeback victory. In two weekends, the Pats will try to win their 3rd Super Bowl in 4 years – headlining a host of impressive statistics dating back to 2001.

But as loyal CNYers, we know this run will come to an end. Brady, already 40 years old, will age, coach Belichik will retire, and the Bills and Giants will once again meet in the Super Bowl.

We’ve seen it in other sports: The UCLA Bruins under Wooden, the Celtics with Bill Russell, and the Yankees in the 1950s. Teams have great runs, but sooner or later they have losing records. This pattern transcends most facets of life. When we perceive something to be at a peak, we say it’s only a matter of time before it’s worse than it is today.

The stock market doesn’t play by these rules. It’s normal to think because the market is at an all-time high it must go down, but it mustn’t. The stock market and the Patriots have enjoyed similar recent success, but they will have different futures.

Markets go up over time. Since 1978, we’ve had 40 “year-ends.” Money invested in the S&P 500 has hit a new end-of-year-high in 27 of those 40 years. Having the stock market trading at or near an all-time high isn’t cause for panic; it’s common!

We just hit our sixth consecutive year of a new high. This is a great stretch, but in the 80s and 90s we saw runs of eight and nine years respectively. The current run could last for 12 years, or it could end this next year.

No one knows for sure what the market will do, but cash is a poor long-term investment and the stock market has rewarded those who stuck with it through the ups and downs. $1 invested 40 years ago is worth $80 today.

While markets go up over time, they do have temporary periods of declines. As investors, we need to determine the right diversified mix of stocks and bonds that allows us to benefit from being invested while protecting us when times are bad.

And when the stock market inevitably performs poorly, Tom Brady will be jealous. For unlike Mr. Brady, the stock market’s best days are still to come, but Brady is better now than he will be at 45. Well it’s Tom Brady, let’s say 50 to be safe.

Stock Markets

Returns from various stock market indices over several periods ending December 31, 2017 are shown below. The past quarter was good for stocks – REITs lagged. Over the past year, returns from stock indices, especially emerging markets, were well above longer- term averages.  Over longer periods, domestic market indices were well above those of non-domestic markets, which tells us nothing about what we’ll see over the next ten years.


Bond Markets

Yields are up at the short end in response to the Fed increasing interest rates; yields at the longer end are down a bit.  Yields and bond prices are inversely related (when yields go up, prices come down and vice versa).  These changing yields explain negative bond returns for short-term bonds; positive returns for bonds of longer maturities.

Today’s Yield Curve is flatter.  The Fed can control only short-term rates; long-term yields generally reflect market expectations for future interest rates and inflation.  Falling yields are consistent with the expectation that the Fed will have difficulty increasing interest rates down the road or reduce inflation – a precursor for a difficult economic environment, which seems inconsistent with today’s economy.


Happy New Year! Now that 2017 is a wrap, one of the best presents you can bestow on yourself and your loved ones is the gift of proper preparation for the rest of the year. Want to get a jump-start on it? Here are 10 financial best practices to energize your wealth management efforts.


  1. Save today for a better retirement tomorrow. Are you maxing out pre-tax contributions to your company retirement plan? Taking full advantage of your and your spouse’s company retirement plans is an important, tax-advantaged way to save for retirement, especially if your employer matches some of your contributions with “extra” money. And, by the way, if you are 50 or older, you may be able to make additional “catch-up contributions” to your plan, to further accelerate your retirement-ready investing.
  2. Verify your valuables are still covered. Most households have insurance: home, auto, life … maybe disability and/or umbrella. But when is the last time you’ve checked to see if these policies remain right for you? Over time, it’s easy to end up with gaps or overlaps, like too much or not enough coverage, deductibles that warrant a fresh take, or beneficiaries who need to be added or removed. If you’ve not performed an insurance “audit” recently, there’s no time like the present to cross this one off your list.
  3. Get a grip on your debt load. Investment returns will only take you so far if excessive debt is weighing you down. Prioritize paying down high-interest credit cards and similar high-cost debt first, and at least meeting minimums on the rest. You may also want to revisit whether you still hold the best credit cards for your circumstances. Do the interest rates, incentives, protections and other perks still reflect your needs? Ditto on that for your home loan.
  4. Check up on your credit reports. Speaking of those credit cards, have you been periodically requesting your free annual credit report from each of the three primary credit reporting agencies? Be sure to use AnnualCreditReport.com for this purpose, as it’s the only federally authorized source for doing so. By staggering your requests – submitting to one agency every fourth months – you can keep an ongoing eye on your credit, which seems especially important in the wake of last summer’s Equifax breach.
  5. Get a bead on your budget. How much did you spend in 2017? How much do you intend to spend in the year ahead? After current spending, can you still afford to fund your future plans? Do you have enough set aside in a rainy day fund to cover the inevitable emergencies? These days, there are apps available to help you answer these important questions. Mint.com is one such popular app.
  6. Get ready for tax time … with a twist. While income tax reform looms large in the U.S., the changes won’t apply to 2017 taxes (due by April 17, 2018). Still, there are the usual tax-planning activities to tackle: gathering receipts and reports, making prior-year contributions, wrapping up business revenue and expenses if you’re a business owner, funding or drawing down retirement accounts, and more. Plus, there now may be tax planning opportunities or challenges to consider as the new laws take effect in 2018. You may want to fire up those tax-planning engines on the early side this time around.
  7. Give your investments a good inspection. Where do you stand with your personal wealth? Do you have an investment strategy to see you through? Does your portfolio reflect your personal goals and risk tolerances? If you experienced strong growth in 2017, is it time to lock in some of those gains by rebalancing your portfolio to its original mix? While investment management is a marathon of patient perspective rather than a short-sighted sprint of mad dashes, a new year makes this as good a time as any to review the terrain.
  8. Ensure your estate plans are current. Do you have wills and/or trusts in place for you and your loved ones? If so, when is the last time you took a look at them? Your family may have experienced births, deaths, marriages or divorces. Dependents may have matured. You may have acquired or sold business interests, and added new assets or let go of old ones. Your original intentions may have changed, or government regulations may have changed them for you. For all these reasons and more, it’s worth revisiting your estate plans annually.
  9. Have a look at your healthcare directives. As healthcare becomes increasingly complex, advance directives (living wills) play an increasingly vital role in ensuring your healthcare wishes are met should you be unable to express them when the need arises. Don’t leave your loved ones unaware of and/or unable to act on your critical-care or end-of-life preferences. If you don’t already have a strong living will in place, Aging with Dignity’s Five Wishes is one helpful place to learn more.
  10. Give your newly adult children the gift of continued care. Have any of your children turned 18 recently? You may send them off to college or a career, assuming you can still be there for them should an emergency arise. Be forewarned! If you don’t have the legal paperwork in place, healthcare providers and others may be unable to respond to your requests or even discuss your adult child’s personal information with you. To remain involved in their healthcare interests, you’ll want to have a healthcare power of attorney, durable power of attorney and HIPAA authorization in place. It may also be prudent to establish education record release authorizations while you’re at it.


NEXT STEPS IN THE NEW YEAR

We get it. Life never stops. The holiday season can be a busy time that often spills right into the New Year. Don’t despair if you can’t get to all ten of these tidbits at once. Take on one each month, and you’ll still have a couple of months to spare before we’re ringing in 2019.

Better yet, don’t go it alone. Let us know if we can help you turn your financial planning jump-start into a mighty wealth management leap. It begins with an exploratory conversation.


We’re coming in for a landing on our alphabetic run-down of behavioral biases. Today, we’ll present the final line-up: sunk cost fallacy and tracking error regret.

SUNK COST FALLACY

What is it? Sunk cost fallacy makes it harder for us to lose something when we also face losing the time, energy or money we’ve already put into it. In “Why Smart People Make Big Money Mistakes,” Gary Belsky and Thomas Gilovich describe: “[Sunk cost fallacy] is the primary reason most people would choose to risk traveling in a dangerous snowstorm if they had paid for a ticket to an important game or concert, while passing on the trip if they had been given the ticket for free.” You’re missing or attending the same event either way. But if a sunk cost is involved, it somehow makes it more difficult to let go, even if you would be better off without it.

When is it helpful? When a person, project or possession is truly worth it to you, sunk costs – the blood, sweat, tears and/or legal tender you’ve already poured into them – can help you take a deep breath and soldier on. Otherwise, let’s face it. There might be those days when you’d be tempted to help your kids pack their “run away from home” bags yourself.

When is it harmful? Falling for financial sunk cost fallacy is so common, there’s even a cliché for it: throwing good money after bad. There’s little harm done if the toss is a small one, such as attending a prepaid event you’d rather have skipped. But in investing, adopting a sunk cost mentality – “I can’t unload this until I’ve at least broken even” – can cost you untold real dollars by blinding you from selling at a loss when it is otherwise the right thing to do. The most rational investment strategy acknowledges we cannot control what already has happened to our investments; we can only position ourselves for future expected returns, according to the best evidence available to us at the time.

TRACKING ERROR REGRET

What is it? If you’ve ever decided the grass is greener on the other side, you’ve experienced tracking error regret – that gnawing envy you feel when you compare yourself to external standards and you wish you were more like them.

When is it helpful? If you’re comparing yourself to a meaningful benchmark, tracking error-regret can be a positive force, spurring you to try harder. Say, for example, you’re a professional athlete and you’ve been repeatedly losing to your peers. You may be prompted to embrace a new fitness regimen, rethink your equipment, or otherwise strive to improve your game.

When is it harmful? If you’ve structured your investment portfolio to reflect your goals and risk tolerances, it’s important to remember that your near-term results may frequently march out of tune with “typical” returns … by design. It can be deeply damaging to your long-range plans if you compare your own performance to irrelevant, apples-to-oranges benchmarks such as the general market, the latest popular trends, or your neighbor’s seemingly greener financial grass. Stop playing the shoulda, woulda, coulda game, chasing past returns you wish you had received based on random outperformance others (whose financial goals differ from yours) may have enjoyed. You’re better off tending to your own fertile possibilities, guided by personalized planning, evidence-based investing, and accurate benchmark comparisons.

We’ve now reached the end of our alphabetic overview of the behavioral biases that most frequently lead investors astray. In a final installment, we’ll wrap with a concluding summary. Until then, no regrets!

So many financial behavioral biases, so little time! Today, let’s take a few minutes to cover our next batch of biases: overconfidence, pattern recognition and recency.

OVERCONFIDENCE

What is it? No sooner do we recover from one debilitating bias, our brain can whipsaw us in an equal but opposite direction. For example, we’ve already seen how fear on the one hand and greed on the other can knock investors off course either way. Similarly, overconfidence is the flip side of loss aversion. Once we’ve got something, we don’t want to lose it and will overvalue it compared to its going rate. But when we are pursuing fame or fortune, or even going about our daily lives, we tend to be overconfident about our odds of success.

When is it helpful? In “Your Money & Your Brain,” Jason Zweig cites several sources that describe overconfidence in action and why it’s the norm rather than the exception in our lives. “How else could we ever get up the nerve to ask somebody out on a date, go on a job interview, or compete in a sport?” asks Zweig, and adds: “There is only one major group whose members do not consistently believe they are above average: people who are clinically depressed.”

When is it harmful? While overconfidence can be generally beneficial, it becomes dangerous when you’re investing. Interacting with a host of other biases (such as greed, confirmation bias and familiarity bias) overconfidence puffs up our belief that we can consistently beat the market by being smarter or luckier than average. In reality, when it’s you, betting against the trillions and trillions of other dollars at play in our global markets, it’s best to be brutally realistic about how to patiently participate in the market’s expected returns, instead of trying to go for broke – potentially literally.

PATTERN RECOGNITION

What is it? Is that a zebra, a cheetah or a light breeze moving through the grass? Since prehistoric times when our ancestors depended on getting the right answer, right away, evolution has been conditioning our brains to find and interpret patterns – or else. That’s why, our pattern-seeking impulses tend to treat even random events (like 10 coin flips, all heads) as if they’re orderly outcomes suggesting a predictive pattern. “Just as nature abhors a vacuum, people hate randomness,” says Zweig, as a result of our brain’s dopamine-induced “prediction addiction.

When is it helpful? Had our ancestors failed at pattern recognition, we wouldn’t be here to speak of it, and we still make good use of it today. For example, we stop at red lights and go when they’re green. Is your spouse or partner giving you “that look”? You know just what it means before they’ve said a single word. And whether you enjoy a good jigsaw puzzle, Sudoku, or Rubik’s Cube, you’re giving your pattern recognition skills a healthy workout.

When is it harmful? Speaking of seeing red, Zweig recently published a fascinating piece on how simply presenting financial numbers in red instead of black can make investors more fearful and risk-averse. That’s a powerful illustration of how pattern recognition can influence us – even if the so-called pattern (red = danger) is a red herring. Is any given stream of breaking financial news a predictive pattern worth pursuing? Or is it simply a deceptive mirage? Given how hard it is to tell the difference (until hindsight reveals the truth), investors are best off ignoring the market’s many glittering distractions and focusing instead on their long-term goals.

RECENCY

What is it? Recency causes you to pay more attention to your most recent experiences, and to downplay the significance of long-term conditions. For example, in “Nudge,” Nobel laureate Richard Thaler and co-author Cass Sunstein observe: “If floods have not occurred in the immediate past, people who live on floodplains are far less likely to purchase insurance.” That’s recency, tricking people into ascribing more importance to the lack of recent flooding than to the bigger context of being located on a flood plain.

When is it helpful? In “Stumbling on Happiness,” Daniel Gilbert describes how we humans employ recency to accurately interpret otherwise ambiguous situations. Say, for example, someone says to you, “Don’t run into the bank!” Whether your most recent experience has been floating down a river or driving toward the commerce district helps you quickly decide whether to paddle harder or walk more carefully through the door.

When is it harmful? Of course buying high and selling low is exactly the opposite of investors’ actual aspirations. And yet, no matter how many times our capital markets have moved through their bear-and-bull cycles, recency causes droves of investors to stumble every time. By reacting to the most recent jolts instead of remaining positioned as planned for long-term expected growth, they end up piling into high-priced hot holdings and locking in losses by selling low during the downturns. They allow recency to get the better of them … and their most rational, evidence-based investment decisions.

We’re on the home stretch of our series on behavioral biases. Look for the rest of the alphabet soon.

Have you caught cryptocurrency fever, or are you at least wondering what it’s all about? Odds are, you hadn’t even heard the term until recently. Now, it seems as if everybody and their cousin are getting in on it.

Psychologists have assigned a term to the angst you might be feeling in the heat of the moment. It’s called “FoMO” or Fear of Missing Out. Education is the best first step toward facing FoMo and making informed financial choices that are right for you. So before you make any leaps, let’s take a closer look.

What is cryptocurrency?

Crytpocurrency is essentially a kind of money – or currency. Thanks to electronic security – or encryption – it exists in a presumably secure, sound and limited supply. Pair the “encryption” with the “currency,” and you’ve got a new kind of digital asset, or electronic exchange.

Well, sort of new. Cryptocurrency was introduced in 2009, supposedly by a fellow named Satoshi Nakamoto. His Wikipedia entry suggests he may not actually be who he says he is, but minor mysteries aside, he (or possibly “they”) is credited with designing and implementing bitcoin as the first and most familiar cryptocurrency. Ethereum is currently its second-closest competitor, with plenty of others vying for space as well (more than 1,300 as of early December 2017), and plenty more likely to come.

Unlike a dollar bill or your pocket change, cryptocurrency exists strictly as computer code. You can’t touch it or feel it. You can’t flip it, heads or tails. But increasingly, holders are receiving, saving and spending their cryptocurrency in ways that emulate the things you can do with “regular” money.

How does cryptocurrency differ from “regular” money?

In comparing cryptocurrency to regulated fiat currency – or most countries’ legal tender – there are a few observations of note.

First, since neither fiat nor cryptocurrency are still directly connected to the value of an underlying commodity like gold or silver, both must have another way to maintain their spending power in the face of inflation.

For legal tender, most countries’ central banks keep their currency’s spending power relatively stable. For cryptocurrency, there is no central bank, or any other centralized repository or regulator. Its stability is essentially backed by the strength of its underlying ledger, or blockchain, where balances and transactions are verified and then publicly reported.

The notion of limited supply factors in as well. Obviously, if everyone had an endless supply of money, it would cease to have any value to anyone. That’s why central banks (such as the U.S. Federal Reserve, the Bank of Canada, and the Bank of England) are in charge of stabilizing the value of their nation’s legal tender, regularly seeking to limit supply without strangling demand.

While cryptocurrency fans offer explanations for how its supply and demand will be managed, it’s not yet known how effective the processes will be in sustaining this delicate balance, especially when exuberance or panic-driven runs might outpace otherwise orderly procedures. (If you’re technically inclined and you’d like to take a deep dive into how the financial technology operates, here’s one source to start with.)

Why would anyone want to use cryptocurrency instead of legal tender?  

For anyone who may not be a big fan of government oversight, the processes are essentially driven “by and for the people” as direct peer-to-peer exchanges with no central authorities in charge. At least in theory, this is supposed to allow the currency to flow more freely, with less regulation, restriction, taxation, fee extraction, limitations and similar machinations. Moreover, cryptocurrency transactions are anonymous.

If the world were filled with only good, honest people, cryptocurrency and its related technologies could represent a better, more “boundary-less” system for more freely doing business with one another, with fewer of the hassles associated with international commerce.

Unfortunately, in real life, this sort of unchecked exchange can also be used for all sorts of mischief – like dodging taxes, laundering money or funding terrorism, to name a few.

In short, cryptocurrency, blockchain technology, and/or their next-generations could evolve into universal tools with far wider application. Indeed, such explorations already are under way. In December 2017, Vanguard announced collaborative efforts to harness blockchain technology for improved index data sharing.

That said, many equally promising prospects have ended up discarded in the dustbin of interesting ideas that might have been. Time will tell which of the many possibilities that might happen actually do.

Even if I don’t plan to use cryptocurrency, should I hold some as an investment? 

If you do jump in at this time, know you are more likely speculating than investing, with current pricing resembling a fast-forming bubble destined for collapse.

Bubble or not, there are at least two compelling reasons you may want to sit this one out for now. First, there are a lot of risks inherent to the cryptocurrency craze. Second, cryptocurrency simply doesn’t fit into our principles of evidence-based investing … at least not yet.

Let’s take a look at the risks.

Regulatory Risks – First, there’s the very real possibility that governments may decide to pile mountains of regulatory road blocks in front of this currently free-wheeling freight train. Some countries have already banned cryptocurrency. Others may require extra reporting or onerous taxes. These and other regulations could severely impact the liquidity and value of your coinage.

Security Risks – There’s also the ever-present threat of being pickpocketed by cyberthieves. It’s already happened several times, with millions of dollars of value swiped into thin air. Granted, the same thing can happen to your legal tender, but there is typically far more government protection and insurance coverage in place for your regulated accounts.

Technological Risks – As we touched on above, a system that was working pretty well in its development days has been facing some serious scaling challenges. As demand races ahead of supply, the human, technical and electric capital required to keep everything humming along is under stress. One recent post estimated that if bitcoin technology alone continues to grow apace, by February 2020, it will suck away more electricity than the entire world uses today.

That’s a lot of potential buzzkill for your happily-ever-after bitcoin holdings, and one reason you might want to think twice before you pile your life’s savings into them.

Then again, every investment carries some risk. If there were no risk, there’d be no expected return. That’s why we also need to address what evidence-based investing looks like. It begins with how investors (versus speculators) evaluate the markets.

What’s a bitcoin worth? A dollar? $100? $100,000? The answer to that has been one of the most volatile bouncing balls the market has seen since tulip mania in the 1600s.

In his ETF.com column “Bitcoin & Its Risks,” financial author Larry Swedroe summarizes how market valuations occur. “With stocks,” he says, “we can look at valuation metrics, like earnings yield. With bonds, we can use the current yield-to-maturity. And with assets like reinsurance or lending … we have historical evidence to make the appropriate estimates.”

You can’t do any of these things with cryptocurrency. Swedroe explains: “There simply is no tangible relationship between any economic or financial parameters and bitcoin prices.” Instead, there are several ways buying cryptocurrency differs from investing:

  • Evidence-based investing calls for estimating an asset’s expected return, based on these kinds of informed fundamentals.
  • Evidence-based investing also calls for us to factor in how different asset classes interact with one another. This helps us fit each piece into a unified portfolio that we can manage according to individual goals and risk tolerances.
  • Evidence-based investing calls for a long-term, buy, hold and rebalance strategy.

Cryptocurrency simply doesn’t yet synch well with these parameters. It does have a price, but it can’t be effectively valued for planning purposes, especially amidst the extreme price swings we’re seeing of late.

What if I decide to buy some cryptocurrency anyway?

We get it. Even if it’s far more of a speculative than investment endeavor, you may still decide to give cryptocurrency a go, for fun or potential profit. If you do, here are some tips to consider:

  • Think of it as being on par with an entertaining trip to the casino. Nothing ventured, nothing gained – but don’t venture any more than you can readily afford to lose!
  • Use only “fun money,” outside the investments you’re managing to fund your ongoing lifestyle.
  • Educate yourself first, and try to pick a reputable platform from which to play. (CoinDesk offers a pretty good bitcoin primer.)
  • If you do strike it rich, regularly remove a good chunk of the gains off the table to invest in your managed portfolio. That way, if the bubble bursts, you won’t lose everything you’ve “won.” (Also set aside enough to pay any taxes that may be incurred.)

Last but not least, good luck. Whether you win or lose a little or a lot with cryptocurrency – or you choose to only watch it from afar for now – we remain available to assist with your total wealth, come what may.


There are so many investment-impacting behavioral biases, we could probably identify at least one for nearly every letter in the alphabet. Today, we’ll continue with the most significant ones by looking at: hindsight, loss aversion, mental accounting and outcome bias.

HINDSIGHT

What is it? In “Thinking, Fast and Slow,” Nobel laureate Daniel Kahneman credits Baruch Fischhoff for demonstrating hindsight bias – the “I knew it all along” effect – when he was still a student. Kahneman describes hindsight bias as a “robust cognitive illusion” that causes us to believe our memory is correct when it is not. For example, say you expected a candidate to lose, but she ended up winning. When asked afterward how strongly you predicted the actual outcome, you’re likely to recall giving it higher odds than you originally did. This seems like something straight out of a science fiction novel, but it really does happen!

When is it helpful? Similar to blind spot bias (one of the first biases we covered) hindsight bias helps us assume a more comforting, upbeat outlook in life. As “Why Smart People Make Big Money Mistakes” authors Gary Belsky and Thomas Gilovich describe it, “We humans have developed sneaky habits to look back on ourselves in pride.” Sometimes, this causes no harm, and may even help us move past prior setbacks.

When is it harmful? Hindsight bias is hazardous to investors, since your best financial decisions come from realistic assessments of market risks and rewards. As Kahneman explains, hindsight bias “leads observers to assess the quality of a decision not by whether the process was sound but by whether its outcome was good or bad.” If a high-risk investment happens to outperform, but you conveniently forget how risky it truly was, you may load up on too much of it and not be so lucky moving forward. On the flip side, you may too quickly abandon an underperforming holding, deceiving yourself into dismissing it as a bad bet to begin with.

LOSS AVERSION

What is it? “Loss aversion” is a fancy way of saying we often fear losing more than we crave winning, which leads to some interesting results when balancing risks and rewards. For example, in “Stumbling on Happiness,” Daniel Gilbert describes: “[M]ost of us would refuse a bet that gives us an 85 percent chance of doubling our life savings and a 15 percent chance of losing it.” Even though the odds favor a big win, imagining that slight chance that you might go broke leads most people to decide it’s just not worth the risk.

When is it helpful? To cite one illustration of when loss aversion plays in your favor, consider the home and auto insurance you buy every year. It’s unlikely your house will burn to the ground, your car will be stolen, or an act of negligence will cost you your life’s savings in court. But loss aversion reminds us that unlikely does not mean impossible. It still makes good sense to protect against worst-case scenarios when we know the recovery would be very painful indeed.

When is it harmful? One way loss aversion plays against you is if you decide to sit in cash or bonds during bear markets – or even when all is well, but a correction feels overdue. The evidence demonstrates that you are expected to end up with higher long-term returns by at least staying put, if not bulking up on stocks when they are “cheap.” And yet, the potential for future loss can frighten us into abandoning our carefully planned course toward the likelihood of long-term returns.

MENTAL ACCOUNTING

What is it? If you’ve ever treated one dollar differently from another when assessing its worth, that’s mental accounting at play. For example, if you assume inherited money must be more responsibly managed than money you’ve won in a raffle, you’re engaging in mental accounting.

When is it helpful? In his early paper, “Mental Accounting Matters,” Nobel laureate Richard Thaler (who is credited for having coined the term), describes how people use mental accounting “to keep trace of where their money is going, and to keep spending under control.” For example, say you set aside $250/month for a fun family outing. This does not actually obligate you to spend the money as planned or to stick to your budget. But by effectively assigning this function to that money, you’re better positioned to enjoy your leisure time, without overdoing it.

When is it harmful? While mental accounting can foster good saving and spending habits, it plays against you if you instead let it undermine your rational investing. Say, for example, you’re emotionally attached to a stock you inherited from a beloved aunt. You may be unwilling to unload it, even if reason dictates that you should. You’ve just mentally accounted your aunt’s bequest into a place that detracts from rather than contributes to your best financial interests.

OUTCOME BIAS

What is it? Sometimes, good or bad outcomes are the result of good or bad decisions; other times (such as when you try to forecast future market movements), it’s just random luck. Outcome bias is when you mistake that luck as skill.

When is it helpful? This may be one bias that is never really helpful in the long run. If you’ve just experienced good or bad luck rather than made a smart or dumb decision, when wouldn’t you want to know the difference, so you can live and learn?

When is it harmful? As Kahneman describes in “Thinking, Fast and Slow,” outcome bias “makes it almost impossible to evaluate a decision properly – in terms of the beliefs that were reasonable when the decision was made.” It causes us to be overly critical of sound decisions if the results happen to disappoint. Conversely, it generates a “halo effect,” assigning undeserved credit “to irresponsible risk seekers …who took a crazy gamble and won.” In short, especially when it’s paired with hindsight bias, this is dangerous stuff in largely efficient markets. The more an individual happens to come out ahead on lucky bets, the more they may mistakenly believe there’s more than just luck at play.

You’re now more than halfway through our alphabetic series of behavioral biases. Look for our next piece soon.


Let’s continue our alphabetic tour of common behavioral biases that distract otherwise rational investors from making best choices about their wealth. Today, we’ll tackle: fear, framing, greed and herd mentality.

FEAR

What is it? You know what fear is, but it may be less obvious how it works. As Jason Zweig describes in “Your Money & Your Brain,” if your brain perceives a threat, it spews chemicals like corticosterone that “flood your body with fear signals before you are consciously aware of being afraid.” Some suggest this isn’t really “fear,” since you don’t have time to think before you act. Call it what you will, this bias can heavily influence your next moves – for better or worse.

When is it helpful? Of course there are times you probably should be afraid, with no time for studious reflection about a life-saving act. If you are reading this today, it strongly suggests you and your ancestors have made good use of these sorts of survival instincts many times over.

When is it harmful? Zweig and others have described how our brain reacts to a plummeting market in the same way it responds to a physical threat like a rattlesnake. While you may be well-served to leap before you look at a snake, doing the same with your investments can bite you. Also, our financial fears are often misplaced. We tend to overcompensate for more memorable risks (like a flash crash), while ignoring more subtle ones that can be just as harmful or much easier to prevent (like inflation, eroding your spending power over time). 

FRAMING

What is it? Thinking, Fast and Slow,” Nobel laureate Daniel Kahneman defines the effects of framing as follows: “Different ways of presenting the same information often evoke different emotions.” For example, he explains how consumers tend to prefer cold cuts labeled “90% fat-free” over those labeled “10% fat.” By narrowly framing the information (fat-free = good, fat = bad; never mind the rest), we fail to consider all the facts as a whole.

When is it helpful? Have you ever faced an enormous project or goal that left you feeling overwhelmed? Framing helps us take on seemingly insurmountable challenges by focusing on one step at a time until, over time, the job is done. In this context, it can be a helpful assistant.

When is it harmful? To achieve your personal financial goals, you’ve got to do more than score isolated victories in the market; you’ve got to “win the war.” As UCLA’s Shlomo Benartzi describes in a Wall Street Journal piece, this demands strategic planning and unified portfolio management, with individual holdings considered within the greater context. Investors who instead succumb to narrow framing often end up falling off-course and incurring unnecessary costs by chasing or fleeing isolated investments.

GREED

What is it? Like fear, greed requires no formal introduction. In investing, the term usually refers to our tendency to (greedily) chase hot stocks, sectors or markets, hoping to score larger-than-life returns. In doing so, we ignore the oversized risks typically involved as well.

When is it helpful? In Oliver Stone’s Oscar-winning “Wall Street,” Gordon Gekko (based on the notorious real-life trader Ivan Boesky) makes a valid point … to a point: “[G]reed, for lack of a better word, is good. … Greed, in all of its forms; greed for life, for money, for love, knowledge has marked the upward surge of mankind.” In other words, there are times when a little greed – call it ambition – can inspire greater achievements.

When is it harmful? In our cut-throat markets (where you’re up against the Boeskys of the world), greed and fear become a two-sided coin that you flip at your own peril. Heads or tails, both are accompanied by chemical responses to stimuli we’re unaware of and have no control over. Overindulging in either extreme leads to unnecessary trading at inopportune times.

HERD MENTALITY

What is it? Mooove over, cows. You’ve got nothing on us humans, who instinctively recoil or rush headlong into excitement when we see others doing the same. “[T]he idea that people conform to the behavior of others is among the most accepted principles of psychology,” say Gary Belsky and Thomas Gilovich in “Why Smart People Make Big Money Mistakes.”

When is it helpful? If you’ve ever gone to a hot new restaurant, followed a fashion trend, or binged on a hit series, you’ve been influenced by herd mentality. “Mostly such conformity is a good thing, and it’s one of the reasons that societies are able to function,” say Belsky and Gilovich. It helps us create order out of chaos in traffic, legal and governmental systems alike.

When is it harmful? Whenever a piece of the market is on a hot run or in a cold plunge, herd mentality intensifies our greedy or fearful chain reaction to the random event that generated the excitement to begin with. Once the dust settles, those who have reacted to the near-term noise are usually the ones who end up overpaying for the “privilege” of chasing or fleeing temporary trends instead of staying the course toward their long-term goals. As Warren Buffett has famously said, “Investors should remember that excitement and expenses are their enemies. And if they insist on trying to time their participation in equities, they should try to be fearful when others are greedy and greedy only when others are fearful.”

Well said, Mr. Buffett! We’ve got more behavioral biases to cover in upcoming installments, so stay tuned.


Welcome back to our “ABCs of Behavioral Biases.” Today, we’ll get started by introducing you to four self-inflicted biases that knock a number of investors off-course: anchoring, blind spot, confirmation and familiarity bias.

ANCHORING BIAS

What is it?  Anchoring bias occurs when you fix on or “anchor” your decisions to a reference point, whether or not it’s a valid one.

When is it helpful?  An anchor point can be helpful when it is relevant and contributes to good decision-making. For example, if you’ve set a 10 pm curfew for your son or daughter and it’s now 9:55 pm, your offspring would be wise to panic a bit, and step up the homeward pace.

When is it harmful?  In investing, people often anchor on the price they paid when deciding whether to sell or hold a security: “I paid $11/share for this stock and now it’s only worth $9/share. I’ll hold off selling it until I’ve broken even.” This is an example of anchoring bias in disguise. Evidence-based investing informs us, the best time to sell a holding is when it’s no longer serving your ideal total portfolio, as prescribed by your investment plans. What you paid is irrelevant to that decision, so anchoring on that arbitrary point creates a dangerous distraction. 

BLIND SPOT BIAS

What is it?  Blind spot bias occurs when you can objectively assess others’ behavioral biases, but you cannot recognize your own.

When is it helpful?  Blind spot bias helps you avoid over-analyzing your every imperfection, so you can get on with your one life to live. It helps you tell yourself, “I can do this,” even when others may have their doubts.

When is it harmful?  It’s hard enough to root out all your deep-seated biases once you’re aware of them, let alone the ones you remain blind to. In “Thinking, Fast and Slow,” Nobel laureate Daniel Kahneman describes (emphasis ours): “We are often confident even when we are wrong, and an objective observer is more likely to detect our errors than we are.” (Hint: This is where second opinions from an independent advisor can come in especially handy.)

CONFIRMATION BIAS

What is it?  We humans love to be right and hate to be wrong. This manifests as confirmation bias, which tricks us into being extra sympathetic to information that supports our beliefs and especially suspicious of – or even entirely blind to – conflicting evidence.

When is it helpful?  When it’s working in our favor, confirmation bias helps us build on past insights to more readily resolve new, similar challenges. Imagine if you otherwise had to approach each new piece of information with no opinion, mulling over every new idea from scratch. While you’d be a most open-minded person, you’d also be a most indecisive one.

When is it harmful?  Once we believe something – such as an investment is a good/bad idea, or a market is about to tank or soar – we want to keep believing it. To remain convinced, we’ll tune out news that contradicts our beliefs and tune into that which favors them. We’ll discount facts that would change our mind, find false affirmation in random coincidences, and justify fallacies and mistaken assumptions that we would otherwise recognize as inappropriate. And we’ll do all this without even knowing it’s happening. Even stock analysts may be influenced by this bias.

FAMILIARITY BIAS

What is it?  Familiarity bias is another mental shortcut we use to more quickly trust (or more slowly reject) an object that is familiar to us.

When is it helpful?  Do you cheer for your home-town team? Speak more openly with friends than strangers? Favor a job applicant who (all else being equal) has been recommended by one of your best employees? Congratulations, you’re making good use of familiarity bias.

When is it harmful?  Considerable evidence tells us that a broad, globally diversified approach best enables us to capture expected market returns while managing the risks involved. Yet studies like this one have shown investors often instead overweight their allocations to familiar vs. foreign investments. We instinctively assume familiar holdings are safer or better, even though, clearly, we can’t all be correct at once. We also tend to be more comfortable than we should be bulking up on company stock in our retirement plan.

Ready to learn more? Next, we’ll continue through the alphabet, introducing a few more of the most suspect financial behavioral biases.

By now, you’ve probably heard the news: Your own behavioral biases are often the greatest threat to your financial well-being. As investors, we leap before we look. We stay when we should go. We cringe at the very risks that are expected to generate our greatest rewards. All the while, we rush into nearly every move, only to fret and regret them long after the deed is done.

Why Do We Have Behavioral Biases?

Most of the behavioral biases that influence your investment decisions come from myriad mental shortcuts we depend on to think more efficiently and act more effectively in our busy lives.

Usually (but not always!) these short-cuts work well for us. They can be powerful allies when we encounter physical threats that demand reflexive reaction, or even when we’re simply trying to stay afloat in the rushing roar of deliberations and decisions we face every day.

What Do They Do To Us?

As we’ll cover in this series, those same survival-driven instincts that are otherwise so helpful can turn deadly in investing. They overlap with one another, gang up on us, confuse us and contribute to multiple levels of damage done.

Friend or foe, behavioral biases are a formidable force. Even once you know they’re there, you’ll probably still experience them. It’s what your brain does with the chemically induced instincts that fire off in your head long before your higher functions kick in. They trick us into wallowing in what financial author and neurologist William J. Bernstein, MD,  PhD, describes as a “Petrie dish of financially pathologic behavior,” including:

  • Counterproductive trading – incurring more trading expenses than are necessary, buying when prices are high and selling when they’re low.
  • Excessive risk-taking – rejecting the “risk insurance” that global diversification provides, instead over-concentrating in recent winners and abandoning recent losers.
  • Favoring emotions over evidence – disregarding decades of evidence-based advice on investment best practices.

What Can We Do About Them?

In this multi-part “ABCs of Behavioral Biases,” we’ll offer an alphabetic introduction to investors’ most damaging behavioral biases, so you can more readily recognize and defend against them the next time they’re happening to you.

Here are a few additional ways you can defend against the behaviorally biased enemy within:

Anchor your investing in a solid plan – By anchoring your trading activities in a carefully constructed plan (with predetermined asset allocations that reflect your personal goals and risk tolerances), you’ll stand a much better chance of overcoming the bias-driven distractions that rock your resolve along the way.

Increase your understanding – Don’t just take our word for it. Here is an entertaining and informative library on the fascinating relationship between your mind and your money:

Don’t go it alone – Just as you can’t see your face without the benefit of a mirror, your brain has a difficult time “seeing” its own biases. Having an objective advisor well-versed in behavioral finance, dedicated to serving your highest financial interests, and unafraid to show you what you cannot see for yourself is among your strongest defenses against all of the biases we’ll present throughout the rest of this series.

As you learn and explore, we hope you’ll discover: You may be unable to prevent your behavioral biases from staging attacks on your financial resolve. But, forewarned is forearmed. You stand a much better chance of thwarting them once you know they’re there!

Next week, we’ll begin our A–Z introduction to many of the most common behavioral biases.

Stock Markets

Equity market returns over several periods ending September 30, 2017 are shown on the graph to the right. Here are a few highlights:

  • Stocks provided above-average returns over the past quarter – REITs lagged.
  • Non-domestic markets led the way in recent periods; over longer periods it was domestic markets.  While it would be nice to know which will do best in the future, no one does. We have to remain committed to all markets.
  • Note how after falling short previously, emerging market stocks have snapped back in recent periods.

Bond Markets

Yield Curves show the yield of U.S. Treasury securities over several maturities, from the short term (one month) to the long term (twenty years).  How these curves have changed over the recent past is shown below.

  • Since September 2016 yields have increased across all maturities, which is not surprising given the announced goals of Fed officials. Yields and bond prices are inversely related (when yields go up, prices come down and vice versa), which explains negative bond returns over the past year.
  • Today’s Yield Curve is flatter than what we saw at the beginning of the year.  The Fed can control only short-term rates; long-term yields generally reflect market results.  A flat yield curve can indicate that the market doesn’t believe the Fed can increase rates down the road in a more difficult economic environment.  Look how yields on longer-term securities have fallen slightly even though short-term yields increased.


On August 2, 2017, the Dow Jones Industrial Average set a record, closing above 22,000 for the first time. People will debate the cause of the rally and how long it will last, but there is only one answer that matters to the prudent investor – time.

Markets go up over time. Over the last 90 years, the S&P 500 (a better gauge of the U.S. stock market than the Dow) has seen 11 “bear markets” during which the index fell by more than 20% of its value. In four of these instances, the index fell by 48% or more, with the largest fall (86%) coming during the Great Depression. Despite these large declines in value, if you had bought and held from 1927 through today, you would have realized an annualized 9.9% return. The biggest losers were not people who failed to foresee Black Tuesday, the 1973 oil embargo, the dot-com bubble, or the financial crisis. They were people who were not invested.

The stock market is notoriously difficult to predict. On August 13, 1979, Businessweek ran a famous cover story titled “The Death of Equities.” Businessweek cited inflation, changing regulation, and an increase in investment alternatives as the reason America should “regard the death of equities as a near-permanent condition.” Over the next 20 years, the Dow would grow from 839 to 11,497, and investors in the S&P 500 would receive a 17.7% annualized return.

Twenty years after the Businessweek story, Kevin Hassett and James Glassman wrote Dow 36,000, a book articulating why the Dow would triple by 2005. Hassett and Glassman argued the cost of equity should be on par with treasury yields, leading them to conclude the “single most important fact about stocks at the dawn of the twenty-first century: They are cheap… If you’re worried about missing the market’s big move upward, you will discover that it is not too late.” In January 2005, the Dow closed at 10,490. Dow 36,000 now sells used for $0.01 on Amazon.

In addition to being unprofitable, market timing is also mentally punishing. If you were to sell out of your position now and, in a year, the market was 10% higher (Dow 24,200), would you get back in or keep waiting for the fall? If, instead, it was 10% lower in a year (Dow 19,800), would you stay on the sidelines in anticipation of more declines, or would you conclude the market had bottomed out? The challenge with market timing is that you need to be right twice – when you sell and when you buy back in. And remember, these price changes don’t count the 2% annual dividend large-cap stocks are paying.

Is today’s market overvalued? Your conclusion depends on your perspective. Over the last 7.5 years the S&P 500 has seen 13.3% annualized appreciation, suggesting today’s market is overvalued. However, since 2000, it has returned 4.9%, suggesting it’s undervalued. Since 1990, the market has returned 9.6%, on par with its 90-year average.

You can play the same game with price-to-earnings (P/E) ratios. Currently, the P/E ratio of the S&P 500 is high by historical standards, suggesting the market is overvalued. However, stocks look forward, not backwards, and the forward-looking P/E ratio is slightly overvalued but much closer to “normal.” Lastly, the earnings yield of equities (P/E’s inverse) relative to yields on long-term bonds actually makes stocks look cheap. Are stocks overvalued? It’s anyone’s guess.

The Dow has reached a new high because markets go up over time. However, there are periods where they go down. If you can’t financially afford or mentally stomach a 40% or greater decline in your portfolio, you shouldn’t be 100% invested in stocks. Find a risk profile that matches your needs, diversify from the S&P 500 to other markets such as small cap stocks, international stocks, and bonds, and stick with your allocation. Trying to outsmart the market leaves most people feeling foolish.

This article by Ethan was featured in the Central New York Business Journal.

Any investor who spends even a modest amount of time reading financially-based magazine articles, or occasionally watches or listens to financially-based TV or radio programs, can’t escape all the pronouncements financial advisors make to prospective clients. So, if you are new to Rockbridge, I thought it would be fun to share a few promises with you. Here are five promises of what Rockbridge will not do with clients or prospective clients:

  1. Make Short-Term Stock Market Predictions

We don’t guess the hourly, daily, quarterly or even annual direction of the stock market or the Fed’s action on interest rates. We don’t think others should either since even the so-called experts are wildly incorrect most of the time, and when they are right, it was more likely luck, not skill.

  1. Tie Stock Market Results to Political Events or Partisan Grips on Congress or White House

While many of us have political leanings or biases of who may be better for the economy (and eventually the stock and bond markets), we don’t believe either major political party provides compelling evidence for a more healthy economy or better results for your portfolio.

  1. Make Changes to Your Portfolio Every Time the Market Swings

Volatility is inherent in the markets – so are daily fluctuations. We believe in keeping asset class target allocations within acceptable parameters, but we will not make knee-jerk reactions to events on a daily basis. Portfolio rebalancing occurs when one asset class substantially outperforms or underperforms and target weightings have a higher than acceptable variance.

  1. Select Only “Good Investments” and Avoid All Those “Bad Investments”

Far too many times I have been asked individually if I can steer someone “into just the good investments.” The fact is, we are deeply rooted in an efficient market theorem, and the best method for participation is low-cost, broad-based index components (either mutual funds or ETFs) using both long domestic and international strategies. We keep a tight handle on our portfolio models and don’t stray to the esoteric or exotic (such as short selling or options contracts) based on a hunch or gut instinct. We know that each strategy we employ will not perform identically to another – the results will rotate in and out of “desirability,” but we focus on how they perform together over long periods of time.

  1. Focus Solely Only On Your Investment Performance or Increasing Your Portfolio Size

While achieving suitable investment performance is often a vital aspect of appropriate financial planning, yearly results are not the most critical measure of a financial advisor’s value or worth to you or your family.  Meeting expected performance should be in the context of achieving your overall financial goals – there are far more important topics to be concerned with rather than losing sleep over a friend or neighbor’s investments “doing better” than your own. We enjoy robust returns as much as anyone else.  However, neglecting tax implications or appropriate insurance coverage and dismissing proper retirement planning or estate planning efforts will impact a family on a much deeper level than worrying about what everyone else is earning from their investments. Trust me, most of the time, your friends or neighbors have no idea what their actual returns are and rarely will they review an actual performance report with their advisor – much less with you.

Stock Markets

The chart at right shows stocks performing well in the past quarter and six-month periods.  Year to date, domestic large-cap stocks were up about 9% while small-cap stocks were up 5%.  Stocks traded in international developed markets and emerging markets were up 14% and about 19%, respectively.

Over three, five and ten years, domestic markets (both large-cap and small-cap) were especially strong.  These results are starting to give rise to concerns of “irrational exuberance” and over-valuation in these markets.  Keep in mind, however, we could be observing a bounce off the sharp decline of 2008, one of the worst periods in stock market history.  So, what do we have now – “over-valuation” or “regression to the mean”?  Not so much exuberance in other markets.

The usual proxy for the domestic large-cap stock market is the S&P 500, a well-worn index that many consider representative of the total stock market.  Today the S&P 500 is skewed by well-known technology companies – Apple, Microsoft, Alphabet (Google) and Amazon make up the top four stocks, with Facebook coming in at number six.  Thus, the S&P 500 is more indicative of how the largest technology stocks fared versus stocks in general.

The chart shows the extent that markets fall in and out of favor through time, which provides an incentive to try and predict.  However, this is not something we recommend.  Instead, maintain commitments to each asset class and reap the benefits of diversification.  In any event, recent periods have been generally good for stocks.

Bond Markets

The Yield Curves chart at the right yields of U.S. Treasury securities across various maturities as of June 2017, June 2016 and December 2016.  Today’s curve is more pronounced and shown in green.  Notice how it has “flattened” – long rates are down and short rates are up.  Yields have increased over the past year resulting in a negative impact on bond returns over that period.

The rise in short-term rates is consistent with recent Fed activity.  Yields on bonds of longer maturities are market determined.  It has been, and continues to be, widely anticipated that the Fed will continue to increase interest rates.  Yet, longer-term bond yields have not increased.  This flattening of the Yield Curve can be a harbinger of difficult times ahead as the market may be telling us they don’t expect the Fed will be able to increase rates.  We’ll see.

Stock values have been climbing almost uninterruptedly over the recent past.  Bonds have not.  This record is consistent with the long-held maxim that if you can stand the heat, stocks will eventually outperform bonds.  The recent track record, along with this widely held belief, has some wondering why hold bonds at all.

While stocks look good, there are still reasons to hold bonds.  First, bonds reduce volatility, which can make it easier to remain committed to a given risk strategy over the long term.  Failing to do so means not realizing the positive long-term returns of stocks.  In some periods, maintaining an allocation to bonds provides a better outcome.  (A portfolio with a 30% allocation to bonds did better than an all stock portfolio in 27% of the ten-year periods since 1926.)  Prudence means not taking unnecessary risks and matching a portfolio’s profile to established long-term goals – bonds help do that.

I often say that one of our primary roles as an advisor is to provide context and perspective for clients, allowing us to collaboratively make better decisions.

Behavioral economists have identified narrow framing as the tendency for investors to make decisions without considering the big picture or long-term effect on their portfolio.  This behavior can be harmful when it leads to bad decisions, like falling in love with a stock or a market sector that has done particularly well recently.  If we observe a particular sector doing well, and conclude we should buy more, the overweight can reduce diversification, and hurt portfolio performance when an inevitable market correction occurs.  Similarly, a narrow focus on a single, very risky asset may lead us to reject it from the portfolio, when a small percentage could add valuable diversification over the long term.  The benefits of portfolio theory are enormous, but require that we consider the big picture – the whole portfolio.

A recent post on the Rockbridge website includes a link to a Wall Street Journal article discussing some of the pitfalls of narrow framing (https://rockbridgeinvest.com/do-you-suffer-from-narrow-framing/), but this is not a new subject.  The author of this article, Shlomo Benartzi, was cited for his previous work by some other famous behavioral economists in a research paper from the late 1990’s.  The authors of that paper included Amos Tversky and Daniel Kahneman, the subjects of Michael Lewis’ recent best seller The Undoing Project.

That paper discusses myopic loss aversion, which is the combination of a greater sensitivity to losses than to gains, and a tendency to evaluate outcomes frequently.  The authors did an experiment that supported their theory that long-term investors would make better decisions if they looked at their portfolio performance less frequently, like yearly instead of monthly.  Looking at short-term results is like narrow framing; it is easy to ignore the big picture and focus on a small piece of data. (If you still think looking at your 401(k) balance every day is a good idea, I can send you a copy of the paper!)

It turns out that being short-sighted and attaching outsized negative emotions to losses (another way to say myopic loss aversion), is not good for long-term investment results.

Behavioral economists have devised several experiments to illustrate how loss aversion affects decisions.  One of my favorites is the following two questions:

  • Scenario One:  You have accumulated $9,000 and face a choice: take $9,500 for sure OR flip a coin, heads you get $10,000 and tails you keep the $9,000 you start with.
  • Scenario Two:  You have accumulated $10,000 but cannot just keep it.  Your choices are:  flip a coin, heads you keep $10,000 and tails you keep only $9,000 OR take $9,500 for sure.

Research shows that most people in Scenario One will take the sure gain.  The chance for additional gain is not worth the risk of the coin toss.  On the other hand, when faced with Scenario Two, most people choose to gamble, because the pain of loss is significant, and therefore we tend to justify taking more risk to avoid a loss.  Now step back and compare the two scenarios – they are exactly the same, but framed differently.  It is irrational, from an economic perspective, to choose a different answer based on how the options are framed, but most of us do.

Behavioral economists depart from traditional economists by acknowledging that humans do not always appear rational.  Real people often make decisions that differ from a rational person trying to maximize their economic well-being.

Our role as advisors is to recognize that humans allow emotions to affect decision making.  We can then help reframe decisions in ways that lead to better long-term outcomes.  Pitfalls we can help investors avoid include:

  • Falling in love with the short-term    performance of a particular asset or sector and taking too much risk.
  • Being frightened by negative performance and taking too little risk.
  • Buying winners and selling losers without considering overall portfolio diversification.
  • Focusing on an isolated account without considering its role in the context of your total portfolio.  Sometimes this can be minimized by consolidating accounts; for instance, all your old 401(k) accounts can be consolidated in one rollover IRA account at the same custodian that holds your taxable brokerage account.  This makes it easier to track overall performance and optimize placement of tax-efficient and inefficient asset.

If we acknowledge the impact of our emotions, and constantly force ourselves to step back far enough to see the big picture, we can expect better long-term investment results.

I recently returned from a fee-only advisor industry conference.  In addition to educational opportunities, it was a rewarding experience to spend time with other like-minded professionals. Rockbridge advisors have been attending these conferences for almost 10 years, so I thought it would be interesting to share a bit of the history behind the fee-only movement.

More than 40 years ago, consumers had very few choices when seeking out investment advice.  Large companies that paid representatives to sell individual securities and other financial products dominated the industry.  In 1982, a group of independent advisors got together in Atlanta, Georgia to brainstorm ways to deliver investment advice to their clients that didn’t require them to accept commissions from sales of financial products.  This small band of advisors sent out hundreds of invitations to other advisors around the country to see if there were others who felt the same way.  In February 1983, The National Association of Personal Financial Advisors (NAPFA) was born.  The first meeting brought together 125 advisors who were committed to expanding the use of fee-only financial planning by individual consumers.

NAPFA established a set of professional standards for fee-only financial advisors. They set their members apart from the crowd by committing to a fiduciary standard of care and rejecting commission compensation.  NAPFA advisors are different from other financial professionals in many ways.  They must adhere to a strict fee-only business model and provide comprehensive planning to their clients.  In fact, NAPFA requires members to submit a financial plan for peer review before being accepted into the Association.  Members are also required to complete 60 hours of continuing education every 24 months.

Today NAPFA membership exceeds 2,400 advisors nationwide.  The Association hosts two national conferences per year where members get together in formal study groups around the country to help each other and exchange ideas.

Rockbridge Investment Management is proud to be a member of NAPFA since 2008.  The advisors of Rockbridge have attended numerous NAPFA conferences while also taking a leadership role by volunteering on national and regional boards of the organization.  Many of our clients first learned about our firm by visiting the NAPFA website in search of a fee-only fiduciary advisor.

Today, the government and the media have been spreading the word about this band of fee-only fiduciary advisors that stands ready to provide objective, unbiased financial advice to consumers who are ready for a change.  At Rockbridge, we are ready for the growth opportunities that will come as consumers learn about the benefits of working with a fee-only advisor.

If you would like to learn more about NAPFA, please visit their website at www.napfa.org.

Oftentimes, many investors get caught up in short-term results rather than looking at the big picture. This is known to behavioral economists as “narrow framing,” or “a tendency to see investments without considering the context of the overall portfolio.” Unfortunately, this idea can lead to many missed opportunities for investors.

Narrow framing can cause investors to either take too little risk or too much risk. People often get scared by daily market swings and keep their money in a bank account. On the other hand, people may invest in something considered risky without taking their collective portfolio into account.

According to this Wall Street Journal article discussing narrow framing, you can avoid these mistakes by checking your portfolio less often. Another suggestion is to aggregate your financial accounts by consolidating at one location, or by using software to display all your accounts in one place. This allows you to view your portfolio holistically, which can help to assess your overall risk exposure.

At Rockbridge, we help our clients invest for the long-term big picture. We come up with a portfolio in line with your risk tolerance and goals, and help you maintain a steady strategy throughout the ups and downs of the market. We can even help report on all of your accounts – even the ones we do not manage directly. It is our goal to help you avoid the trap of “narrow framing,” and become a disciplined investor. We will be here with you through it all!


Stock MarketsThe Diversification Story April 17

The accompanying chart illustrates the diversification story. It shows returns in several markets over both the March and December quarters. The upward sloping blue columns of the December 2016 quarter show an increase from the low (4% loss) in emerging markets to the high (14%) for the market of small-cap value stocks. Note the variability of returns in these different markets. Now, look at the gray columns of the March quarter and how they decrease across the same markets from a high (13%) for emerging markets to a low (1% loss) for small-cap value stocks. Just the opposite is happening. If you couldn’t predict how these different markets would fare, then to achieve the positive returns stock markets provided over the last two quarters, you had to have commitments to each. This is the diversification story.

A longer perspective is provided in the accompanying Equity Market Returns chart. As you can see, the variability among the different markets tends to lessen over longer periods. Yet, even over the ten years, variability remains. Generally speaking, ten years is a short period in capital markets, and it takes courage to remaEquity Returns 3 31 17in committed to markets that have produced below average returns for ten years. The fact that international developed markets have languished over the past ten years tells us very little about the future in this market sector. Yield Curves 3 31 2017

Bond Markets

A Yield Curve shows bond yields across a spectrum of time to maturity. These curves can be useful for both providing some sense of what is expected for future interest rates and understanding recent changes. One thing we see this time is a persistent increase in yields across shorter maturities over the three periods. These changes reflect what the Fed has been doing to increase rates. While yields of longer-term bonds have increased since March 2016, primarily in response to the Election, there is little change over the last quarter even in the face of increasing short-term rates. Changing expectations for future inflation helps to explain this lack of movement in longer-term yields.

On March 15, 2017, the Federal Reserve increased interest rates for just the third time since the financial crisis in 2008-2009. Investment theory tells us when interest rates rise, bond prices fall, so rising interest rates are bad for bond returns. However, bonds have performed well since the Fed raised rates a few weeks ago… WHY?

Looking closer, we see that most interest rates fell after the Fed raised rates:

Yield Numbers 4 2017

Fed Controls Short End of the Curve

If you plot this data on a graph, you will see the yield curve – an upward sloping line that shows higher rates for longer maturities. When the Fed raised rates, the curve “flattened,” meaning short-term rates rose slightly while long-term rates dropped slightly. The yield curve is constantly changing shape, and is not always upward sloping – it is referred to as inverted when short-term rates are higher than long-term rates.

Markets Anticipate

The Fed raised rates by 0.25% and the one-month treasury rate went up 0.06% because everybody knew that the Fed was planning to raise rates; the change was already factored in almost entirely. There was some small chance the increase would be delayed, so there was still room for a small increase when the change became certain.

Inflation Expectations Drive Long-Term Rates

What markets did not anticipate was a Trump Presidency, so there was a significant jump in longer-term rates immediately following the Election last Fall. Inflation expectations drive long rates, and President Trump’s proposals to cut taxes and spend billions on infrastructure are perceived as inflationary. Inflation happens when there are too many dollars chasing too few goods, and prices rise.

Monetary Policy

Theory suggests that cheap money promotes economic growth, which creates more jobs. However, as the economy approaches capacity and full employment, demand for goods and services exceeds supply; the result is unwanted inflation. The mission of the Federal Reserve is to maintain the ideal equilibrium between full employment and price stability through monetary policy.

If the Fed is too slow to raise rates and cool down rapid economic expansion, the market can push long-term rates up in anticipation of higher inflation. This is driven by the fact that investors want an interest return that exceeds inflation and compensates them for taking risk. So even if risk stays the same, they demand a higher rate when inflation expectations rise.

In the current economy the opposite seems to be true. The market is concerned that any increase in rates will dampen an already sluggish economy, putting even less pressure on rising prices. So the Fed raised rates… but interest rates went down.

Conclusion

It is important to remember, as recent events illustrate, bond returns are not directly impacted by the Fed Funds Rate. Through monetary policy the Fed can influence economic growth, and inflation expectations, but the linkage is not very solid. In the aftermath of the financial crisis they were left “pushing a string” – the Fed Funds Rate went to zero, they pumped up money supply, and economic growth and employment still collapsed. Similarly in today’s economy, monetary policy may be important, but its impact can be easily overshadowed by fiscal policy (taxes and government spending). The bottom line – Do not necessarily assume that bond returns will suffer every time the Fed raises rates.

The stock market crash of 2008-2009 is a very recent memory for many investors who still bear the scars from the experience. At Rockbridge, we also have prospective clients who walk into our offices saying that they haven’t recovered yet from the financial pain their portfolio endured over those several months.

Why? It’s usually a combination of some or all of the following factors:

  • Their advisor trying to time the market
  • Lack of broad diversification
  • Excessive investment and advisory fees
  • Emotional response to short-term market fluctuations

“More money has been lost trying to anticipate and protect from corrections than actually in them.”

– Peter Lynch, renowned Fidelity fund manager –

The last 10 years haven’t given investors the risk-appropriate returns they deserved (a 50% stock and 70% stock portfolio basically had the same 10-year result), but if you stayed the course, you’re certainly not “still recovering” from 2008-2009.

For example, a $100,000 investment (50% stocks and 50% bonds) at the market peak at the end of 2007 returned to $100,000 only 13 months after the market bottom, as shown by the graph below. This is not something we want to experience again, but certainly a result most investors could live with given the circumstances.

Now, how do you accomplish that result?

  • Stay the course
  • Diversify your investments
  • Keep investment costs low
  • Limit emotions by having and sticking to a plan

“The investor’s chief problem and even his worst enemy is likely to be himself.”

– Benjamin Graham, “The Father of Value Investing”

We can’t predict or control what the crowd will do in the financial markets we are seeing today, but we can increase our odds of a successful outcome by controlling the aspects of investing that can be controlled: diversification, asset allocation, costs and discipline.

We might see a period of negative stock market returns in 2017, but we don’t know. All we do know is that the best way to guarantee underperforming the market is to not be invested in the market, so our answer is to stay the course and periodically review your portfolio with us to be sure the level of risk you are taking is appropriate for your specific goals.

Screen Shot 2017-04-17 at 9.56.51 AM

Teachers Insurance and Annuity Association, better known as TIAA was founded almost 100 years ago (1918). TIAA provides retirement plan solutions for a majority of the higher education institutions in the United States. One type of investment, called the TIAA Traditional Annuity, is a unique fixed income investment option that is available in TIAA 403(b) plans and cannot be purchased on the open market.

TIAA Traditional Annuity Basics

  • Available in most university 403(b) plans and usually has guaranteed minimum return of 3.00%.
  • Guaranteed returns are subject to the creditworthiness of TIAA (currently rated as one of the best insurers in the market).
  • The actual crediting rate of TIAA Traditional Annuities is based on when the money went into the fund. Older contributions can have a crediting rate of 4-5%.

What are TIAA Traditional Restrictions?

  • Contract type matters with how TIAA Traditional Funds can be withdrawn.
  • In Retirement Annuity/Group Retirement Annuity (RA/GRA) contracts, TIAA Traditional investments have to be taken out over a period of time. The shortest allowed is 10 payments over 9 years.
  • In Supplemental Retirement Annuity/Group Supplemental Retirement Annuity (SRA/GSRA) contracts, investments in the TIAA Traditional Annuity can be withdrawn at any time.
  • Supplemental plans have a lower guaranteed crediting rate since the investment is liquid, but the minimum is usually 3%.

What is the Current Fixed Income Environment?

  • Short Term CDs yield around 1%
  • 10-Year Treasuries yield around 2.5%
  • If interest rates rise, bond prices fall causing the return on treasuries to be lower.
  • TIAA Traditional Annuities yields 3%+ with no volatility.

What are the Planning Considerations for TIAA Traditional Funds?

  • A 3%+ rate of return on fixed income assets is appealing in today’s interest rate environment.
  • The TIAA Traditional Annuity could be utilized for some or all of the fixed income portion of a portfolio.
  • Careful consideration of withdrawal needs in retirement should be considered before transferring money into RA/GRA TIAA Traditional investments where the withdrawals are restricted.
  • Making the right investment selection across multiple TIAA contracts and outside investments can be complicated.

As you can see, the TIAA Traditional Annuity option in university 403(b) accounts provides a unique planning opportunity in today’s interest rate environment. If you have this option available to you through you TIAA 403(b), it may be worth utilizing. However, please remember that it is important to weigh the pros and cons of this option to determine if it makes sense to be considered as part of an overall investment and financial planning strategy.

Stock Markets

While markets were down early in the quarter, most, but not all, have bounced back since the Election with small company stocks and value stocks leading the way.  Stocks trEquity Returns 12 31 16aded in international markets and emerging markets have not fared as well in this period, reflecting a strengthening of the dollar. This means a globally diversified stock portfolio would not have done as well as what might be implied by the media hype.

While not everyone looks back at 2016 with delight, the past year was not bad for stocks – especially domestic stocks.  These stocks, as well as emerging market stocks, were up over 12% (small cap stocks up 21%) for the year.  Stocks traded in international developed markets lagged, earning just 1.5% for the year.

The accompanying chart that displays not only recent, but also longer-term results, is a picture of the effects of diversification.  Look at how some markets are up and others are down, but they tend to even out over longer periods.

Bond Markets

The accompanying chart of Yield Curves tells us a couple of things.  First, look at how yields for maturities greater than five years jumped nearly 1% since September 30, 2016.  Increasing yields will drive bond returns down – the longer the time to maturity, the bigger the drop.  This means we have losses from bond investments this quarter, especially from bonds with longer periods to maturity.  Increased yielYield Curves 12 31 16ds at the short end are consistent with the Fed’s recent vote to increase short-term rates; the increases over longer periods have more to do with expectations for economic growth and inflation.

Second, these Yield Curves show a relatively minor year-over-year change.  While in 2016 long-term bonds did earn over 4%, reflecting the drop in yields earlier in the year, returns from both intermediate-term and short-term bonds were about flat. Bond market allocations just haven’t contributed much in recent periods – stocks have carried the day.  This will not always be the case.

There is much talk and concern about increasing interest rates, which will not be good for bond performance.  Below are responses to some of the specific questions we have received from clients.

Q:  Why have interest rates increased since the election?

A:  Many of the ideas put forth by President-elect Trump are perceived to be inflationary. Spending more on infrastructure and defense while cutting taxes would increase the federal deficit and create inflationary pressure.

Q:  The Federal Reserve recently increased the federal funds rate and says it will likely do so again in 2017. Is this the beginning of a long-term upward movement in interest rates?

A:  Not necessarily. The Fed has limited control over interest rates, particularly longer-term rates.  The Fed sets the federal funds rate, which determines the cost for banks to borrow and lend money overnight.  Other interest rates are determined by investors in the market.  When markets expect higher inflation, there is upward pressure on interest rates, and because markets anticipate the future, the increase in rates can occur well before the deficits or actual inflation appears.  The longer-term trend depends on how those expectations change in the future.

Q:  What are “normal” interest rates, and when might we see them again?

A:  Historically, short-term rates tend toward a level that offsets inflation, so an investor leaving money in a money market account does not earn much, but avoids the loss of purchasing power due to inflation. If inflation is around 2%, normal short-term rates might be 2-3%, which is consistent with Fed expectations.  Minutes from the December meeting of the Federal Open Market Committee say members expect “that the appropriate level of the federal funds rate in 2019 would be close to their estimates of its longer-run normal level” and their projections were 2-3%.  Investors need an incentive to tie up their funds for longer periods, and they tend to expect 2-3% more than money market returns, so “normal” for ten-year treasury bonds might be 4-6% when inflation is around 2%.

Q:  Why have some of my bond funds lost more value than other bond funds?

A:  The value of long-term bonds is affected more than the value of short-term bonds when interest rates change. This is a simple economic reflection of opportunity cost – if your money is in cash when rates rise, you can take advantage of higher rates right away, but if your money is tied up in a long-term bond, you have to wait for it to mature.  The fact that you will earn less while waiting for the bond to mature is reflected in the immediate change in value.  If another investor buys the bond from you at the reduced market price, their return reflects the new higher interest rate.  Bond funds reflect the change in market value so investors can get in and out of the fund without harming other shareholders.

Q:  Do the recent declines in value reflect a permanent loss in the value of my bond funds?

A:  Not really. Like in the example above, the bond fund is just a collection of individual bonds with different maturities.  If one of the underlying bonds is held to maturity, it still returns the face value and the interest earned is equal to the amount originally “bargained for.”  The lower market value reflects the fact that new investors demand a higher return over the remaining life of the bond because interest rates are now higher.  The past year provides an interesting example.  On January 1, 2016, the yield on a total bond market index fund was around 2.5%.  Rates dropped, and by the end of September, bond funds were reporting year-to-date returns of 6%, because bond prices had increased.  Post-election interest rates jumped, bond values dropped, and bond funds ended the year with returns of about 2.5% for the year.  For long-term investors the unrealized gains and losses are not permanent – they are just a reflection of the changing opportunity cost of holding bonds rather than cash that can be reinvested immediately.

Q:  Given that we don’t know where interest rates are headed, or how soon we might get back to “normal,” how should my fixed income portfolio be structured?

A:  The specific answer always depends on your specific situation, but generally we think markets are still the best prediction of the future – sometimes a poor prediction, but the best we have.  So we think investing in bonds is important to provide stability to your portfolio, and taking the interest rate risk of the total bond market is likely to provide modest, positive returns, with reasonable levels of volatility.

Markets in November

The campaign is finally over and Donald Trump won.  Markets respond to surprises and this result was one.  Tuesday night I, along with many others, anticipated a starkly negative response.  Yet, most, but not all, stocks went up and have generally stayed there.  Domestic small company stocks and value stocks responded big – up in the neighborhood of 15% for November.  On the other hand International stocks and especially stocks traded in Emerging Markets were off.  Bond yields shot up producing a drop in prices and negative bond returns for the month.  Surprising many, domestic markets seem to expect a Trump administration will be positive for stocks.

Expectations from a Trump Administration

Expectations about the future drive stock prices; surprises produce changes.  So, what’s the market expecting from the election of Donald Trump?  Here are some thoughts:

Expectations for increased government spending as well as tax cuts.  These changes could not only increase expected inflation, but also provide cover for the Fed to raise interest rates.  An increase in expected inflation explains the rise in bond yields producing a falloff in bond prices and negative returns.  Increases in domestic interest rates can drive up the value of the dollar, which helps to explain negative returns across international markets.

Expectations for an improved domestic manufacturing environment from a review of trade policy, immigration policy and globalization – “bringing back jobs”.  An expected improvement in basic industries would help to explain the sharp rise in stocks of smaller and value companies traded in U.S. Markets.  On the other hand, a more restrictive domestic trade policy is apt to hurt companies with stocks trading in Emerging Markets.

Expectations for a more benign regulatory environment, which is apt to have a positive impact on the stocks of most companies traded in domestic markets, especially those of large financial companies.  A portfolio of the largest U.S. banks was up 18% in November.

While these expectations produced positive environment for domestic stocks today, no doubt, there will be surprises along the way.  While the Republicans have both Houses of Congress and the Presidency, there are still Democrats.  Donald Trump has no clear mandate to implement given polices, except to upset the status quo.   No one knows what that means.  A more or less clean slate gives people the opportunity to make their own interpretation about how he will govern, which is apt to lead to disappointment as the future unfolds.  We’ll see.

Whether you find the election results exciting or shocking, we are now faced with the question, “What’s next?”

With respect to your investments, here’s a quick reminder of how we feel about that:  Ample evidence informs us that it is unwise to alter your long-term investment strategy in reaction to breaking news, no matter how exciting or grim that news may seem, or how the markets are immediately responding. Markets constantly process information, and security prices incorporate new or changing risks. Markets have proven far better than others in pricing these risks and determining fair value at any point in time. As we saw with the unexpected outcome of this summer’s Brexit referendum, the biggest surprise may be how resilient markets tend to be, as long as you give them your time and your patience.

In other words, if you feel you want to make changes to your investment portfolio in the aftermath of Tuesday’s election results, please be in touch with us first, so we can do the job you hired us to do. Specifically, you can count on us to advise and assist you based on our professional insights, your personal goals and – above all – your highest financial interests.

In the meantime, consider these words by billionaire businessman and “stay put” investor Warren Buffett, from his 2012 letter to Berkshire Hathaway shareholders:

“America has faced the unknown since 1776. It’s just that sometimes people focus on the myriad of uncertainties that always exist while at other times they ignore them (usually because the recent past has been uneventful). American business will do fine over time. And stocks will do well just as certainly, since their fate is tied to business performance. Periodic setbacks will occur, yes, but investors and managers are in a game that is heavily stacked in their favor…The risks of being out of the game are huge compared to the risks of being in it.”

Buffett published these sentiments on March 1, 2013, shortly after the last presidential election cycle. If you review the volume of his writings, you’ll find that he has expressed similar viewpoints on many occasions and through many markets, fair and foul.

Presidential terms are four years long. Your investment portfolio has been structured to last a lifetime. Remember that as you consider your personal “What’s next?” … and please call us if we can assist.

Stock Markets

It was a pretty good quarter for stocks, with the riskier small-cap and emerging market stocks leading the way.  REIT’s gave back some of their robust returns of prior periods.  The year-to-date numbers for stocks are solid as well.equity-market-returns-9-30-16

The riskier markets have done better this quarter, which is consistent with an increased appetite for risk.  One concern is that much of the recent returns can be explained by the need to reach for risk to expect any sort of return. This can lead to a general mispricing of risk.  Consequently, these excess returns are apt to be temporary.

The grey bar showing international markets in the above chart, except for the most recent quarter, hasn’t reached the heights of other market returns.  It shows that this market has not kept pace with others over these periods.  However, be careful as it says nothing about future returns from international markets.

Bond Marketsyield-curves-10-2016

The accompanying yield curves chart shows the yield to maturity of Treasury securities of various maturities.  Note the little change over the September quarter, which is consistent with a more or less flat bond market.  Yields for longer maturities have fallen since the beginning of the year, which reflects the relative attractiveness of U.S. Treasury securities in a world of negative interest rates.

Credit spreads (the difference between yields on corporate bonds versus comparable Treasury securities) have declined over the past quarter resulting in positive returns from investment grade corporate and especially high yield bonds.  These declines are consistent with our theme of an increased appetite for risk.

The Value of Capital

I am usually skeptical of suggestions that we are entering a “new normal.”  Yet, a case might be made that this time it’s different.  The axiom that capital has value can be questioned – Central Banks can’t seem to give it away!   Interest rates are the “price” of capital – it’s what’s paid to use capital.  Interest rates near zero and, in some places, negative provides an indication of the value of capital today.

Central Banks worldwide, including the Fed, are not shy at providing capital at little or no cost.  Banks are holding massive amounts of reserves; there is little appetite for rebuilding infrastructure and many corporations are finding the best use of capital is to buy back stock.  Furthermore, in developed economies, human capital – not physical capital – is more of a driver of economic growth today.  Apple, Microsoft, Facebook, Google and Amazon are relatively new names among today’s largest corporations, each of which is engaged in managing human capital primarily.  This shift away from physical capital helps to explain the decline in demand and is consistent with a lower price of capital into the future.  Perhaps a new normal.

This apparent reduced value for capital has implications for investors.  First, is this really a new normal or is it temporary?  Second, what is the impact on the price of risk going forward?  Third, can we earn the returns of the past by judiciously managing risk, or will we have to accept reduced expected returns going forward?  Fourth, are markets signaling deflation ahead?

As I said, I am generally skeptical of paradigm shifts and suggestions of a new normal.  We have to deal with a lot of random behavior, and capital markets can be out of whack for extended periods.  The current distortion could simply be the result of Central Banks acting alone without changes in fiscal policy to produce economic growth.  Consequently, we must be careful about shifting our ideas about how the world works in response to what could turn out to be temporary aberrations.


Once Upon a Time…

When we started an investment advisory firm in 1991, it seemed obvious to Bob Ryan and me that structuring portfolios by focusing on asset allocation was superior to the stock picking culture of the day.  The ability to implement the strategy with low-cost index funds was still a new innovation, and we found ourselves talking with incredulous institutional investors who could not understand why any prudent, sophisticated investor would settle for market returns when every active manager walking through their door had consistently outperformed the market – at least that’s what their presentations declared.

We occasionally mused about what would happen when investors “saw the light” and embraced low-cost passive or market tracking strategies.  If everyone bought index funds, could markets become inefficient and create opportunities for smart investors to beat the market by picking undervalued securities?  Our conclusion – it might be possible in theory, but extremely unlikely.  As the market approached a 100% devotion to index funds, capitalism would prevail and a few smart investors would start bidding up the price of undervalued securities, keeping markets reasonably efficient for everyone else.

Fast Forward…

This brings us to the latest round of arguments in the ongoing active versus passive debate.  A sell-side group at Alliance Bernstein put together a provocative research piece likening a market dominated by passive investments to Marxism.  The argument is that markets influence the judicious allocation of capital by determining which companies deserve investment and which borrowers deserve capital (from bonds).  Index funds, by buying everything in the index according to market weight, are not contributing to the process of capital allocation, thus they are not only worse than a free-market, they are even worse than communism, where there is at least some attempt at planning and prioritizing.

How Many Active Investors Does It Take…

Somewhere around 30-35% of investable assets are now held by market tracking Exchange Traded Funds (ETFs) and mutual funds.  The argument that smart money managers can outperform the market has been overwhelmed by data suggesting otherwise.  Although stock pickers will not be extinct any time soon, there is a steady flow of assets moving out of actively managed mutual funds and moving into index and market tracking funds and ETFs.

As this trend continues the discussion has begun to shift to the perils of a market dominated by indiscriminate investors blindly buying market weighted index funds, but not everyone agrees with the dangers described by the Alliance Bernstein piece.  Vanguard founder John Bogle (who launched the world’s first public index fund) has estimated that a 90% passive market should be sustainable. Burton Malkiel, author of the classic, “A Random Walk Down Wall Street,” has set the number even higher, at 95%, saying with indexing at 30-35% of the total, there are still plenty of active managers out there to make sure that information gets reflected quickly.  “And in fact I think it’ll always be the case.”

At Rockbridge we agree with Bogle and Malkiel, that indexing is unlikely to ever reach levels where it threatens the efficiency of markets and their ability to incorporate all available information in the setting of prices.  Taking advantage of market efficiency, and the availability of low-cost, evidence-based market tracking funds and ETFs, is still the best way to implement an asset allocation strategy for long-term investors.

With less than a month to go before the Presidential election, many clients and friends have asked me how the markets will respond to the voters’ choice.  While there will be no shortage of prognostications in the media, investors would be well served to avoid speculating.

Trying to outguess the market is often a losing game.  All of the current information and polling on the election is baked into current stock market prices.  Major market fluctuations usually occur when unexpected events happen.  As of today, we expect either Clinton or Trump to be our next President.  So stock prices reflect that reality to a large degree.

History tells us that markets provide substantial returns over long time periods regardless of which party holds the Presidency.  So for “buy and hold” investors, the best advice is to “do nothing” and let the markets work for you.  The underlying reasons for investing your wealth in the stock market have not changed.

presidents-stock-market

Generating excess returns or limiting losses based on the election results will likely be the result of random luck.  However, those decisions can be very costly to the long-term investor who may make the wrong moves based on the short-term news cycle.

The highest probability of long-term investment success remains the same: identifying your personal goals and objectives; creating and sticking to a diversified asset allocation plan using low-cost evidence-based investments; and rebalancing regularly.

It’s no surprise that this year’s U.S. presidential race has become a subject of conversation around the globe. In “Why Our Social Feeds are Full of Politics,” Canadian digital marketing executive Tara Hunt observes, “American politics, it seems, makes for high-intensity emotions far and wide.” The intensity will probably only increase as the November 8 election date nears.

We are by no means endorsing that you ignore what is going on in the world around you. Politics and politicians regularly and directly affect many aspects of our lives and our pocketbooks. But as you think through this year’s raucous race, remember this:

The more heated the politics, the more important it is to establish and maintain
a well-planned, long-term approach to managing your investments.

So go ahead and talk politics all you please – and if you are an American, be sure to vote. But when it comes to your investments, it’s best to ignore any intense emotions and the dire or ebullient predictions that spring from them, as dangerous distractions to your financial resolve.

THINKING IN STAGES

Have you ever heard of stage-one and stage-two thinking? They’re terms popularized by economist Thomas Sowell in his book, “Applied Economics: Thinking Beyond Stage One.” Basically, before acting on an event’s initial (stage one) anticipated results, it’s best to engage in stage-two thinking, by first asking a very simple question:

“And then what will happen?”

By asking this question again and again, you can more objectively consider what Sowell refers to as the “long-run repercussions to decisions and policies.”

INVESTING IN STAGES

In investing, we see stage-one thinking in action whenever undisciplined dollars are flooding into hot holdings or fleeing immediately risky business. Stage-two thinking reminds us how often the relationship between an event and the world’s response to that event is anybody’s guess and nobody’s certain bet. A recent Investopedia article, “Does Rainfall in Ethiopia Impact the U.S. Market?” reminds us how market pricing works:

“No one knows how any of these events will impact markets. No one. That includes financial advisors who have access to complex computer models and investment strategists in the home office with cool British accents. They don’t know, but their livelihood depends upon appearing to know. Few of them are ever held accountable for the innumerable predictions they got wrong. They simply move on to the next prediction, the next tactical move.”

Investors should avoid trying to predict future market pricing based on current market news.

REFLECTIONS ON PRESIDENTIAL ELECTIONS

Stage-two thinking is especially handy when considering the proliferation of predictions for anything from financial ruin to unprecedented prosperity, depending on who will next occupy the Oval Office.

Again, the problem with the vast majority of these predictions is that they represent stage-one thinking. As financial author Larry Swedroe describes in a US News & World Report piece, “Stage one thinking occurs when something bad happens, you catastrophize and assume things will continue to get worse. … Stage two thinking can help you move beyond catastrophizing. … [so you can] consider why everything may not be as bad as it seems. Think about previous similar circumstances to disprove your catastrophic fears.”

In the current presidential race, we’re seeing prime examples of stage-one thinking by certain pundits who are recommending that investors exit the market, and sit on huge piles of cash until the voting results are in. At least one speculator has suggested that investors should move as much as 50 percent of their portfolio to cash!

And then what will happen?

Here are some stage-two thoughts to bear in mind:

  • Regardless of the outcome of the election, there’s no telling whether the markets will move up, down or stay the same in response. By the time they do make their move, the good/bad news will already be priced in, too late to profit from or avoid.
  • In the long run, the market has moved more upward, more often than it moves downward, and it often does so dramatically and when you least expect it.
  • Moving to cash would generate trading costs and potentially enormous tax bills. Worse, it would run contrary to having a sensible plan, optimized to capture the market’s unpredictable returns when they occur, while minimizing the costs and manageable risks involved.

In this or any election, stage-two thinking should help you recognize the folly of trying to tie your investment hopes, dreams, fears and trading decisions to one or another candidate. Politics matter – a lot – but not when it comes to second-guessing your well-planned portfolio.

Stock Markets

Just look at the short-term variability in the various equity indices shown in the accompanying chart.  It shows how markets behave through time – some markets are up substantially while others are down.  Of course, this variability is reduced by holding a commitment to each, but it means periodically enduring down markets while appreciating the positive results of others.

Look at the ten-year period where all equity indices are positive.  Even in this relatively long period, proxies for international developedEquity Returns 6 30 16 
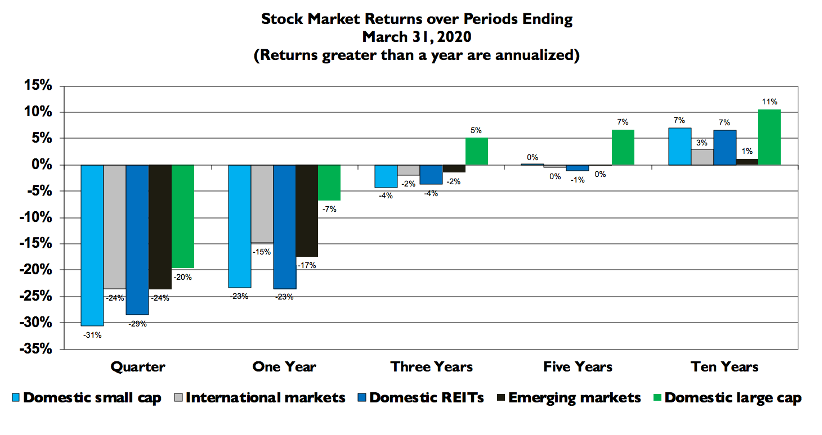
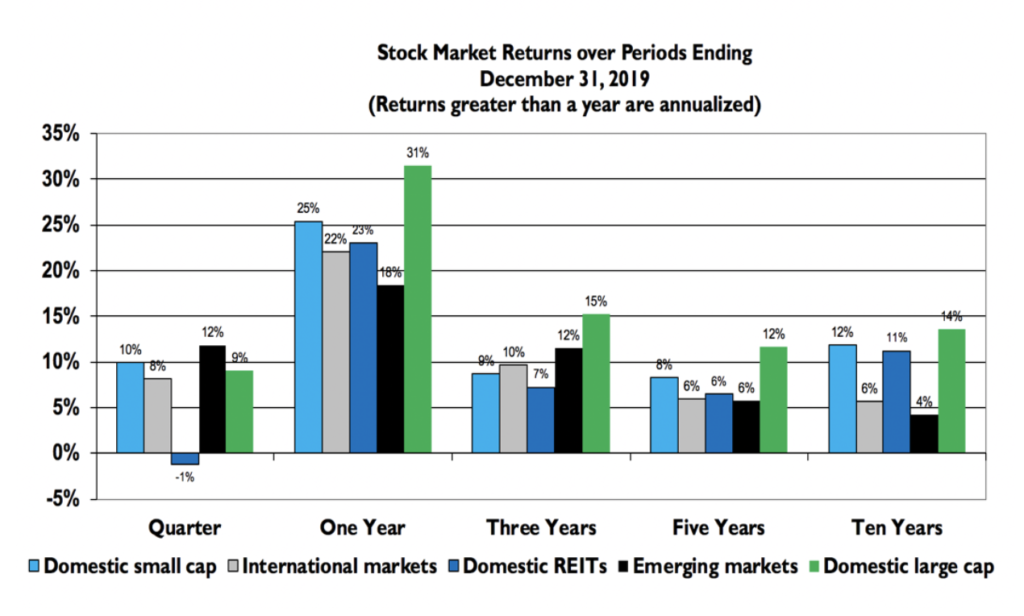
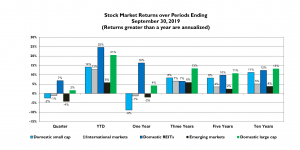
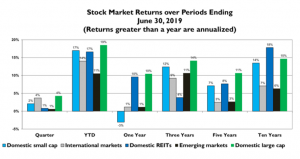
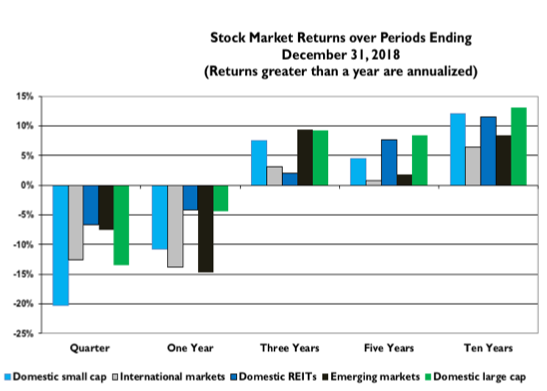
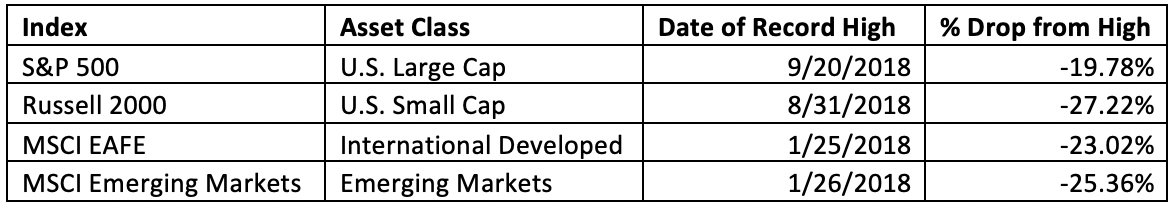
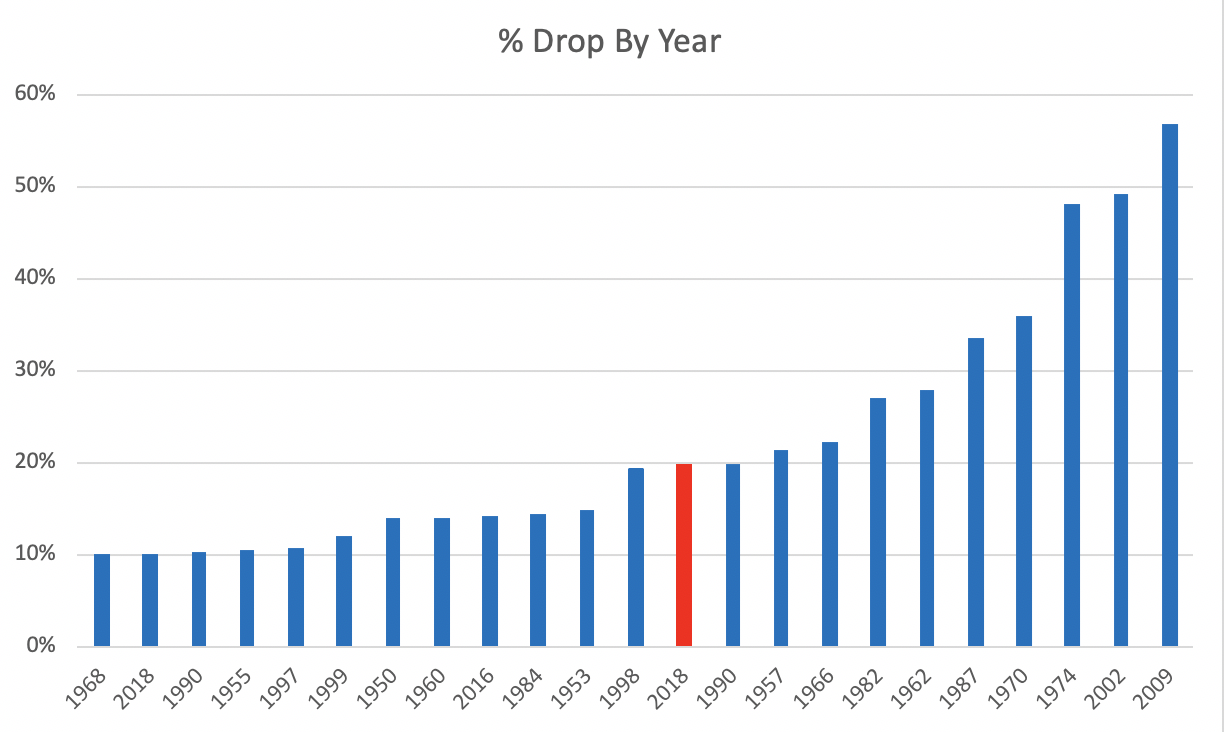
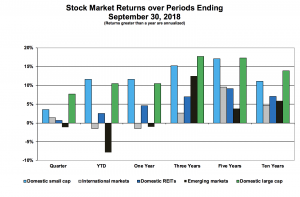
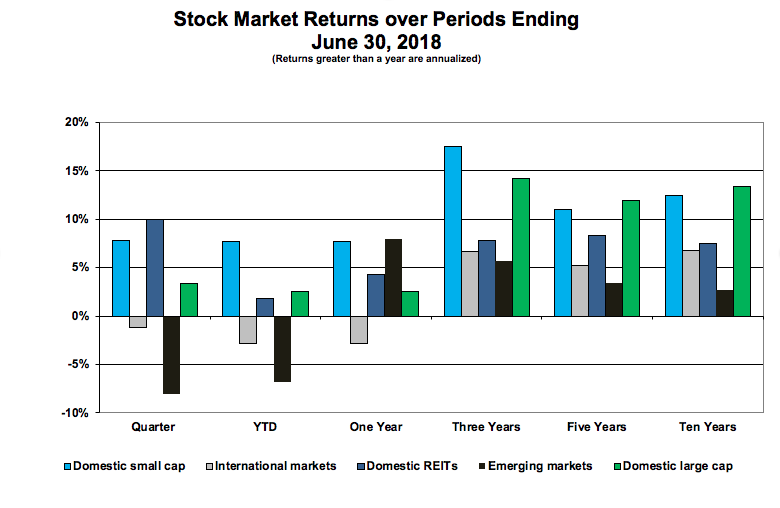
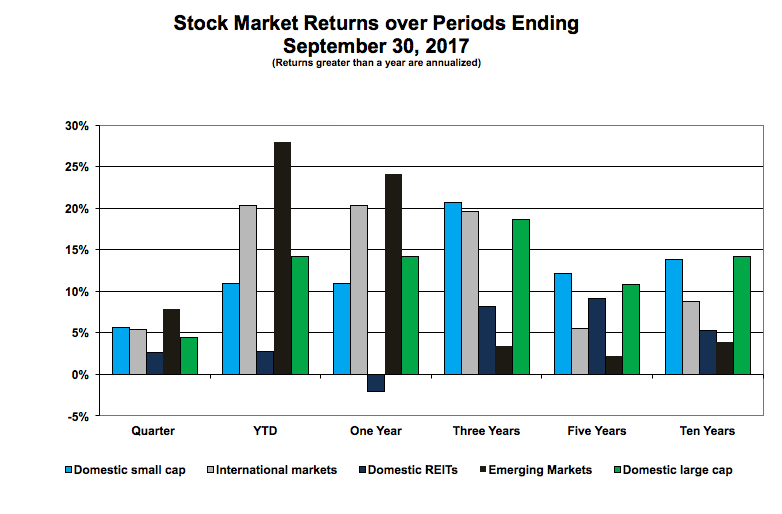
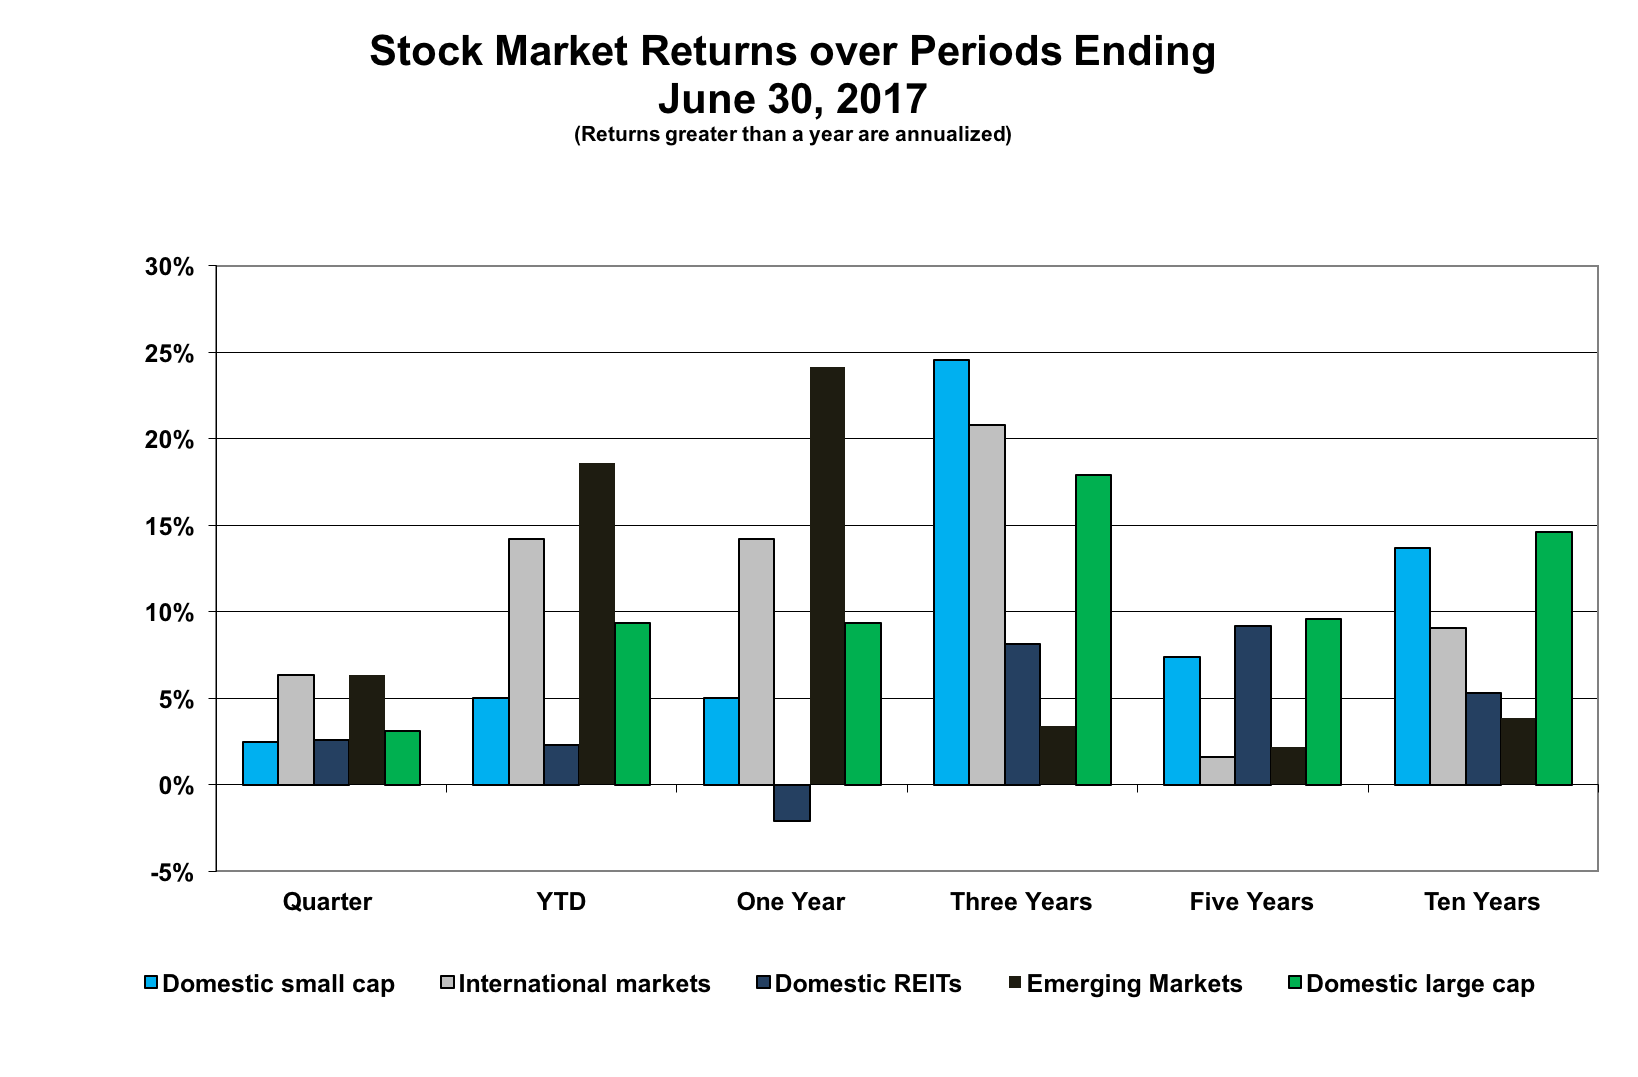
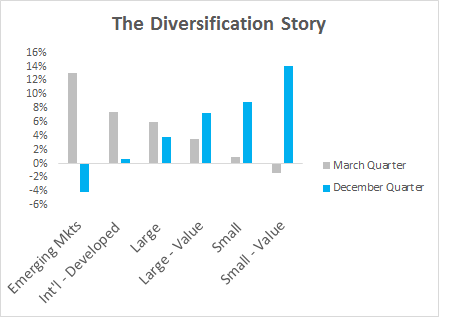
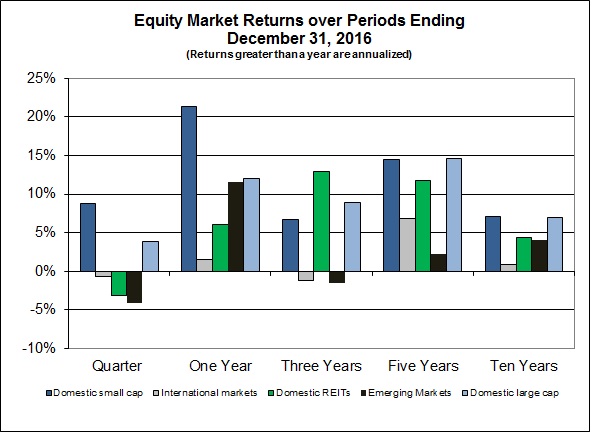
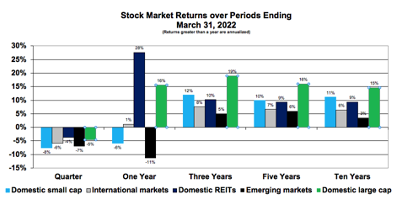
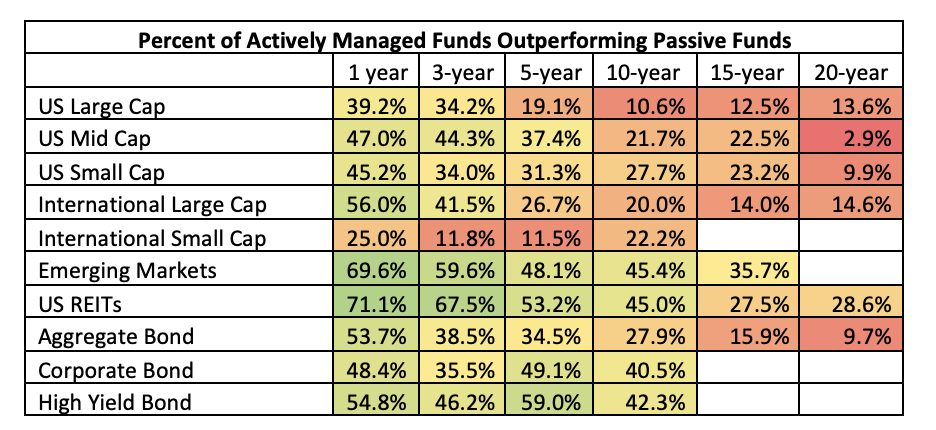
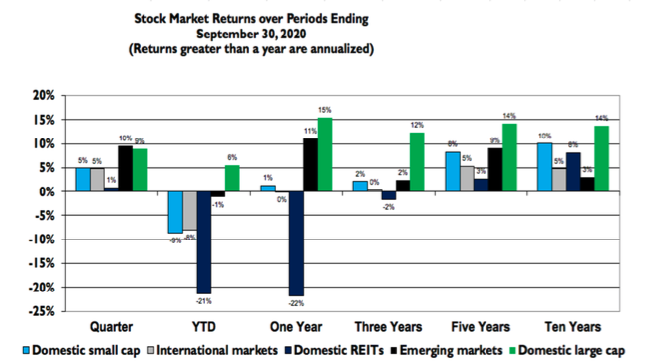
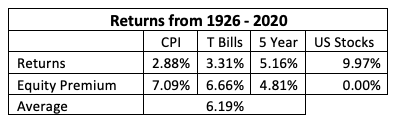
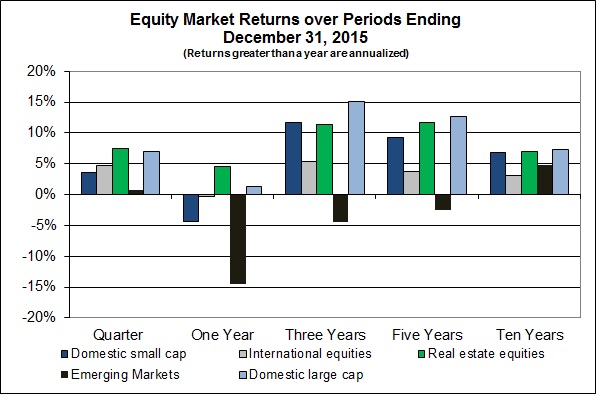
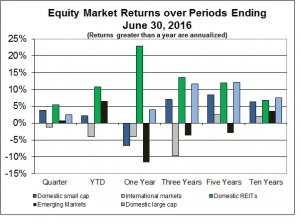
markets and emerging markets stand out as below average.  While we have had to deal with an extended down period in these markets, it is not indicative of what the future holds.

Financial markets continue to deal with the turmoil from Britain voting to exit the European Union.  First lurching down on the news, then, except for British markets, back up to where it now seems that financial markets have generally incorporated the initial shock in a reasonable fashion.  Domestic stocks ended the quarter up about 3%; stocks traded in developed international markets down 1%; emerging markets up nearly 2%.   Year to date a globally diversified stock portfolio would not have fared too badly either – gains in emerging markets generally offset losses in international developed markets.  This time around diversification to emerging markets, REITs and bonds cushioned the immediate impact of today’s uncertainties.

Bond Markets

The bond market story is told in the yield curves chart.  Look at how short-term yields have generally increased, while yields of longer maturities have dropped.  The change in short-term yields reflects the Fed’s beginning to increase interest rates, and longer-term yields are consistent with the so-called “flight to safety” in the face of global uncertainties and negative interest rates. (U.S. Treasuries are still providing a positive return, increasing their demand.)Yield Curves 6 30 16

Once again, the Fed announced that they would delay their program to increase interest rates – too much uncertainty in global markets they say.  I wonder when global uncertainty will dissipate – there will always be something.

Credit spreads – the difference in yield between corporate bonds and Treasury securities – narrowed over the quarter explaining a premium for bearing the credit risk of corporate bonds versus Treasury securities.  While narrowing credit spreads is contrary to the reduced appetite for risk, it is consistent with market participants searching for yield in today’s low (negative) interest rate environment.

Brexit

On June 23rd, 52% of British voters thumbed their nose at the European Union to say:  “We’re out of here!”  This action is going to usher in change.  Of course, anytime the status quo is upended, get ready for a lot of uncertainty as things get sorted out.  As always, the best strategy to deal with this turmoil is to periodically rebalance allocations back to an established risk profile – taking advantage of “buying low and selling high.”

The British vote surprised many.  Now we start the process of “putting as much of the toothpaste as possible back into the tube.”  This will produce more surprises – some positive, others negative – all independent of the Brexit vote.  So far, financial markets seem to have handled the uncertainty reasonably well.

While Brexit didn’t seem to have much of an impact on financial markets, the vote is important nonetheless.  Brexit is a first cousin to the Trump phenomenon here.  Both reflect a repudiation of the ideas and programs of the so-called “Establishment.”  The data is reasonably clear that not everyone has shared the benefits of globalization, technological change, immigration, etc.  A lesson of the Brexit vote as well as the success of Donald Trump and Bernie Sanders is that there is an underlying discontent with economic and cultural changes that better not be ignored

Although our name is Rockbridge Investment Management, there are many services that we provide to our clients beyond managing investments.   We wanted to share just a few of these additional skills with our clients.

General Questions

We are here for you as an ongoing resource for every financial question, big or small.  Please ask!

Retirement Income Planning

Investment management is only part of the retirement picture. We are able to plan for what your retirement will look like by combining all sources of future retirement income.

Pension Analysis

If you have a pension, the decision on how to start collecting on the pension is one of the biggest financial decisions you will make.   We can look at the context of the available pension options and your other financial assets to optimize your available retirement spending.

Insurance Evaluation

While we don’t sell any insurance products, we are knowledgeable in life, health and long-term care insurance products.  We can help provide context to how much insurance you need and where the best place is to purchase it.

Social Security Strategies

Often unrealized, Social Security will still provide the backbone of your retirement spending.  There are many different options available for claiming Social Security.  Making sure the right selection is made can have a substantial impact.

Estate Planning

We can help lead you through many complex estate planning scenarios and work with your attorney on finalizing your optimal estate plan.

Tax Planning

There are many ways to optimize your savings and retirement withdrawals by understanding the complicated tax laws.  We have the expertise to understand how your investments and taxes interact.

College Savings

Tuition bills have skyrocketed in the last decade.  We cannot help reduce the cost of tuition, but we can make sure you are saving and paying for college in the most cost effective way for your children.

401(k) Recommendations

Before retirement, employer retirement plans are often the easiest and best way to save.  Even though we cannot directly manage your personal 401(k) account, we can provide guidance on which investments should be in the account.

If you have questions relating to any of the topics listed and more, please feel free to contact us.  Rockbridge has firm-wide expertise to help you achieve your financial goals

The recent vote in Britain to exit the European Union is yet another reminder of how markets often react negatively to surprises. We cannot help but ask ourselves, “Is it different this time? Maybe this is the event that upends markets as we know them, and I would be stupid not to react!”

As it turned out, markets settled down quickly after this latest surprise, but it reminds us that long-term investors must endure these market downturns because no one has the crystal ball that would allow us to avoid them.

Sometimes surprises have profound and long-lasting effects. Those of us who have been saving for retirement for the past thirty years or so have seen plenty of surprises, and I think it is helpful to put some of the results in perspective. Looking back from 2016, it is interesting to note how disappointing our recent experience has been. Since 1940:

• The worst 3-year performance for the S&P 500 ended in March of 2003 (-16.09% annualized).
• The worst 5-year performance for the S&P 500 began a year later in March 2004 (-6.64% annualized).
• And the worst 15-year performance for the S&P 500 ended in August 2015 (+3.76% annualized).

In other words, the technology/dot-com bubble that ended in March 2000, and the financial crisis of 2008, were back-to-back disastrous surprises for the stock market. The fallout has consumed more than half the working career of anyone much under 50 years old, and had a negative impact on those who are older and trying to save for retirement in their peak earning years.

Another interesting fact: If we add the previous ten years to that worst 15-year period (25 years beginning in September 1990), the S&P 500 realized annualized returns of 9.8% – very close to longer-term averages.

Some conclusions we can draw from these observations:

• Time horizon matters – 15 years is not a long time for a long-term investor, and anyone planning for retirement should be a long-term investor.
• It’s different every time – the cause of the surprise is almost always different than the last time markets were shaken, but long-term investors must be ready to endure the inevitable downturn.
• The best reaction is almost always the same – check your risk profile to be sure it is appropriate for your situation, then rebalance to your targets, buying stocks at discounted prices.
• Staying the course makes sense – the major market run-up in the 1990’s was as unforeseeable as the subsequent downturns.

Events like the Brexit vote test our patience and tolerance for risk. Maintaining a long view to the future, and keeping history in perspective, can help us make better investment decisions.

Believe me, we get it. After yesterday’s Brexit referendum and its startling outcome, it’s hard to view today’s news without feeling your stomach twist over what in the world is going on. Whenever the markets scream bloody murder, your instincts deliver a sense of unrest ranging from discontent to desperation.

Financial author Larry Swedroe has called this your GMO response: Get me out! The Wall Street Journal personal finance columnist Jason Zweig explains it this way: “Losing money can ignite the same fundamental fears you would feel if you encountered a charging tiger, got caught in a burning forest, or stood on the crumbling edge of a cliff.”

Basically, you can’t help it. These sorts of responses are being generated by the amygdala lodged deep inside your brain, over which you literally have no control.

What’s Next?

So, first, take a breath. Now another one. Next, remember that there is a fine line between remaining informed about global goings on, versus letting an onslaught of news take over your brainwaves and trick you into rash reactions.

In that context, it doesn’t take long to realize that the breaking Brexit news raises myriad questions, with few swift and comforting answers currently available.

In lieu of fixating on the bounty of in-depth analyses (when in reality the answer to exactly what is coming next is: “Who knows?”) it’s worth remembering that capital markets have been encountering and absorbing startling news for centuries. When viewed close up, the mechanics can be ear-piercingly loud, but they actually have a history of working marvelously well in the long run – at least for those who heed the evidence on how to participate in the upside rewards while managing the inevitable downside risks.

What Should You Be Doing?

In short, very little at this time … which we understand, can be one of the very hardest things to (not) do. So let’s talk about that.

In your portfolio, if we’ve accurately positioned you for withstanding high market risk when it occurs, you can congratulate yourself for having already prepared as best you’re able.

While the outcome of the Brexit referendum is certainly new and different, its impact on the market is old hat. These are the sorts of events we have in mind when we prepare and manage you and your portfolio. Using global diversification, effective asset allocation and careful cost management, the goal has been – and remains – the same. Our aim is to expose you to the market risks and expected returns you need for building or preserving your wealth, while minimizing over-concentration in any one holding. That way, you are best positioned to avoid bearing the “Ground Zero” worst of it when market crises do occur.

Even so, perhaps the unfolding events are causing you to realize that you aren’t as keen as you thought you were on bearing market risk. Real life is very different from theoretical exercise.

If this is the case, we get that too. Still, we would strongly suggest that this is no time to act on those insights. In fact, it’s likely to be the worst time to do a “GMO.” First, it is likely to incur significant avoidable financial loss. Plus, while it may temporarily feel better to have “done something,” it leaves you with no plan for the future. That can generate more chronic unhappiness than it briefly relieves. Life is too short for that!

If you’re having your doubts, consider your current feelings an important and valuable insight about yourself, but please, please sit tight for now. Do give us a call right away, though, and we’ll explore how best to ratchet down your investment risk sensibly and deliberately.

In short, as your advisor, we’re all in on safeguarding your best financial interests. We remain as here for you as ever. We hope you’ll let us know how you are holding up, and what questions we can answer about the unfolding news. Market analyses aside, we are living in “interesting” times, and would love to chat further with you about them, one on one.

Thanks in part to our evidence-based approach to investing, we don’t have to eat our words or advice very often. But recently, we discovered that we stand corrected on one point. Fortunately, it’s a point we’re happy to concede:

Evidence-based investing doesn’t have to be such a boring subject after all.

In his recent “Last Week Tonight” HBO segment on retirement plans, John Oliver showed the world that even the typically eye-rolling conversation on why fiduciary advice matters to your investments can be delivered so effectively that it goes viral … or at least as viral as financial planning is ever likely to get, with nearly 3.5 million views, and counting.

Oliver’s masterful combination of wit and wisdom is worth watching first-hand. If you’ve not yet taken the 20-minute coffee break to check it out, we highly recommend that you do so.

The best part? It’s hard to say. He covers so many of our favorite subjects: avoiding conflicted financial advice, reducing the damaging effects of excessive fees, and participating sensibly in expected market growth.

We also are hopeful that Oliver’s segment will help strengthen the impact of the Department of Labor’s recent rule, requiring all retirement advice to strictly serve the investor’s best interests. We can’t quite bring ourselves to share the analogy that Oliver used to bring that particular point home, but here are a couple of our other favorite zingers (pardon his French):

On stay-the-course investing: “There is growing evidence that over the long term, most managed funds do no better, and often do worse, than the market. It’s basically the plot of ‘Charlie and the Chocolate Factory.’ If you stick around, doing nothing while everyone around you f**ks up, you’re going to win big.”

On hidden fees: “Think of fees like termites. They’re tiny, they’re barely noticeable, and they can eat away your f**king future.”

Lacking Oliver’s comedic timing, our own frequent conversations on these same subjects are unlikely to ever reach 15 million viewers. But that doesn’t diminish our equal levels of passion and enthusiasm for how important it is to safeguard your financial interests by embracing the few relatively simple, but powerful principles that Oliver shared.

One thing we do have over Oliver: We are quite serious about actually serving as a fiduciary advisor, protecting and promoting your highest financial interests. As always, we deeply appreciate your business. If you are aware of other investors who could use a similar helping hand, why not share Oliver’s video with them? We hope you’ll also offer them our name along with it, in case they’d like to continue the conversation.

The default investment option for the Lockheed Martin Salaried Savings Plan (SSP) and the Capital Accumulation Plan (CAP) is the managed Target Date funds.  A Target Date fund is designed to capture the entire investment market in a single fund.  In addition, as you approach retirement, the Target Date fund becomes less and less risky.  While this sounds good in theory, there are some significant downsides to using Target Date funds, especially the ones available in the LM retirement plan.

Benefits

For new investors, there are some significant advantages to holding the LM Target Date Funds, the primary of which is simplification.  For an employee in their 20s and 30s, savings rate is by far the most important factor in retirement success.   Focusing on savings rate and simplifying the investment selection with a Target Date fund is a good approach during these years.  Another benefit is that the Target Date funds automatically rebalance on at least an annual basis.   Finally, the Target Date funds decrease in risk over time which could benefit an investor that is disengaged from their accounts.

Risks

It is important to consider how much risk you are truly taking with a Target Date fund.  There is no standard for how much stock market risk a particular Target Date fund holds, so two different funds that have the same retirement year (Target Date 2040) could have drastically different holdings inside of them.    By investing in individual asset classes instead of a single fund, you have the ability to better control the risk taken in the portfolio.  In addition, the risk can be controlled better for other facets of your individual retirement picture.   The ideal risk level may be different if you have a LM pension as well as the SSP.

Costs

The Target Date funds in the LM 401(k) plan are actively managed by Lockheed Martin Investment Management Company (LMIMCo).  On any given day, the LMIMCo can change the internal account managers in the fund which can change the price.

For example, the annual expense ratio on LM Target Date funds can vary between 0.15% and 0.82% at any given time.  That is quite a broad range.  It would be good to know to a more accurate detail if the annual expenses were either $150/year or $820/year (on a $100,000 account).

In contrast, selecting individual index based funds in the plan would have a lower expense ratio of around 0.04%.   Knowing that you are only paying $40/year instead of $820/year (on a $100,000 account) is a big incentive to re-evaluate your investment selection within your account.

Active vs. Evidence-Based Investment Management

At Rockbridge, we fundamentally believe in the evidence-based or index-based investing approach.  The goal of most investors should be to capture the returns of the entire market for the lowest possible cost.   Unfortunately, the Lockheed Martin Target Date funds fall under a category of active management.   The concept of active management means that a fund is making specific investment decisions in an attempt to outperform their benchmark investment.  While the word “active” sounds like a positive characteristic for an investment manager, academic evidence shows that over the long run, a large majority of active managers have lower returns after fees compared to using an evidence-based approach.  Many of the Lockheed Target Date funds also show this performance lag on their Morningstar reports.

Holdings

Although the Lockheed Martin Target Date funds hold many different asset classes, there are several that Rockbridge does not believe adds long-term value for clients.  These asset classes include commodities, alternative investments, futures, and Treasury Inflation Protected Securities (TIPS).  In addition, each target date fund held approximately 9% in cash at the end of 2015.  With the goal of long-term investing, holding cash in a retirement account could decrease your expected return, and thus, your retirement account balance.

Solution

As you can see, the Target Date funds within the Lockheed Martin 401(k) have both benefits and pitfalls.   The main benefit is simple broad diversification, however this comes with increased costs and risk factors for the investor.

At Rockbridge, we prefer to control the risk in your portfolio and reduce the unneeded costs associated with investing.  As mentioned above, the Lockheed Martin plan does have well diversified, evidenced-based funds that are available.  Please reach out to us for an allocation unique to you.

Stock MarketsEquity Market Returns (2) 3 31 16

After January’s rough start, stock markets bounced back nicely in March, bringing most numbers into the black for the quarter.  Domestic Small Cap and International Developed Markets are the exception – down about 1.5% and 2%, respectively.  Notice from the accompanying chart that it was Emerging Markets that led the way, earning nearly 8% for the quarter.  While not nearly enough to bring longer-period returns into the black, it does give some sense of how diversification works.

The uptick in stock returns in March seems to reflect a more or less positive resolution to some of the recent economic uncertainty – commodity prices have rebounded, figures from China appear better than expected and the domestic economy shows signs of continued improvement with fourth quarter GDP numbers revised upwards.  Also, markets have calmed down a bit – daily volatility of the S&P 500 is below average in March.

While certainly dominating the airwaves, markets don’t seem to be paying much attention to the goings on in the Presidential election.  Don’t let expected political environment cloud investment decisions – assessing not only the probability, but also the impact of the eventual election of any of the current contenders, is tricky indeed.

Market prices are based on the future – today’s prices reflect a set of expectations, which may or may not be realized.  Prices are set expecting a positive return.  The possibility for short-run losses, while not expected, is risk.  It’s what we endure to earn the long-run positive returns.  For sure, however, there will be lots of unpredictable ups and downs along the way as the markets digest the news of the day.

Bond MarketsYield Curves 3 16

The yield on the bellwether 10-year U.S. Treasury security fell about 0.5% to 1.8% by the end of the quarter reflecting positive returns in Domestic Bond Markets.  Note the changes in the accompany Yield Curves chart – short-term rates increasing due to the Fed’s tightening, yet rates over longer periods falling.  The Fed can impact short-term rates; the market sets longer-term rates.

We are in the midst of an environment of historically low interest rates.  In fact, as a component of current monetary policy, the Central Banks of Japan and some European countries have begun to charge member banks a negative interest rate to hold reserves.  Also, the market determined rate on five-year inflation protected U.S. Treasury securities is a negative 0.3%.  Yields on the ten-year security have fallen to under 1.8%, which if inflation over the next ten years is expected to exceed 2%, also produces a negative yield.

While this interest rate environment has persisted for some time, markets can be out of whack for extended periods. However, expected deflation over longer periods could make negative yields rational.   Still, I would be hard pressed to argue that negative interest rates are the “new normal” and are here to stay.  Negative interest rates can’t go on forever, and Stein’s Law (Herbert Stein, Chairman of the Council of Economic Advisors in the Nixon and Ford Administrations) tells us that “If something can’t go on forever, it will stop.”

“The three worst words of stock market advice:  Trust Your Gut.”  That was the headline of a recent article by Jason Zweig in The Wall Street Journal, reporting on a new academic study.  Dr. Robert Shiller of Yale, who won the Nobel Prize in economics in 2013, has been surveying investors about their expectations since 1989.  Dr. Shiller and two colleagues (Goetzmann and Kim) recently released a draft of their analysis of “Crash Beliefs From Investor Surveys”.

The study supports the idea that investor beliefs are heavily influenced by what recently happened, and the effect of bad news is reinforced by how it is reported in the media.  As Zweig says, “the investors’ forecasts regularly look more like aftercasts – simple projections of the recent past into the future.”

Zweig goes on to note that institutional investors are little better than individual investors at predicting the future of markets.  In the two years leading up to the financial crisis in 2008, the majority of financial professionals thought the chances of an imminent crash were nil, and then they turned maximally pessimistic in February 2009, when the market was near bottom and about to make a significant recovery.

This study seems particularly relevant in the context of what has happened so far in 2016.  As market values dropped as much as 10% early in the year, pessimism continued to build.  Optimism returned as markets recovered, and we ended the first quarter in the black.  We all feel better, even though the real world hasn’t really changed much.

The recent analysis by Dr. Shiller and his colleagues seems to suggest once again that investors are not very good at predicting the market, and their emotions tend to reflect what just happened, which is not helpful in predicting the next turn. This phenomenon may be explained by the ways our brains are hardwired to work, but allowing behavioral biases to affect investment decisions can be detrimental for professionals as well as non-professionals.

Conclusion:  Do not trust your gut when it comes to investment decisions.  Take the emotion out, and avoid decisions based on a prediction of the future.  Instead, develop a strategy that reflects an appropriate level of risk, and stick with it.  Our job as an investment advisor is to help develop that strategy and to reinforce our mutual commitment, especially when recent events and emotion try to weaken our resolve.

Many investors pay high fees for actively managed funds. Traditionally with these funds, an investor pays the “manager” of the fund to select investments that they believe will outperform the market. This, in turn, should give the investor a higher return than the market produces.

Although many expect a higher rate of return, evidence shows that actively managed funds do not outperform their benchmark often, and when they do, they usually cannot generate these higher returns consistently.  This evidence, along with the desire to keep the costs to our clients low, is why Rockbridge does not utilize actively managed funds. Instead, Rockbridge uses index funds that are constructed of the components of a market index. This allows us to track the market and mimic market returns. Since index funds skip the step of hand picking securities (by purchasing the entire market index), they are much less expensive than actively managed funds.

However, according to a recent Wall Street Journal article, several active managers are including exchange-traded funds, or ETFs, in their mutual funds. ETFs are a type of security that tracks an index as index funds do. The main difference is that ETFs trade like common stocks on an exchange. Their prices fluctuate throughout the day as shares are bought and sold, unlike a mutual fund that is traded at one price at the end of the day. Since ETFs track an index and don’t require a manager, this also makes them a less expensive option.

If ETFs essentially select the funds for the fund manager, doesn’t that defeat the purpose of an actively managed fund? Investors may feel that they aren’t getting their money’s worth if they’re paying for active management. The fund manager is simply selecting another set of securities (the ETFs) to put into their mutual fund instead of conducting research and picking individual stocks.

These active fund managers have given several reasons for altering their philosophy on picking individual stocks. One is that stock selection is too risky. They would rather control risk and generate consistent performance which the ETFs can help do. They argue that including ETFs also makes the fund easier to understand, and makes changing the underlying assets more efficient. These justifications probably sound familiar since these are all reasons Rockbridge gives to support the evidence-based approach to investing used in our client portfolios.

As an investor, it is important to be on your guard and understand the fees you are paying. Even active managers now are moving towards more of an evidence-based approach to investing – something Rockbridge has done for well over a decade.

Tax season is in full swing, which may bring up many questions and considerations about your investments. Am I saving in the most tax-efficient locations for my financial situation? Are my individual investments tax-efficient as well?

A recent article by Vanguard discusses how broadly based index funds are more tax-efficient than actively managed funds. Rockbridge has built their models strictly using index funds because of their low costs and range of securities within the funds. Their tax efficiency is just another reason why index funds make sense.

One way a fund’s tax efficiency can be measured is with its “tax cost.” Tax cost is the difference between the before-tax return of a fund and its preliquidation after-tax return. According to the article, the median tax costs for index stock funds is 27 basis points less than actively managed stock funds.

Several actively managed funds have a higher tax cost compared to index funds because they tend to change the investments within the fund more often. Since they are attempting to achieve a higher return than the market, they frequently liquidate and make new purchases in order to hold the funds their research shows will perform well. The sale of current investments for new ones causes the owners of the fund to realize capital gains (which are taxed) more often.

Although we believe it is much more important to manage the overall allocation of assets in your portfolio based on your risk tolerance than it is to manage exclusively for taxes, your portfolio’s tax efficiency is still important to take into account.

Stock Markets

In 2015, domestic large cap stocks (S&P 500) and REITs were up while other markets were down – emerging markets were off big!  The positive results in the S&P 500 were driven by just two stocks – Amazon and Google.  Otherwise it would have looked like other market indices.  These results, I think, reflect ongoing economic uncertainty throughout 2015, much of which is still unresolved.  Examples include:  (1) Where is the bottom for commodity prices?  (2) What is the strength of the dollar as Europe eases its monetary policy and U.S. tightens it?  (3) Are interest rates withering?  The lack of resolution of much of this uncertainty will contribute to continued stock price volatility, which has certainly been the case so far in 2016.  The first week in January has the feel of panic – we’ll see.

Daily volatility of stock prices was up in 2015. This is especially apparent over the last couple of months and into the beginning of 2016.  Yet, the 2015 experience was pretty much in line with how stock markets have behaved historically.  We have become used to above-average returns with less volatility from the widely followed domestic markets in the recent past.  The 2015 story was different – below-average returns with greater volatility.

Bond Markets

After keeping us in suspense most of the year, the Fed voted to increase the rate on Fed Funds (rate at which banks lend excess reserves to one another overnight) by 0.25%.  This much anticipated change was met with a loud ho-hum – surprises are what move markets.  The accompanying Yield Curves chart, which shows yield to maturity from U.S. Treasury securities Yield Curves 12 2015
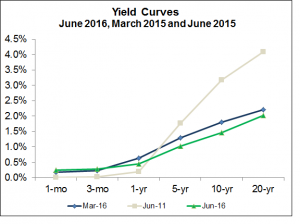
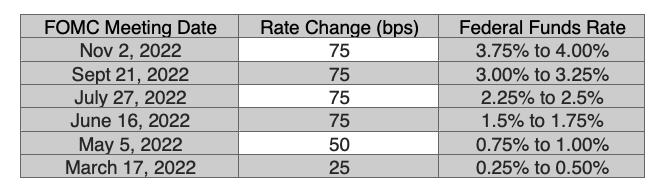
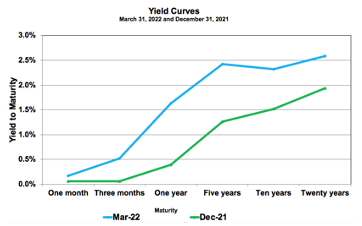
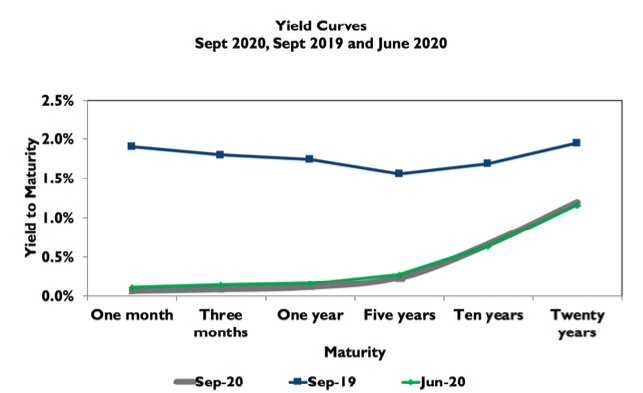
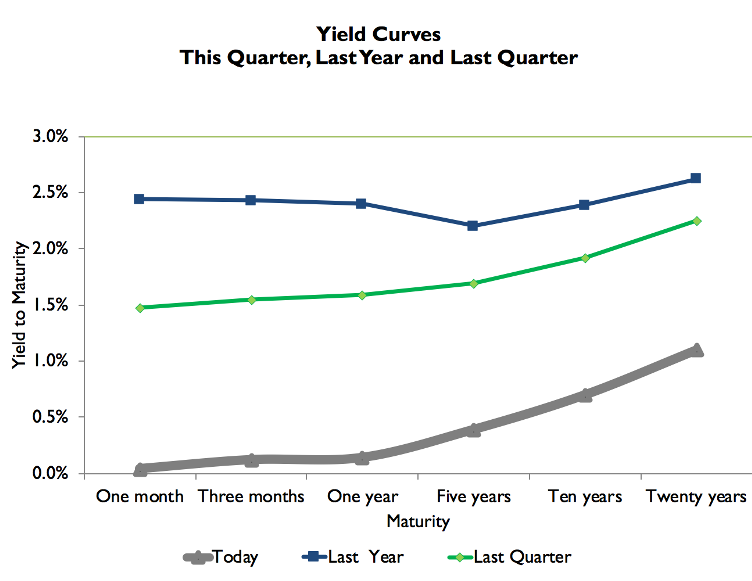
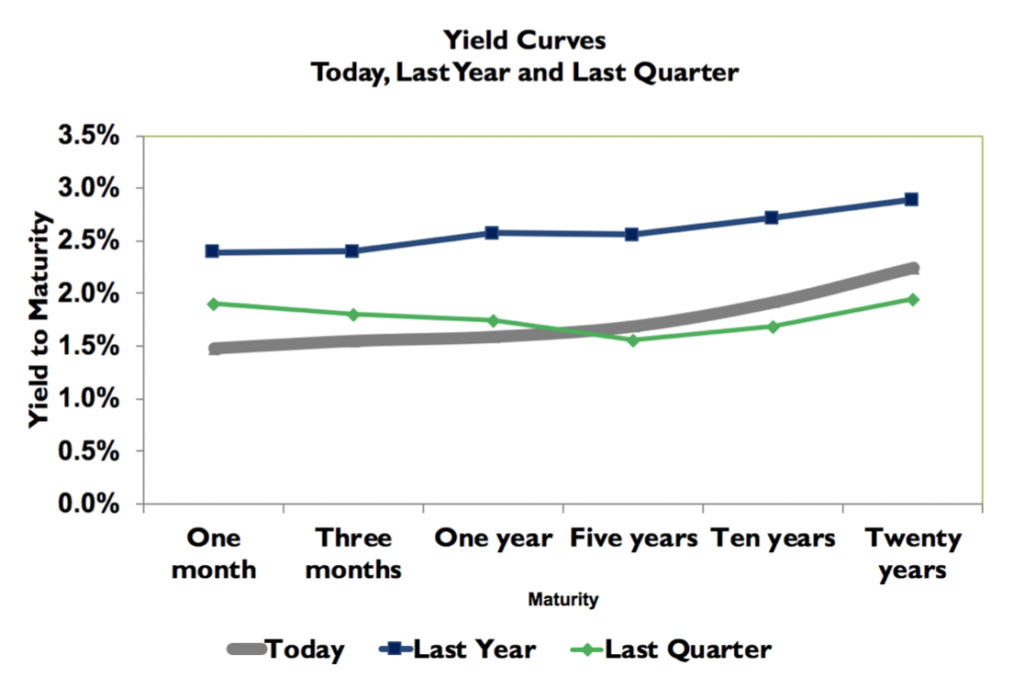
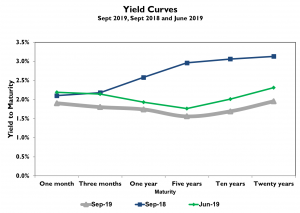
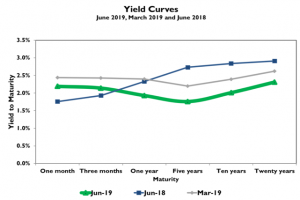
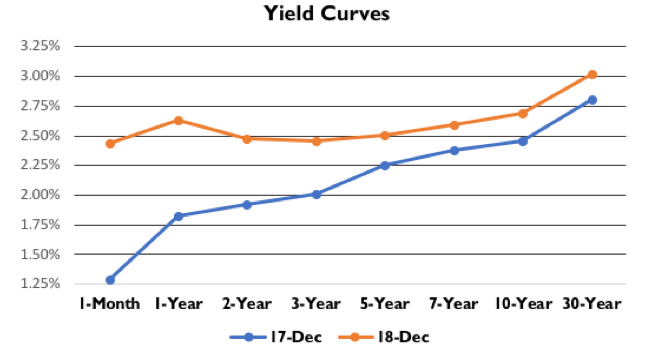
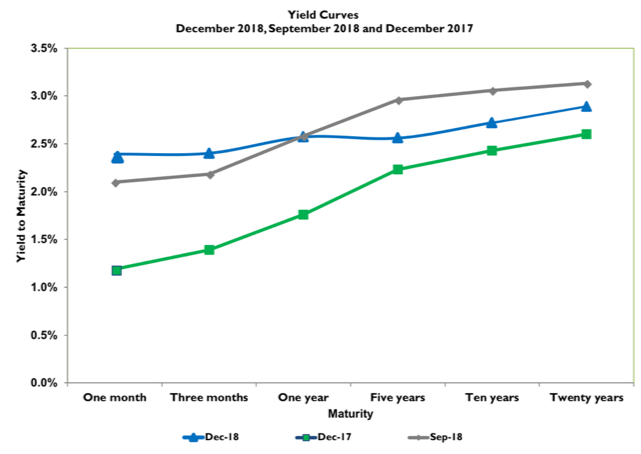
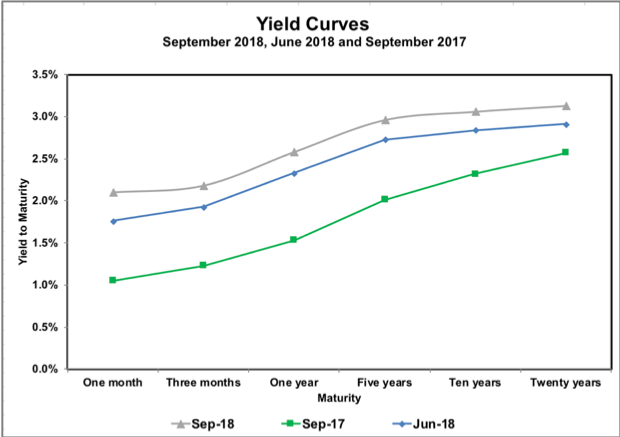
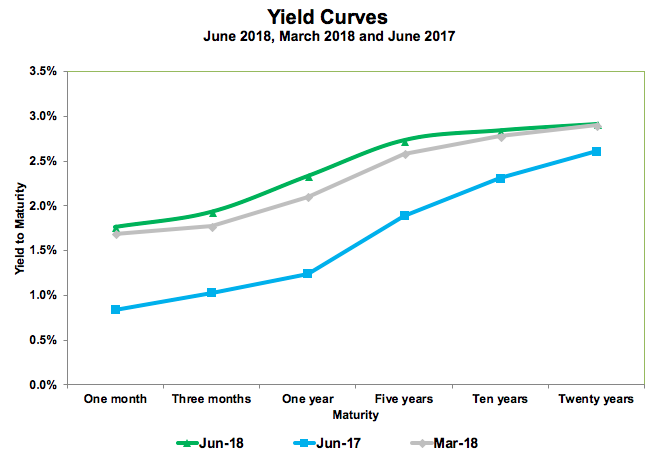
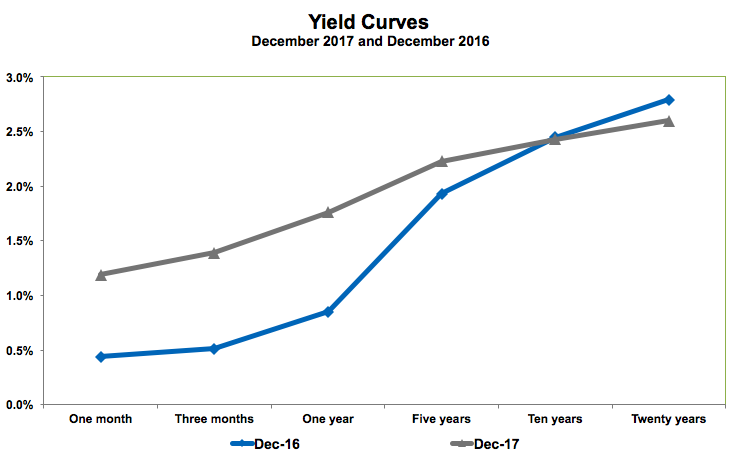
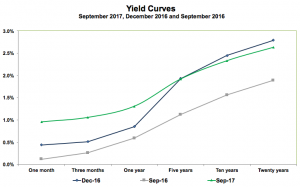
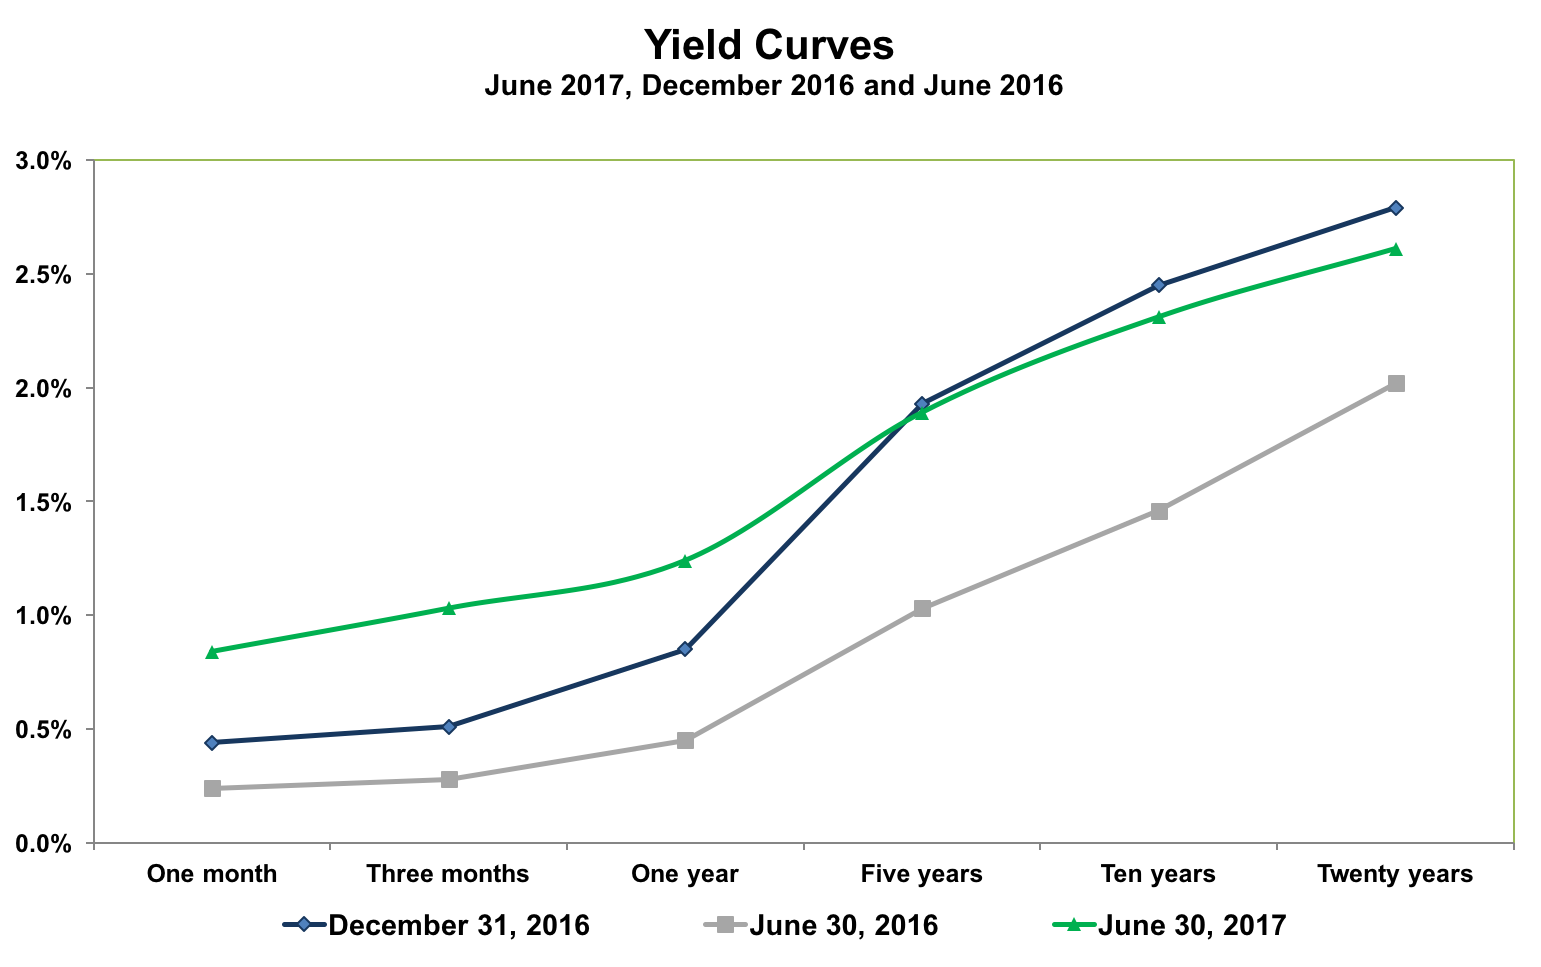
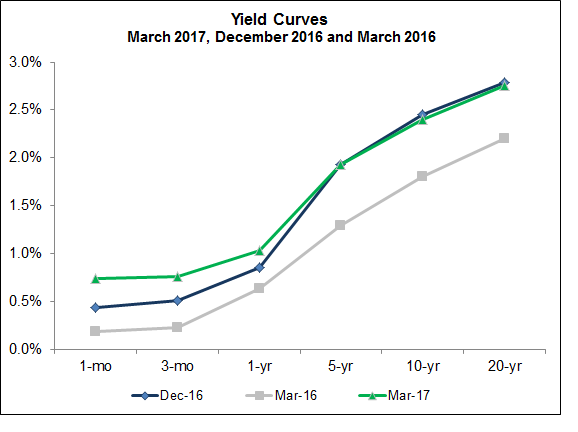
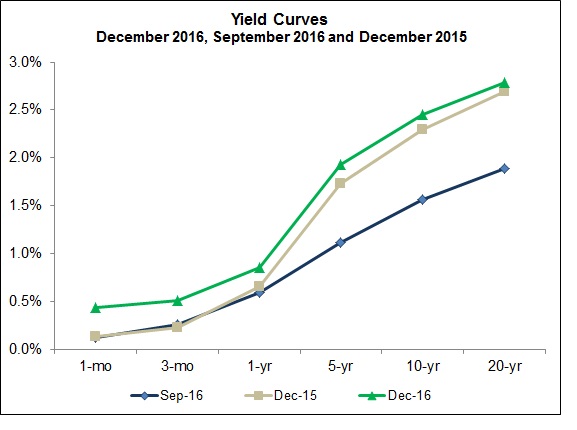
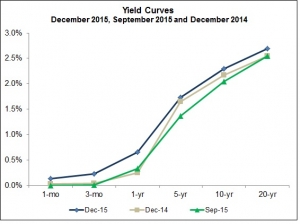
of different maturities, depicts increases at the short end with slight increases at longer maturities.  Yet, not much of a change overall.

While the impact of changes in the Fed’s policies on bond markets and where we go from here continues to provide uncertainty, I think a little less distortion of capital markets from the Fed’s activities is welcomed.

One of the tenets of successful long-term investing is the practice of portfolio diversification.  Through diversification, investors can increase their expected long-term return for a given level of risk (volatility).  This is accomplished by investing in assets that are not perfectly correlated to one another, but each asset individually has a positive expected return.  This theory is the basis of Modern Portfolio Theory (MPT).  Because underlying assets in diversified portfolios are not perfectly correlated, one problem with diversification is that there will always be something investors wish they didn’t own.

Emerging markets was one of the worst performing asset classes in 2015, returning a negative 14.6% for the year (as evidenced by the MSCI Emerging Markets Index).  If foresight were 20/20 at the beginning of the year, we clearly would have avoided a commitment to this asset class.

On the other hand, at the start of 2015, the best data source we had available for predictive purposes was the past behavior of the asset class.  Over the 15 years prior, the MSCI Emerging Markets Index returned approximately 10% annually and exhibited a standard deviation (risk) of 23% (based on monthly returns).  As important as its risk/return behavior, this asset class has not been perfectly correlated with other assets in which we invest, so it was expected to offer diversification benefits.  (Note this time period was used because it was the earliest data available for this Emerging Markets Index.)

Interestingly, the most similar asset class, with respect to risk and return over the same time period, was U.S. real estate (as evidenced by the Dow Jones U.S. Select REIT Index).  This asset class returned approximately 12% and exhibited a standard deviation of 23% as of 2014 (compared emerging market returns and risk of 10% and 23%, respectively).

Given the similarities between the asset classes at the end of 2014, an argument could be made that the 2015 returns might be expected to be similar.  Interestingly, they behaved extremely different in 2015.  U.S. real estate exhibited the best returns of the underlying asset classes, with the Dow Jones REIT Index returning a positive 4.5% for the year (versus the negative14.6% for emerging markets).  This return difference is more attributable to the lack of correlation between the two assets, in addition to their exhibited risk.

Since there is no evidence of investors being able to consistently outperform the market or predict the best asset classes (prior to outperformance), diversification continues to be the best alternative for successful long-term investing.

When we go to a good action flick, we enjoy the suspense and surprises, but no one wants that experience when investing.  James Bond and Mission Impossible would not be box office hits without some interesting plot twists, and an occasional victory by the villain, and yet the end result is usually something we expect – the good guy wins.

Unfortunately, investing can be a lot like a good action movie, and it is important to remember that 2015 was just one scene, where the villains had some success, but it is not the whole story.  While we have experienced 9%-10% returns from the stock market over time, we usually get something different.  Those expected returns only emerge over long periods of time.  Like the plot of an action movie unfolding, it requires some patience, and tolerating our hero experiencing some setbacks.

The S&P 500 has produced an annualized return of 9.7% over the past 50 years, but looking at those 50 separate one-year periods, we see something very different.  In 11 of those years the return was negative; 2015 is not one of those years as total returns with dividends were 1.4%.  Still, with a long-term return of 9.7% we might expect most years to have returns close to that, say a range of 5%-15%.  Surprisingly, 40 of the 50 one-year returns were outside that range, either less than 5% or greater than 15%.  So what we expect for the average is quite different than what we experience year to year.

One of the problems we have as investors is our tendency to overemphasize near-term performance.  Behavioral economists have labeled this the recency effect.  It explains why people want to buy what just went up, and sell what just went down (usually a bad strategy), and it can also explain why it is so hard for investors to maintain a long-term perspective.  This is one reason we recommend investing based on decades of performance data, not months or even years.

The markets are starting the new year with plenty of volatility and negativity.  Perhaps if we think of it as the unfolding plot of a good action movie, we will be more comfortable enduring the inevitable ups and downs, which must be endured to achieve our long-term expectations.

There is an endless amount of terminology that surrounds the finance and investment industries. It can certainly be confusing to the average investor, and may be responsible for some uncertainty when it comes to how to invest and which advisor to trust.

The Devil’s Financial Dictionary is a book that has recently been released by Jason Zweig, a Wall Street Journal columnist. His glossary lists several of these commonly used and complex terms alongside their satirical definitions. Zweig’s straightforward and candid guide is his attempt to enlighten the everyday investor, while making them laugh at the same time.

At Rockbridge, we understand how difficult it can be to find an advisor you can trust and who consistently makes decisions with your best interest in mind. We hope that you enjoy this humorous summary of Zweig’s new book as you enjoy the relaxing weekend with your families. Hopefully it will cause a few laughs and shed some light on exactly why we do things the way we do here at Rockbridge.

Stock Markets

The chart to the right shows what we have had to put up with recently:  all but REITs were down for the quarter (all were down since the beginning of the year), and emerging markets were downbig, showing variability over the trailing twelve months.  These periods remind us that markets do go down, but this is what it means to accept risk.

equity market returns 093015

Stock markets reflect the uncertainty of today’s economic environment, which includes the slowdown in China’s economy, the short-term impact as well as the longer-term sustainability of the sharp fall-off in the prices of energy and other commodities, and the effects of the Fed unwinding its easy monetary policy of the last seven years.  The impact of all of these factors on emerging market economies is especially worrisome and helps explain the sharp fall-off in those markets.

Perhaps the sharp fall-off in markets is a repricing of uncertainty.  Yet, all of these things have been pretty well known for some time.  The upheaval in just the last couple of months is somewhat a mystery, but is oftentimes how markets work.  Diversification has not been helpful in recent periods – most everything is down.  All that having commitments to bonds got us was avoiding losses, which, I suspect, is the best we can expect for a while.  Yet, I don’t know a better alternative than remaining committed across the board based on established tolerances for risk.  It is the best way to deal with market volatility and the unknowable future.

Bond Markets

Bond markets were about flat for the quarter but up a bit year-to-date.  While providing some respite from recent losses from stocks, this is about what we can expect.

Interest rate increases – feels like we’re “Waiting for Godot”!  The Fed seems to be poised to raise interest rates, which has been the case for a long time now.  This is beginning to take on some of the characteristics of the play “Waiting for Godot”, by Samuel Beckett.  I can’t help but wonder if “Godot” will ever get here, although I’m sure the Fed will eventually raise rates.  While many blame this uncertainty on what’s happening in today’s markets, it’s hard to imagine a 0.25% increase will cause much of an upheaval once it is digested.  But, it does reflect a change in policy that could result in dislocations.  We’ll see.

Emerging Markets   

Emerging markets were off more than 17% in the quarter and year-to-date.  A diversified emerging market portfolio includes allocations to over fifteen countries ranging from China (16%) to Chile (2%).  Using Exchange Traded Funds as proxies, the accompanying table shows the quarter and year-to-date returns in the countries that dominate (86%) the portfolio.  Note the evidence of contagion among emerging market economies as all experience a sharp fall-off in the September quarter.  And, in most instances, it was these results that dragged the year-to-date returns into negative territory. emerging market sept 2015

It seems clear that investors in stocks of emerging market countries have adjusted to the uncertainty of today’s global economy.  We will have to wait and see whether they have gone too far.  In the meantime, participation in the risks and returns of this asset class – which makes up about 14% of worldwide stock markets – is important to a well-diversified stock portfolio.

Predictions and Descriptions

At times such as these, everyone seems to be telling us to get ready for tough times ahead.  Maybe, but market prices anticipate the future about which uncertainty always abounds.  Price changes are driven by surprises.  You can’t predict surprises!

While the causes are constantly changing, if we accept that how market participants deal with an unknown future is consistent, then we can use past behavior to describe the future in terms of both what’s expected and, importantly, a well-defined range of possible outcomes.  The range for most stock markets is quite large – exceeding an annual rate of plus or minus 16% two-thirds of the time.

Stock market participants always expect positive outcomes.  Prices are established from arm’s length transactions by traders satisfied to buy from traders equally satisfied to sell.  Neither would trade unless they expected a positive result.  Of course, in the short run there will be winners and losers.  But, for them to continue to play, the ups and downs will even out and over the long haul markets will produce what traders, on average, expect.  How long must we wait for this to happen?  It could be a while. But, the alternative is to make moves based on someone’s prediction of a surprise!

Yale Beats Harvard – Again

So trumpeted a recent WSJ headline. Yale’s endowment, managed by David Swenson, earned 11.5% for the year ending June 30th.  His acolytes at Bowdoin and MIT earned 14.6% and 13.2%, respectively.  This compares to about 1% that benchmark proxies for a well-diversified portfolio would have earned.  How do these endowments do it?  They hold assets, generally under a category called “Alternatives,” that are not valued from arm’s length transactions – the returns can be whatever they want them to be!

College endowments don’t need to worry about needing cash – when they need money they go to the alumni.  So, the ability to readily turn investments into cash (liquidity) isn’t important.  Endowments can assume this liquidity risk, which can be large and should provide a significant premium.

Now it just may be that David Swenson has special gifts that allow him to identify assets and managers who will provide extraordinary results through time consistently.  And, these gifts can be passed on to whoever will listen.  However, the true value of the endowment’s nonmarketable assets will not be known until there is a need for cash, which is apt to be never.  In the meantime, they have latitude in reporting values and returns that are based on someone’s estimate.  Take with a grain of salt results posted from assets, the values of which are not determined from arm’s length transactions.

Measuring investment performance without a benchmark is like judging the results of a football game when you only know one team’s score.  To get the real story, there must be a “measuring stick.”  Obviously, in football you also need to know the opponent’s score.  In the case of investment performance, results should be compared to an overall market with similar risk characteristics.

Here at Rockbridge, we structure clients’ portfolios to maximize the probability of meeting long-term financial goals.  In doing so, we are committed to the idea that a portfolio’s asset allocation (mix of stocks and bonds) determines its risk profile.  Asset allocation is also what explains a portfolio’s long-term results, and the best way to implement these portfolios is through the use of market-tracking funds/ETFs.  The philosophy hasn’t changed, going back to the firm’s roots in 1991.  The use of benchmarks helps us measure if portfolios are delivering on their long-term objectives.

The following indices are generally used to construct our portfolios’ benchmarks:

S&P 500/Russell 2000 – Domestic Stocks

MSCI EAFE – International Stocks

Barclays Government/Credit Index – Bonds

In our benchmark construction, the amount allocated to each of the above markets mimics the risk profile it is designed to measure.  By design, many portfolios are diversified beyond the above benchmarks and include exposure to emerging markets and real estate.  Over the past quarter, this exposure has not helped overall portfolio performance when compared to benchmark results.  However, we continue to believe this diversification is appropriate and will bring incremental value in the future, as it has in the past.


No one likes to see their savings decline in value. Times like these are not much fun for investors, watching markets “correct” in the face of abundant global uncertainties. As investment advisors, one of our most important jobs is to help long-term investors keep hold of their long-term perspective. Here are some things to consider.

A drop in stock prices makes us feel poorer – like we lost something – but it only really matters if we are buying or selling now, and if we are buying (or adding to our 401(k)) it’s a good thing!

Watching stock prices fall, and our nest eggs shrink, makes us feel like our financial security is out of our grasp, or at least out of our control. At times like these people say things like, “maybe I should buy real estate.” Land and buildings seem more tangible and sure to hold their value. Of course in 2008 we found out that real estate doesn’t necessarily hold its value, and when it must be sold, prices can swing wildly, just like stocks.

The stock market is very liquid so shares can always be sold at some price. When we try to sell our house in a bad market we say “there just aren’t any buyers right now,” which really means there is no one willing to pay a price I will accept. I could sell at a fire sale price, and maybe my neighbors would feel like they just lost some of their wealth, but until it becomes a blood bath like 2008, most of us would ignore it. We would say, “I’m not selling my house now anyway, so it doesn’t matter.” The difference with the stock market is that we cannot put our heads in the sand and ignore it. The 24-hour news channels are bombarding us with the news of falling stock prices and a tsunami of global uncertainties.

This will likely be a down year for our client portfolios. For clients withdrawing from their accounts, we can use income or sell bonds to provide cash and avoid selling stocks at reduced prices. For others we will be using new cash to buy stocks at reduced prices, and sell bonds to rebalance portfolios by buying stocks.

Three- and five-year trailing returns for stocks are still well above long-term averages. While we could have an extended period of weak returns, we expect markets to behave much as they have in the past, providing reasonable returns to those willing to take risk. We remain convinced that diversification and a steady exposure to stock market risk is still the best approach for long-term investors who are willing to keep a long-term perspective.

When people think seriously about retirement, they often wonder if their savings are going to be sufficient to support their lifestyle in retirement. Few people are able to rely on pensions, and most young people assume Social Security may help their parents, but will be of no value to them. Obviously some things need to be done to fix the Social Security System for the long term, but for those of us approaching retirement in the next ten to fifteen years, Social Security payments will be an important part of the retirement income picture. More important than many people realize.

A recent study from the Center for Retirement Research at Boston College (Brown et al., March 2015) suggests that people find it difficult to value a lifetime income stream, and yet the value of Social Security may be as important, or even more important than savings, in determining financial security in retirement.

The researchers asked people to put a value on a $100 change in their Social Security monthly benefit. Participants were asked, if they could write a check now for an increase of $100/month in their lifetime income, how much would they be willing to pay? Most respondents were only willing to do this when the price was very low. The median price they were willing to pay was $3,000, which could be recovered in the first two and half years of higher payments! By way of reference, the actuarial value reported by the researchers is $16,855. Even more dramatic, to replace $100/month with a 4% withdrawal rate, you would need an investment portfolio of $30,000, but of course your heirs would keep the remaining principal in that scenario.

Helping clients decide how much investment risk is right for them may be the most important thing we do as investment advisors. We can provide advice, but the decision must be the clients’ own if they are going to remain committed in the face of adversity.

That decision can be difficult, but may be made easier when framed properly, or put in an appropriate context. Understanding the value of Social Security may be critical to making good investment decisions, yet this recent study points to how difficult that can be.

As an example, for a typical couple who has accumulated a million dollars by the time they retire, their savings could provide $40,000 per year at a 4% withdrawal rate. If they need $80,000 per year to support themselves in retirement, the $40,000 or so they may get in annual Social Security benefits are in one way equal to the income they may take from their savings (assuming a 4% withdrawal rate).   The payment stream from Social Security is not really worth $1 million, because there is no residual value for heirs, but it is an important part of the retirement portfolio.

Conclusions:

  1. Social Security is more valuable than many people think.
  2. The value of Social Security is important in the investment risk decision as the guaranteed stream of income provides stability, which may provide the confidence to take a higher level of investment risk in the rest of the portfolio.
  3. Better investment decisions can be made in a portfolio context, where all sources of wealth and income are taken into consideration.

When thinking about the risk of your investments, be sure to take a step back and look at the whole picture. Maybe you can take more risk than you thought!

In an unfortunate skiing accident, I recently tore the anterior cruciate ligament (ACL) in my left knee. I am now three weeks post-surgery and doing well, but beforehand spent a month tirelessly interviewing and researching surgeons to perform the operation. Through this process I figured out that they are all “really nice” people and because of this I was stuck in decision paralysis on who to choose. It wasn’t until I dug deeper that I found the perfect match for me, and I couldn’t be happier with where I am today.

In this case, digging deeper included the following:

  1. Who matches best with my personality and long-term goals?  
  2. Who has the most/best experience working on ACL repairs and especially the type I want to have? 
  3. I consider myself young and active. Does this affect what type of reconstruction I should have (hamstring tendon vs. patellar tendon vs. cadaver tendon)?

Choosing the right surgeon and surgery type was important for me and I wanted to make sure I didn’t regret my decision. After going through the above list, it was easy for me to narrow down the list of surgeons and confidently come to a decision I know was best for ME.

I believe the same holds true for people looking for a trusted financial advisor. At the end of the day, I believe, like surgeons, advisors are all “really nice” people, so investors must dig deeper to help find the right match for their situation. Usually a life event (marriage, children, retirement, changing jobs, etc.), just like my injury, sparks your need to look for an advisor or second opinion. Without the right list of questions, it’s easy for decision paralysis to take over!

Below are some questions that hopefully will help every investor distinguish the right financial advisor from the rest of the “really nice” people in the industry:

  1. Are they a fiduciary? In other words, do their goals align with yours and are they truly placing your best interest in front of theirs.
  2. Are they a Certified Financial Planner™ (CFP®)? CFP®’s have gone through rigorous coursework around financial planning and are better suited to help you understand how your savings will translate into available spending in retirement.
  3. Do they even offer comprehensive financial planning? Most investment firms only concentrate on how your money is invested, and often overlook the importance of how other factors will affect your retirement picture (i.e., Social Security timing, college savings, insurance needs, pension vs. lump-sum decisions, etc.).
  4. How much do they charge for their services? Costs are one of the few things you can control as an investor and have a large impact on your overall financial success. Make sure to find out what the advisor charges for their annual fee as well as what the annual charges are on the investments he recommends.

Just like my experience finding a surgeon, choosing the right financial advisor can prove to be tough and decision paralysis often takes over. Hopefully the list above will help you weed through the plethora of “really nice” people in this industry and find the perfect financial advisor for you.

“Rockbridge Investment Management Named a Top 100 Wealth Management Firm by CNBC”

SYRACUSE, NY – Rockbridge Investment Management, an independent, fee-only investment management firm serving individuals and families, has recently been named as one of CNBC’s Top 100 Fee-Only Wealth Management Firms.

Rockbridge is the only Central New York firm to join the elite list of wealth management firms across the country.  The ranking methodology, developed by CNBC in collaboration with Meridan-IQ, was carefully formulated based on a variety of standards, including: assets under management, number of staff with professional designations such as a CFP or CFA, experience working with third-party professionals such as attorneys or CPAs, average account size, growth of assets, years in business, number of clients and ability to provide advice on insurance solutions.

“We are pleased to receive this recognition and believe our ranking is a true testament to our profound commitment and dedication to client care,” comments Anthony Farella, CFP® and a Principal of Rockbridge Investment Management.  “As a fee-only based firm, we are built to provide a unique client experience to help families and individuals achieve long-term financial goals in a meaningful way.”

Since its inception in 1991, Rockbridge Investment Management has been providing sound financial advice to clients.  The firm manages $450 million and serves 531 families across the Central New York region.  In February of 2014, Rockbridge relocated to an expanded office in downtown Syracuse where it continues to meet the investment needs and goals of clients.

Rockbridge Investment Management is an independent, fee-only investment management firm serving individuals and families.  The firm advises clients in investment management, retirement planning, life transition planning and 401(k) Administration.  For more information, visit www.rockbridgeinvest.com.

In a recent Wall Street Journal (WSJ) article, the debate over whether to use active or passive investments was addressed. The conclusion was just use both! Let’s take a look at the five reasons they give to defend this neutral stance and see if they hold up to scrutiny. 

1. Use index funds for efficient markets, and active funds for others.

The rationale is that it is hard for active managers to beat the index in efficient markets like the S&P 500, but where they thrive is in less efficient markets like domestic small cap and international stocks.  

This sounds reasonable; however, the facts don’t back it up. According to the 2013 SPIVA study, which ranks active managers against their benchmark, the majority of active managers underperformed passive investments in 21 out of 22 categories over the 5-year period ending 12/31/13. Some conclusions from the study:

  • 79.4% of active managers underperformed large US stocks (S&P 500)
  • 74.8% of active managers underperformed small US stocks (Russell 2000)
  • 71% of active managers underperformed international stocks (EAFE)
  • 80% underperformed the “less-efficient” emerging markets asset class  

Clearly, the evidence suggests that active strategies are no more likely to outperform in less efficient markets. 

2. Keep the door open for beating the market. 

The article says, “Index mutual funds and exchange-traded funds offer a low-cost, tax-efficient way of matching broad market returns—which a large percentage of active managers can’t seem to do.”  However, they say there is an emotional element to investing you have to consider. People want to think they can beat the market and don’t want to settle for benchmark returns.

Well, sometimes I like to think I could play golf professionally, but then reality sets in as I wake up! Look at the stats from above; you are playing a loser’s game if you keep trying to beat the market.

3. Add an active manager to fine-tune the volatility of your portfolio. 

This reason doesn’t make much sense since active managers actually just layer an additional level of risk on your portfolio. An investor already has to deal with the volatility of the markets.  Why add the unknown human risk of an active manager to the equation?   

4. Use a mix of funds to hedge against market crosscurrents.  

Michael Ricca, managing director for Morgan Stanley, says, “Passive and active funds tend to perform better in different environments. It can be better to own an active manager who can scout for attractively valued securities or shift to sectors that might hold up better in a correction.”

I think the writers of this article are missing the point. Active managers have consistently underperformed their passive counterparts in 21 out of 22 asset classes over the last 5 years.  There is no credible evidence that active managers can add value through security selection. 

5. Use an active-passive blend to bring down overall expenses.  

The article says that “Many active funds charge 1% or much more in annual expenses, while index funds may charge as little as 0.05%. Even if you generally favor active funds, you might use a blend to lower your overall portfolio expense ratio to perhaps around 0.5%”.

Alternatively, you could use index or low-cost passively managed funds in all investment asset classes to reduce the cost of your investment portfolio. Remember, the saying “you get what you pay for” does not hold true when it comes to investing.

Does hiring an investment advisor improve your portfolio returns?  This question is often on the minds of our clients or prospective clients.  The value of an advisor is often easier to describe than define numerically.  Many clients find value in hiring an advisor to provide “peace of mind” and comfort that a professional is watching over their portfolio.  This value can be difficult to quantify because it varies by client. 

Value measurement – What is Alpha?
Investors have many tools available to evaluate the performance of portfolio managers.  One such tool is the Jensen Measure, named after its creator, Michael Jensen.  The Jensen Measure calculates the excess return that a portfolio generates over its expected return.  This measure of return is commonly known as Alpha.  Alpha is an elusive quality.  Very simply put, it is the ability to beat an index fund without adding risk to a portfolio. Investment managers are always seeking it but rarely sustain it.

The academic evidence strongly suggests that delivering above-average returns without adding additional risk is extremely difficult or nearly impossible in the long run.  However, most of what we read in the business news or watch on TV is directly aimed at uncovering the elusive manager able to “beat the market” and deliver consistent Alpha to investors.  The fixation on market beating returns has often led to dire results for the average investor. 

About 3%
So how does an investor measure the value of an advisor who plans to match market benchmark returns?  It’s a question that Vanguard set out to answer in a recently published paper for investment advisors titled “Putting a value on your value: Quantifying Vanguard Advisor’s Alpha.”  Vanguard explored the idea of advisor Alpha more than a decade ago.  They recognized that the conventional wisdom of advisors providing value by “beating the market” was outdated and disproved by academic evidence.  Interestingly, the areas of best practices for wealth management that Vanguard identifies are identical to the values we have been providing for clients for over 20 years.  They are:

  • Asset allocation
  • Low-cost implementation
  • Rebalancing
  • Discipline and behavioral coaching
  • Asset location
  • Optimal withdrawal strategy
  • Total return vs. income investing

Vanguard quantifies value-add of best practices


As a volunteer tax preparer for the AARP, I often review tax statements from many different brokers and investment companies. The Income Tax preparation process always seems to identify examples of the value of working with a trusted investment advisor.  Here are some examples from my experiences as a volunteer tax preparer for AARP from 2013 and 2014.

Cleo, a widowed tax client, called me last fall to tell me that her broker had retired and a new guy was taking over her accounts.  Cleo said that her deceased husband had been with that broker for many years and liked them.  She really didn’t know how her accounts were invested but her account did “quite well.”  (In 2013 nearly everyone in the equity markets did “quite well”, a relative term)  As I do her taxes this year it will become evident what her new broker has done with her account, especially if the sale of securities create a taxable event, probably to her surprise.  One of our Rockbridge practices is that we have at least two investment advisors who are familiar with each client, and their accounts, and are available if the primary contact is not.

This is similar to the broker moving from one firm to another and taking the account with them.  Most investors don’t realize how this will impact their accounts.  The broker typically sells the invested securities and replaces them with new, at the expense of the client in the form of sales charges, new redemption periods, or unexpected taxable income.  Most brokers’ income is derived from commissions on buy and sell transactions, so their objective is to buy or sell.  A fee only investment advisor like Rockbridge Investments has nothing to gain from the purchase or sale of securities, so would review the value and implications of changing securities with the client before acting.

One tax client in 2013 had sold all of his stocks and brought the Form 1099 showing the transactions which amounted to over $120,000.  His broker either didn’t advise him, didn’t know, or was more interested in the commissions on the sale, but his taxable capital gain on the sale of these stocks, held by him over many years, was over $25,000.  He was incensed that his income tax was so high, both state and federal.  He kept insisting that the money was his, that he should be able to keep it.  It was his, though the IRS wanted their share.  This is the kind of thing one would talk over with their investment advisor before selling everything.

My daughter called me recently to ask about a friend whose accountant told her to take her 401k plan with a former employer and roll it over into an IRA with an associate of his.  Accountants are in a great position to know about their client’s investments, but they are not investment advisors.  I told her that I didn’t know the employer, or the 401k investment options, or the competency, stability, or reputation of the “associate” and that her friend should know all of those things, and more, before making any distribution of her 401k monies.

Every year we get tax clients with distributions from several mutual funds or custodians, Franklin Funds, Fidelity, American Funds, T Rowe Price, Prudential, Met Life, Schwab, Vanguard, to name a few.  When I ask them how their investments performed last year, they typically say “pretty good”, or “not too good”, not really able to have a good idea of their results.  With investments scattered all over the place, one really never knows how they performed compared to relevant market benchmarks.  Our advice is to consolidate wherever possible.   The investor in the family may know what he or she has, but your spouse will never be able to figure it out when the time comes.

Last year one tax client brought his forms in for preparation, including his previous year’s return.  I noted an IRA distribution in 2011 from one custodian but none in 2012.  There was, however, a statement showing a considerable balance in that account.  It was the only IRA owned by this individual, age 74 and making required minimum distributions.  The penalty for not making the minimum distribution when required is half of what the distribution should have been.  We called his local broker who told us the broker on that account had left the firm.  Their response was “Sorry, the client should have told us to make the distribution.”  This would never happen at Rockbridge Investments where we review all client accounts and contact them during the year for distribution discussions.

Communication between the client and the advisor, and between advisors is important for the proper management of the clients’ investments.  Rockbridge has in place a unique system for recording and sharing internally important client information needed to manage the investments.

The Rockbridge Investment Management team is familiar with income tax implications of client transactions, and often discusses such with clients on their request.  However, tax preparation for clients is not practiced as a part of our fee-only investment advisor service.

I know this might be hard to imagine for most of us golfers, but which of the following scenarios would you rather choose:

1.   Shooting par every time you go out and play a round of golf.

2.   Shooting below par 25% of the time you play and failing to reach par the remaining 75% of the time


It’s an easy decision, right?

The game of golf has many parallels to investing.  A score of par is similar to a stock index.  It is the base score everyone is trying to reach.

Continuously shooting par, similar to passive (index) investing, is what we do here at Rockbridge.  We try to control costs, manage risk and get as much return as the markets allow.  With index funds, you always get what you expect when it comes to returns and are left with no surprises.  It’s much like going out and shooting par every time you golf.  Basically, we help you avoid the double and triple bogeys that we are all too familiar with!

The other scenario is to strive for a score lower than par, which is similar to active investing.  You incur additional costs – Wall Street “experts”– in an attempt to beat the return produced by an index.  However, evidence shows that you will only be able to do so 25% of the time.  The remaining 75% of the time you will underperform; and to make matters worse, you will underperform by a much bigger margin than you will ever outperform!  This makes perfect sense.  When active managers continuously strive for outperformance, they must take additional risks which lead to mistakes.  No different than a golfer trying to make eagle on every hole.  He will find himself shooting much worse with that constant added pressure!

The situation only gets worse with time as well. Just like shooting a score below par gets harder as we age, your chances of beating index returns goes down drastically when you look at longer time periods.  Over extended periods of time, your probability of beating index returns falls into the single digits!  Larry Swedroe, in a recent CBS News article, goes on to state that this value is lower than what we would expect by sheer chance!  When most investors are saving for long-term goals, like retirement, those don’t seem like odds I would be willing to pay extra for!

So, if shooting consistent pars on the golf course sounds like the no-brainer choice, then why do so many people still engage in active management when it comes to investing?  In golf, spending additional time/money to improve your game might pay off in a lower score, but unfortunately this does not hold true when it comes to investing.  Control costs and shoot for par (index returns) and you will be much farther ahead in the long run.  Sometimes it takes a simple analogy to help lead us to making wiser and more prudent life decisions!

The benchmark bond index that we follow, Barclays U.S. Government/Credit Index, lost 2.5%, the worst quarter since 1994.  In fact the quarterly result has only been worse 8 times in the past 40+ years (162 quarters).

The Barclays U.S. TIPS Index had its worst quarter ever losing 7.1% (data only goes back to 1997).

Markets do not like surprises – even when the information is not really a surprise.  The financial media has dubbed it the Taper Tantrum, which started when Ben Bernanke came out of the Fed’s June meeting and said the Fed would taper its purchases of long-term bonds, if the economy continues to improve.  The so-called quantitative easing program was intended to hold down long-term interest rates to encourage investment, lending, and economic growth.

The market was surprised by Bernanke’s comments, and long-term interest rates immediately jumped.

Morningstar recently reported, “Over the past two-plus weeks, many bond investors have headed for the exits, on the heels of Federal Reserve Bank chairman Ben Bernanke disclosing plans to end quantitative easing.”  This suggests that market participants were assuming the Fed would continue its bond buying indefinitely.

Two things strike me as very ironic:

  1. The market was surprised to hear that something always considered a temporary measure, would eventually end… (when unemployment falls to a target of 6.5% and economic growth seems sustainable without the crutch of monetary policy).
  2. The prospect of improving unemployment and economic growth hammered both stock and bond investors at the end of June, contrary to an expectation that confirmation of economic improvement should be good for stocks.

There is little doubt that markets will continue to be volatile as the Fed proceeds to unwind the unprecedented monetary policy currently in place.  Market participants will try to predict what is going to happen (interest rates will rise – that’s easy); when it is going to happen (more difficult); and how to take advantage (approaching impossible).

There has been a general consensus that interest rates must rise since the Fed took short-term rates to zero at the end of 2008.  Since January 2009 the bond index has provided an annual return of 4.8%, including the most recent quarter, while money market funds and short-term CDs have provided almost no return.  Once again illustrating our long-held beliefs:

  • Markets work, and respond to new information.
  • Markets cannot be predicted.
  • Long-term investors must be willing to endure quarters like this and maintain the discipline of a long-term strategy that is consistent with their risk tolerance.

Volatility returned this quarter in both stocks and bonds as fears about the central-bank actions across the globe made investors nervous about the future.  Large Cap U.S. stocks, represented by the S&P 500 Index, returned 2.9% in the second quarter, bringing the year-to-date return up to a lofty 14.0%.  By contrast, the EAFE Index, a measure of developed international markets, lost 1.0% in the quarter, bringing the year-to-date return down to 4.0%.  In fact, as shown in the graph at right, no other asset class comes even close to the return on U.S. stocks so far this year.

Bonds
The Barclays U.S. Government/Credit Index had a negative return of 2.5% for the quarter.  Bond returns move in the opposite direction of interest rates.  The yield on the 10-year Treasury moved from 1.6% at the beginning of May all the way to 2.6% in June, before pulling back slightly to end the quarter around 2.5%.  The increase in interest rates was the cause of the negative bond returns for the quarter.

Bond markets were hammered after Fed Chairman Ben Bernanke announced last month that the bank may start winding down its bond-buying programs.  The Fed policy of buying bonds to keep interest rates artificially low was intended to spur the economy and reduce unemployment.  Many economists came out against the policy fearing a dramatic increase in inflation.  However, inflation has been quite modest and the market expectation for future inflation is quite low.  While the Fed policy continues to be controversial, the unemployment rate has fallen to 7.6% as of the end of May 2013.

We still expect challenges ahead for the bond market as interest rates rise.  However, we cannot predict when and by how much rates will rise in the future.  Therefore, we continue to advocate holding high quality bonds in a portfolio.  Bonds dampen volatility of a diversified portfolio while also providing income over a long investment time horizon.

Other Asset Classes
Emerging Market stocks continued their year-long decline, reporting a negative return of 8.0% for the quarter.  Global uncertainty in these young volatile markets likely fueled the sell-off in emerging market stocks.  The Dow Jones REIT Index, a measure of the U.S. real estate market, also reported a negative return of 1.3% for the quarter but was positive year-to-date with a return over the last 6 months of 5.7%.  Emerging Market stocks and REITs continue to offer investors diversification benefits in global portfolio construction.

The Financial Industry Regulatory Authority (FINRA) is currently running a study on the financial savviness of the US population.  While a majority of people feel they have a good grasp of financial topics, the study shows that is not actually the case.

Below are a few of the study highlights:

  • 1 in 5 people are spending more than they earn
  • 1 in 2 people pay their credit card balances in full every month
  • 2 in 5 people can pass a basic financial literacy test (answering at least 4 of 5 questions correctly)

If you would like to review the entire study results, it can be found here: http://www.usfinancialcapability.org/results.php?region=US

If you would like to take the 5 question financial capability test yourself, the link can be found here: http://www.usfinancialcapability.org/quiz.php


You get what you pay for, right?

Actually, when it comes to investing, it’s what you don’t pay for that really counts. Vanguard’s latest ad’s have all revolved around “at-cost” investing for this very reason.

Check out the link below where Vanguard explains “at-cost” investing and how it can help investors reach financial success over time.

Vanguard’s At-Cost Investing Café

Remember, while you can’t control what happens on Wall Street, you can control how much you pay to invest.  By reducing your overall investment costs, you will be paving the road to a much brighter financial future!

Over the years there has been a shift of burden in retirement savings from the employer to the employee.  The era of company pension plans is fading, leaving Americans on their own to save for retirement; primarily through company-sponsored 401(k) plans. 

Frontline recently aired The Retirement Gamble, where it highlights some of the downfalls of company 401(k) plans and how they are keeping many investors from ever reaching a successful retirement.

Have you ever looked at one of your 401(k) statements and asked yourself “Why does it seem like this thing never goes up in value?”  The market has been good and you are making regular contributions to it, so why does it seem like something is eating away all your return?  It’s because there is:  FEES! 

So how can you control or minimize your fees?  The easiest way to do so is to cut your mutual fund costs.  The average actively managed mutual fund costs 1.3% annually to own, when you can purchase a passively managed mutual fund for a fraction of that price.  Very few actively managed mutual funds outperform their benchmark index, and picking which ones will do so ahead of time is yet another challenge.  Jack Bogle, founder of Vanguard, states in the documentary “that to maximize your retirement outcome you must minimize Wall Street’s take”!

Jack Bogle goes on to say that if you expect to get a 7% gross return each year and give 2% of that up to fees, then you are ultimately sacrificing almost two-thirds of your potential return! 

Assumptions: Start with $100,000 earning 7% annually for 50 years.  Red line
shows 5% annual return (7% return reduced by 2% of annual fees)

Jack continues by saying that “if you want to gamble with your retirement, be my guest.  Yet be aware of the mathematical reality that you may have a 1% chance of beating the market.  This has been proven true year after year, because it can’t be proven wrong”! 

Jason Zweig, an investing columnist for The Wall Street Journal, added that “one of the ultimate dirty secrets of Wall Street is that a great deal of fund managers own index funds in their own retirement portfolios.  This is something they don’t like to talk about unless you put a couple beers in them!”  So if these highly paid fund managers don’t even believe in their ability to outperform index fund returns, then why should we?

Remember, that as investors, we have to control the controllable, and mutual fund costs is one cost we can control.  We can’t know what direction the market will be heading in or what our annual return might be, but we can maximize the percentage of that return that goes into our pockets and stays out of Wall Street!

Steven Grey and Advisor Propsectives recently published a stellar article titled “The Myth of the Casually Competent Investor”.  Not only was he spot on with his analysis, he gave some great analogies about how everyone considers themselves qualified to beat the market.

A small snippet of the article shows two great examples of how silly it would sound for other professions to be casually involved.

In most serious undertakings, the barriers to entry rise and fall with the complexity of the task.  No one becomes an airline pilot merely by pinning a pair of plastic wings to his lapel.  Nor is anyone permitted to perform an appendectomy simply because she had decided that morning that she was qualified to do so.  And yet every day apparently intelligent people essentially declare themselves competent investors, as if the act of deciding somehow makes it true.

Much of this comes down to self-realization and self-awareness.  We all have our own strengths and weaknesses, but they are often very difficult to identify.  An example that I use quite frequently for individuals that pick stocks is:

As an electrical engineer, do you feel more knowledgeable about Apple than the dozens of technology experts sitting on Wall Street analyzing the stock 24 hours a day for their full-time career?  If so, why are you an electrical engineer and not a day trader of Apple stock?

Over the weekend, enjoy this excellent article and consider if you are fall into the characteristics of a Casually Competent Investor.

During this time of the year office brackets and friendly wagers are seen everywhere, luring in even the faintest of sports fans.  This epidemic, also known as March Madness, has gotten ahold of everybody and is the craze of the nation for almost a full month!  So besides edge of your seat excitement filled games, what other takeaways can this basketball tournament bring us?

Let’s take a look at some common mistakes made when filling out your brackets and why you want to make sure they don’t translate to the way you run your personal finances!

Hometown Bias: People have a tendency to be partial towards what they know.  In NCAA Tournament brackets, this is seen by people advancing teams they know or have heard of.  They build a bias in their heads that since they know the team, they must win.  This is apparent by the plethora of Central New Yorkers advancing Syracuse to the NCAA championship, the staggering amount of all Big East teams in the Final Four, and other similar bias’ you see every day in local office bracket pools.

The key is to not let this bias run into your personal investing life.  Just because you work for a company, recognize a stocks name, or feel you know a particular industry does not mean that it is worth owning.  Take a step back and make sure you are making a sound investment decision, and not an off-the-cuff “hometown bias” guess!

Expert Analysts:  Being an expert does not always give you an edge, but rather can make you more dangerous.  This was very evident in our Rockbridge office pool where Tony’s ten-year-old daughter, Lauren, has won two of the last three years!  I’m a bit embarrassed to admit it, but there are very few college basketball games I don’t watch; however it certainly didn’t give me any strategic advantage over Lauren who filled out her bracket over a bowl of Cheerios the morning they were due!

Overconfidence can lead investors to believe they can outperform the market.  It will lead you to make non-prudent investment decisions that will ultimately have a negative effect on your retirement portfolio.  One basketball expert couldn’t see any way for this small school to make it to the Final Four.

No. 8 Pittsburgh over No. 9 Wichita State: Pittsburgh goes 10 deep with no stars. The Panthers are a very good offensive rebounding team, ranking fourth in the nation in getting more than 40 percent of their own misses … Because Pitt is better on the offensive end, The Bilastrator favors Pittsburgh, and the Panthers will move on to face Gonzaga.  “

–        Jay Bilas, ESPN Analyst 2013

Don’t leave your retirement accounts to chance.  Make sure you have a financial plan in place and be disciplined enough to adhere to it.  Even bright people make bad predictions.  Don’t let your finances fall victim to one of them!

The Cinderella Story:  We Americans love our underdog stories.  When I glance at ESPN in the morning it is filled with the best of yesterday’s sports, which always includes a few “Cinderella-like” comebacks! Have you ever seen a movie where the worst team in the league didn’t end up winning the championship in a stunning comeback?  A team that starts out bad and stays bad just isn’t worthy of the spotlight! I certainly remember the 2010 NCAA Tournament when my alma mater, Cornell University, made it to the Sweet 16!  I seem to forget to mention their quick exit from the tournament in 2008 and 2009. Ooops!

So don’t forget the parallel that can be made to your own finances.  We all know the guy who tells you about the great stock he bought and how it has tripled in value since, but what do you think he is choosing to not tell you? Stick with what you can control when it comes to your finances and leave the guesswork to your office NCAA Tourney pools!

Market Commentary

Stocks wrapped up a stellar first quarter with the S&P 500 finishing at an all-time high, besting its last high in October 2007.  For the quarter, large-cap stocks (represented by the S&P 500) were up 10.6%.  Small-cap stocks also did quite well, returning 12.4% in the first quarter.  International markets had a positive return of 5.3% January through March, while emerging market stocks lost some ground, with a negative return of -1.5%.  Domestic real estate did well, gaining 7% as measured by the Dow Jones US Select REIT Index.

Positive economic news likely fueled the excellent quarter for all stocks.  The final government report for fourth-quarter GDP showed an annual increase of 0.4%, slightly higher than the expected increase of 0.3%.   The housing market has continued its slow comeback from the Great Recession, though the housing market in general has benefited from record low interest rates and improving employment conditions.  The supply of new homes remains near record lows while median home prices rose 2.9% year over year to $246,800.  The decline in consumer confidence in March and the increase in jobless claims over expectations did not seem to have a negative impact on the strong stock rally this quarter.

It is not likely that the stocks will continue to rise at this torrid pace.  History says double-digit stock market gains in the first quarter all but assure a gain for the full year, however the average gain is 1.4% for the remainder of the year.

Challenges ahead for the bond market

Bond returns were near zero for the quarter with the benchmark Barclays US Government/Credit Bond Index down (0.16%).  The Federal Reserve is acting aggressively to keep short-term interest rates down while also buying treasury bonds that depresses long-term bond yields.  The Fed does not look to change course anytime soon. When the Fed does decide to raise interest rates, it plans to do so slowly.

The bond market had a great 10-year run that mathematically is virtually impossible to duplicate due to the very low yield environment.  However, it is critical to remember the importance of bonds in a globally diversified portfolio.  The ability of high quality and less risky bonds to smooth out the volatility of an overall portfolio that contains domestic and international stocks is critical to long-term investor success.

Investing is uncertain

Building investment portfolios is what we do.  We build them for real people who want to maintain their standard of living in retirement.  We integrate the best scientific evidence with the art of portfolio construction in an effort to give our clients the best possible chance of being successful investors.  However, markets are uncertain and risky by nature so we also spend time making sure our clients do not make emotional decisions based on short-term events or news.  Doom and gloom sells newspapers and books so we often get questions about the impact of recent events on our clients’ portfolios.

I will contrast two very different opinions that I’ve read recently.  First, David Stockman wrote an opinion piece in the New York Times promoting his book “The Great Deformation: The Corruption of Capitalism in America”.  The New York Times article was so popular it went viral on the web.  The crux of the article and the book is this: the country’s economic condition is worse than everyone thinks and on the brink of collapse in the near term future.  Stockman is a former congressman and director of the Office of Management and Budget under President Ronald Reagan.  He is clearly a smart and experienced man who has proffered his thoughtful analysis.  Stockman’s prescription for investors is to flee the stock market and keep all your money in cash.  Contrast that opinion with Warren Buffet, arguably the most successful investor in history, who shared his thoughts in his much anticipated annual letter to shareholders of Berkshire Hathaway.  Quote from the shareholder letter:

American business will do fine over time. And stocks will do well just as certainly, since their fate is tied to business performance. Periodic setbacks will occur, yes, but investors and managers are in a game that is heavily stacked in their favor. (The Dow Jones Industrials advanced from 66 to 11,497 in the 20th Century, a staggering 17,320% increase that materialized despite four costly wars, a Great Depression and many recessions. And don’t forget that shareholders received substantial dividends throughout the century as well.)

Since the basic game is so favorable, Charlie and I believe it’s a terrible mistake to try to dance in and out of it based upon the turn of tarot cards, the predictions of “experts,” or the ebb and flow of business activity. The risks of being out of the game are huge compared to the risks of being in it.

End quote.  The contrast can be boiled down to “pessimism” vs. “optimism”.  While Stockman may be correct in articulating the very big problems facing America, I do not believe that we are facing the downfall of capitalism in general. I prefer the optimistic view of the future described by Warren Buffet and I expect the markets to survive and reward those willing to endure the risks of investing.

The NY Times blog author Carl Richards hits the nail on the head when he highlights how emotions are once again taking over media and investor behavior as the stock market presses higher and higher. The question being asked is  “Should we buy or should we sell?”  as many rush into the market at its recent highs. He goes on to say the real question investors should ask themselves is “How can we avoid this common behavioral mistake in the future

In keeping with our philosophy at Rockbridge Investment Management he concludes that we can avoid this mistake by having a written investment plan that includes:

  1. Why are you investing this money in the first place? What are your goals?
  2. How much do you need in cash, bonds and stocks to give you the best chance of meeting those goals while taking the least amount of risk?
  3. What actual investments will you buy to populate that plan and why? Make sure you address issues like diversification and expenses.
  4. How often will you revisit this plan to make sure you’re doing what you said you would do and to make changes to your investments to get them back in line with what you said in number 2?
Here at Rockbridge Investment Management, we feel having a written plan and answering these questions is indeed the starting point for successful long term investing.


In a recent WSJ article, Seven Resolutions to Get Your Nest Egg in Shape, the author points out that many Americans are behind on their preparations for retirement.


Below are some eye-opening stats:

– 67% of workers say they are behind schedule in planning and saving for retirement!

– Less that 60% of families are currently saving for a later life.

–  Only 40% of workers over 55 years old, have accumulated more than $100,000 in retirement savings.


It’s not too late to get your financial ducks in a row!  Take control of your retirement, and if you want a partner to help you do so; give us a call!

A recent article in The Economist talks about the reasons to stick with low cost ETF’s and proper asset allocation for the long term success.

“The best way for investors to play the odds is to choose low-cost ETFs or trackers and diversify geographically and across asset classes. It is not an exciting strategy. It will not bring anything to brag about at dinner parties. But it will mean that more of their money stays in their own pockets, and less goes to buy other people’s mansions in Mayfair and the Hamptons.”

Remember, successful investing is not supposed to be glamorous.  Find something else to chat about this holiday season and your retirement accounts will thank you for it!

The daily fiscal cliff news coverage is causing irrational investor behavior regarding unrealized long-term capital gains (LTCG).  Without congressional action the LTCG rate is set to increase from 15% in 2012 to 20% in 2013.  In addition, high earners are subject to a 3.8% Medicare surtax applied to all capital gains. (income greater than $250,000 for married filing jointly, $200,000 for singles, $125,000 for married filing separately).  The proposed tax rate changes are far from certain and may not be resolved well into 2013.

In order to accurately determine if a year-end sale is the right decision, the pros and cons must be weighed against each other.

Reasons to sell appreciated assets by year end

  • When the money is needed – If the money is needed this year or in the near future, take advantage of the guaranteed 15% LTCG rate.
  • Rebalancing needs – Selling an asset as part of a routine rebalancing process is another good reason to sell an asset by year end.

What are you giving up?

  • Charitable donation step-up basis – If charitable giving plans are in the near future, realizing the gains now would result in unneeded taxes paid.
  • Estate step-up basis – Under current law, all appreciated assets get a step-up in basis upon death.  While this will not help the owner of the stock, the estate, spouses and heirs could greatly benefit by this rule.
  • Built Up Long-Term Losses – Long term losses will become 33% more valuable if the capital gains rate goes up to 20%  (59% more valuable if the 3.8% Medicare surcharge is applicable to you).
  • Smaller Tax Bill – Selling assets with long-term capital gains will increase the 2012 tax bill.  Another item that is often not considered is the Alternate Minimum Tax (AMT).  A large long-term capital gains sale could easily trigger AMT on an individual’s tax return negating the small benefit of selling the gains prior to a rate increase.

Payback Period
The year end tax planning decision is purely a factor of when the assets will be needed.  An example is the best way to look at the situation.  If an investor has a $100,000 LTCG and sells them in 2012, that investor will have a federal income tax bill of $15,000, excluding AMT implications.  If that investor were to buy back the stock, they could only use the remaining $85,000.  Over time the $5,000 tax savings (between a 15% and 20% LTCG rate) would be offset by the compounding interest realized by the $100,000 investment over the $85,000 investment. With average real market returns of 6%, the payback of holding LTCG is less than 6 years.

The table below depicts the required number of YEARS that LTCG must be held to come out ahead of the potential tax changes in 2013:

New LTCG Tax Rate

Real Growth Rate (Excluding Dividends)

2%

4%

6%

8%

10%

20%

17.5 yrs

8.9 yrs

5.9 yrs

4.4 yrs

3.5 yrs

23.8% (20% + 3.8%)*

27.4 yrs

14.5 yrs

9.8 yrs

7.3 yrs

5.8 yrs

*This rate applies to high income earners

The long term capital tax rates remain uncertain.  Making portfolio decisions based upon a potential tax law change is a mistake for both clients and advisors.  While each situation is unique, there is no compelling reason that realizing capital gains now is a better decision than doing nothing.

I have seen people drive miles out of their way for the cheapest gas, shop at multiple grocery stores for the best prices, and even wake up at uncanny hours to receive the best deals on holiday presents!  As consumers we are always looking for a good deal, and price is one of the largest factors in determining if we have succeeded!

Fortunately for the everyday investor, investment companies are now starting to compete on cost as well. 

  • 9/21/12:  Schwab announces that is has the lowest expenses among ETF providers.
  • 9/26/12:   Vanguard rebuts with its article, Low Costs:  Part of our DNA.  In this article Vanguard explains that they have adhered to this low cost philosophy with its funds since the founding of the company. 

Competition among investment companies can help price similar products efficiently for the everyday investor.  Also, Schwab and Vanguard are seeing more assets flow into their ETF’s and index funds as of late because “it’s becoming more and more clear that it’s difficult for a manager to consistently outperform [their respective index]” says Mike Rawson, an ETF analyst for Morningstar, in a recent Investment News article.

With market returns being below historical averages over the past decade, investors seem to be “tightening the belt” and focusing their attention on the bottom line.  Rawson also stated that “costs matter more when expected returns are low.  If you’re expecting only a 2% or 3% return, a 1% fee seems a lot more expensive.”

Rawson is right.  However at Rockbridge, we think that price ALWAYS matters, thus why it is important to control the controllable.  In a low return environment, giving up one third of your overall investment return to fees is not a recipe for success!

Our motto here at Rockbridge is “Building Wealth with Simple Disciplines” and we have been doing that for clients since the early 1990’s.  It seems that the financial industry may be catching onto some of our beliefs, which is a good thing for investors everywhere.  However, if this is just another one of Wall Street’s short fads, I can promise you one thing – Rockbridge won’t be abandoning ship!

The global equity markets continue to experience disappointing returns.  In discussions with clients, my advice is a reminder that the research shows that developing a strategic asset allocation plan and staying the course through rebalancing is the prudent course of action.

The European sovereign debt crisis is in its third year and continues to create great uncertainty in global financial markets.  Investors globally are expressing concern about the impact of the crisis on economic growth rates and the financial system.  Understandably, this is an anxious time for investors.

Europe’s inability to deal conclusively with its problems is discouraging.  It is obvious that the issues facing Europe will not be resolved in the short run.  But exiting European investments entirely seems like an overreaction.  In fact, European equity price/earnings ratio, a common means of valuation, indicates that European equities are reasonably priced.  It is certainly better to invest when valuations are low, and one should never make investment decisions based on today’s headlines.

A deep European recession would likely have a moderate impact on the U.S. economy.  Europe accounts for 15% of total U.S. exports or about 2% of U.S. GDP.  European markets represent 14% of total revenue of the S&P 500 companies.  The U.S. economy should prove resilient enough to weather the most likely bad scenarios – e.g., weaker countries such as Greece exit the euro.

Economic problems exist in Spain, France, Italy, Portugal and Greece.  Greece has been generating most of the headlines, but it is a small country by market capitalization and therefore makes up a very small portion of portfolio holdings within the global equity funds that Rockbridge utilizes.

Of course, global equity funds also have sizable holdings in non-European markets, both developed and emerging.  These markets have had mixed recent results.

Exposure to international equities, which often behave differently than domestic equities, are a way to provide the diversification that tempers a portfolio’s volatility.  Basing investment decisions on headlines, fear, or speculation is always counterproductive.  Being calm and disciplined with our asset allocation strategies is the better approach.  If you have concerns on your allocation to global equities, talk to us.

Dalbar, an independent communications and research firm, has done countless studies trying to quantify the impact of investor behavior on real-life returns.  Their studies focus on the difference between investors’ actual returns in stock funds to the average return of the funds themselves.  Basically, they are comparing the return the investor gets to the return the investments get.

The results are eye-opening!  In 2011 Dalbar found that the average equity fund investor underperformed the broad U.S. index return (S&P 500) by 7.85%.  This difference in return comes from investors making classic behavioral mistakes time and time again.  In my eyes, an investor’s biggest hurdles to reaching financial success are their own ego and emotions, and these are probably the two hardest things to overcome!

The numerous market gyrations of the past decade have challenged even the most disciplined investors and caused many people to run for safety.  These tend to be the most challenging times for us as advisors, because it involves avoiding what feels like a good decision at the time and helping you come up with what might be the more logical one.  Basically, helping YOU, not your EMOTIONS, run your retirement account.

The two vertical lines on the graph at right (at March ’09 and September ’11) represent the times in which we fielded the most client calls here at Rockbridge.  The markets were down drastically and, rightfully so, investors were nervous about what to do with their money.   The common theme we heard was, “Should we pull the money out now and wait for the market to gain some stability?”  Much to their discomfort at the time we did the contrary and held course.  The blue line shows the outcome of staying invested for the full decade, while the red line shows how moving out of the market and into “cash” at the wrong times can affect your long-term performance.  In this particular scenario, poor timing in the market cost the investor over $70,000 during the decade.

The picture below also illustrates what not to do in investing.  If you buy when the market is up, or sell when the market is down (out of fear or your emotions), you will do nothing but hurt yourself financially.  So maybe we need to look at this drawing upside down and remember what Warren Buffet continually preaches:  Be fearful when others are greedy and greedy when others are fearful!

Remember that successful investing is about “controlling the controllable and ignoring the rest.”   We can’t control the direction of the financial markets, but we can avoid making costly mistakes by attempting to do so.  The smartest people I know are the ones who understand that they don’t know everything and put policies in place to protect their portfolios from their own emotional behavior.  When it comes to financial success, slow and steady does WIN the race!

Bonds will be a terrible investment over the next 10 years.  That is the conventional wisdom in the investment community lately.

“Bonds are the worst asset class for investors,” says Professor Burton Malkiel, the author of A Random Walk Down Wall Street, in an opinion piece published in late March in The Wall Street Journal.  “Usually thought of as the safest of investments, they are anything but safe today.  At a yield of 2.25%, the 10-year U.S. Treasury note is a sure loser.”

This prediction may or may not be correct; however it is important to review the reasons why investors should hold bonds in a diversified portfolio.

What Are The Risks of Owning Bonds?
There are 3 components of risk in owning bonds.  Issuers of bonds (corporate or government) can default and not repay you.  Default risk can be very low (U.S. Treasuries) or quite high (corporate junk bonds).  As interest rates rise, the market value of your bond holdings will go down (interest rate risk).  Over the past ten years bond returns have been very good due in large part to the increase in market value as rates went lower and lower.  Inflation is a source of risk that greatly impacts an investor’s purchasing power in retirement.  For retired investors, interest and dividends are an important source of income.  If inflation outpaces interest rates, the bond investor’s purchasing power decreases.

It is likely that bond returns will not be nearly as good as they have been over the past ten years.  So what should an investor do about it?

  1. Sell bonds and move into cash or CDs, waiting for interest rates to rise.
    While it seems like a good strategy, it’s very difficult to predict when rates will rise.  They may stay low for several more years.  Inflation is likely to outpace interest payments from cash reducing their real value and purchasing power.
  2. Sell bonds and re-invest in the stock market.
    In addition to expected return, high quality government bonds are a low-risk way to diversify a stock portfolio.  An investor would greatly increase portfolio risk using this strategy.  Ask yourself if you can stomach the volatility of a 100% stock portfolio during a period like 2008.  Most investors would be unable to ride out that storm.
  3. Reach for higher dividends by reallocating to longer-term or corporate bonds.
    This strategy will also increase risk in a portfolio.  Longer-term bonds are more volatile and sensitive to interest rate changes.  Corporate bonds increase default risk if the business offering the bond fails.
  4. Do nothing.
    Bonds are in a portfolio for good and valid reasons.  Over the long term, interest income – and the reinvestment of that income – accounts for the largest portion of total returns for many bond funds.  The impact of price fluctuations can be more than offset by staying invested and reinvesting income, even if the future is similar to the rising-rate environment of the late 1970s and early 1980s.

I don’t recommend selling bonds and buying either cash or stocks.  However, there is merit in adding longer-term Treasury Inflation-Protected Securities, or TIPS, and short-term corporate bonds into a portfolio for investors willing to accept the additional risk.  There is no way to reliably predict future interest rates or inflation, so most investors will fare very well by leaving their bond allocation alone and riding out the market cycle.

Many aspects of life require careful consideration and balancing of the tradeoffs that arise from competing demands. For example, a common lifestyle tradeoff is working longer hours versus spending more time with your family. The competing demands within this decision are the income necessary to provide a suitable quality of life for your family versus the immeasurable benefits of quality time with your family. There is no right answer, but most people understand the tradeoff and attempt to find the balance that is right for them.

Successful investing and financial planning also require balancing tradeoffs. For example, a common investment tradeoff is that of risk and return. One of the competing demands is preservation of capital versus preservation of purchasing power. The former may allow for a better night’s sleep during periods of heightened uncertainty and corresponding volatility, but the latter helps ensure you’ll have a comfortable bed in the future when accounting for rising prices from inflation. Once again, there is no right answer, no “optimal” solution. Understanding the tradeoffs between preserving capital and preserving purchasing power will help investors find the balance that is right for them. This balance will depend on their definition of risk and attitude towards it.

Some investors may consider risk to be volatility. They have difficulty stomaching the daily ups and downs associated with investing in asset classes that experience significant price fluctuations, such as equities, because declining prices are often accompanied by predominantly negative headlines. Although information will be reflected in prices before one can react to it, this is little solace to investors who extrapolate the recent past into the future and see the bad news as an indicator of what’s to come rather than a commentary on what has already happened. These investors yearn for short-term preservation of capital.

Other investors may define risk as a diminishing standard of living. They have long-term financial obligations, such as spending during their retirement years, and their primary goal is building wealth to meet those future expenses. They recognize that, while the cumulative effects of inflation are sometimes glacially slow or even undetectable in real time, inflation can be the silent killer of a financial plan. These investors desire long-term preservation of purchasing power.

Investing is relatively straightforward when the definition of risk and attitude toward it are so black and white. For example, you can virtually guarantee the preservation of capital by investing in the equivalent of Treasury bills as long as you accept the corresponding potential for the loss of purchasing power. On the other hand, you can preserve purchasing power by investing in asset classes with expected returns exceeding inflation, providing you accept price fluctuations that can temporarily impair your capital.

Unfortunately, in practice, investing isn’t that simple. Individual investors rarely have black and white objectives or well-defined definitions of and attitudes towards risk. Some expect long-term preservation of purchasing power and short-term preservation of capital. Making matters worse is the tendency for the priority and relative importance of their competing demands to change through time, often in response to what’s happened in the recent past.

Investors who succumb to the cycle of fear and greed end up chasing a moving target. Advisors can try to mitigate this destructive behavior by focusing investors on the tradeoffs that were made at the outset when determining their balance between assets that are expected to grow faster than inflation and those that stabilize the portfolio and reduce its fluctuations. So if an investor is now fearful and therefore more focused on capital preservation, it is time to reframe the tradeoffs by emphasizing why growth assets were in the portfolio to begin with and how the so-called “riskless” asset (i.e., bills) can actually be extremely risky in the long run.

For example, Table 1 contains annualized returns from Australia, Canada, the US, and the UK for more than a century. Bills only slightly beat inflation before tax, but this small return advantage can easily disappear on an after-tax basis.1 Nonetheless, the table clearly demonstrates that equities have delivered returns exceeding both bills and inflation by a wide margin, even when accounting for taxes.2

Table 1: Annualized Nominal Returns (1900–2010)

Country Inflation Bills Equities
Australia 3.9% 4.6% 11.6%
Canada 3.0% 4.7% 9.1%
US 3.0% 3.9% 9.4%
UK 3.9% 5.0% 9.5%

In local currency. Dimson Marsh Staunton (DMS) Global Returns Database. Past performance is no guarantee of future results.

However, the tradeoff for pursuing higher expected returns of equities is accepting the risk of substantial declines compared to the relative stability of bills. Table 2 shows that equity values in the four markets have dropped from 50–69% over a two- to six-year period, whereas bills have always been flat or better (if you consider minus 2 basis points a rounding error).

Table 2: Worst Performing Periods for Equities and Bills, Nominal Returns (1900–2010)

Equities Bills
Country Period Total Return Period Total Return
Australia 1970–1974 –50% 1950 0.75%
Canada 1929–1934 –64% 1945 0.37%
US 1929–1932 –69% 1938 –0.02%
UK 1973–1974 –61% 1935 0.50%

In local currency. Dimson Marsh Staunton (DMS) Global Returns Database. Past performance is no guarantee of future results.

The risk and return relationship from a preservation of capital perspective is apparent in these nominal returns, but the picture is a bit different after considering the impact of inflation. In terms of preserving purchasing power, now the “riskless” asset looks far from risk free.

Table 3 contains the biggest peak-to-trough declines, in real terms, for equities in these four countries over the same time period. It likely comes as no surprise that the magnitude of the real declines is substantial, with stock prices dropping anywhere from 55–71% after inflation. However, the duration of the declines is still relatively short, ranging from two to five years, and it took equity investors in these countries anywhere from three to eleven years to break even.

Table 3: Worst Performing Periods for Equities, Real Returns (1900–2010)

Peak to Trough Decline Subsequent Recovery
Country Period Total Return Years Years
Australia 1970–1974 –66% 5 11
Canada 1929–1932 –55% 4 3
US 1929–1931 –60% 4 4
UK 1973–1974 –71% 2 9

In local currency. Dimson Marsh Staunton (DMS) Global Returns Database. Past performance is no guarantee of future results.

In contrast, the data in Table 4 for bills, or the “riskless” asset, in these four countries is revealing. The biggest peak-to-trough declines after inflation now remarkably range from 44–61%, a similar order of magnitude to equities. Furthermore, the duration of the declines extends to a range of seven to forty-one years with investors in bills waiting an astounding seven to forty-eight years to recover!

Table 4: Worst Performing Periods for Bills, Real Returns (1900–2010)

Peak to Trough Decline Subsequent Recovery
Country Period Total Return Years Years
Australia 1937–1977 –61% 41 21
Canada 1934–1951 –44% 18 34
US 1933–1951 –47% 19 48
UK 1914–1920 –50% 7 7

In local currency. Dimson Marsh Staunton (DMS) Global Returns Database. Past performance is no guarantee of future results.More than ever, comparisons like these are needed when discussing the trade off of preserving capital versus preserving purchasing power. Investors feel the risk of equities in real time. Volatility is immediate and apparent as their portfolio value shows up in the mail every month or on their computer screen every day. Conversely, the risk of investing in bills and other low-volatility assets is less discernible and may take time to detect as it shows up when investors open their wallet at the grocery store or gas station many years later.

Investors may still want to revisit the tradeoffs they made and alter course if appropriate. However, changes to a long-term plan should reflect an informed decision rather than an emotional one. Fear and greed are powerful forces, but we should resist letting them dictate the tradeoffs we make in our lives or in our portfolios.

As the Most Interesting Man in the World would say, “stay invested, my friends!”

View the PowerPoint here!

The holiday season is a great time to see friends of old who are back in town and catch up with family you don’t get to see as often as you would like.  While getting caught up on each other’s lives, and amidst the small talk, most people these days bring up their dissatisfaction with the stock market.  I even hear, from time to time, that some people feel that they would have been better off if they had just stored their savings underneath their mattress rather than dealing with the ups and downs of the recent market.

Over the last decade investors have been faced with a tremendous amount of volatility in the financial markets.  The “technology bubble” was the first obstacle investors ran into and unfortunately had to bear with for over two years before the markets began to recover in late 2002.  That recovery lasted for around five years and culminated in late 2007 when the Dow Jones hit its all time high.  Unfortunately, this high was short lived and in 2008 investors saw one of the worst market corrections of their lifetimes!  So has this decade been a waste for investors? Are their depictions of the market over the last ten years correct? Hardly, as long as you were properly diversified.

The graph below shows the performance of various benchmark portfolios and how they have fared over the past ten years.  The green line tracks a well-diversified all stock portfolio.  What this graph shows is that if you wanted $100,000 today, you would have needed to invest $64,500 ten years ago to achieve that.  The blue line shows the returns of a moderate portfolio (50% stocks, 50% bonds), which is a more realistic holding for most investors.  With a moderate risk portfolio, an investor could meet his $100,000 demand today with an investment of only $59,200 ten years ago!  I know these are double digit annualized returns we are looking at, but to see this kind of growth in supposedly a “lost decade” seems pretty good to me.


Now, let’s take a look at how your investments would have done over a longer period of time.  The graph below shows the path of those same benchmark portfolios over a time period of 32 years; a time horizon more indicative of what many investors face during their years of saving.  In this case, a mere $4,500 was needed back in 1979 to reach our goal of $100,000 today.  That equates to over a 10% annualized return!


The “investment rollercoaster” of the past decade has played with many investors’ emotions and has been hard to handle.  However, for those who have stayed the course and were properly diversified, you are better off for it.

It is times like these that we need to step back and look at the bigger picture and realize that the recent volatility is nothing more than a few potholes on the road to your financial success!


Related Articles:

Many of our clients will be receiving a notice from Charles Schwab regarding a recent change in investment policy for two funds that we use in portfolios.  The Schwab Small Cap Index Fund (SWSSX) and the Schwab International Index Fund (SWISX) are affected.

Here is the communication from Schwab to advisors:

We want to make you aware that the indices for the Schwab Small-Cap Index Fund® (SWSSX) and the Schwab International Index Fund® (SWISX) will be converted from Schwab’s propriety indices to the Russell 2000® Index and the MSCI EAFE Index, respectively. Although these conversions will not happen until December 14, 2011 and December 20, 2011, we are required to mail a 60-day notification to your clients invested in either fund as of October 14, 2011. Additionally, as of November 1, 2011, the Schwab Small-Cap Index Fund’s expense ratio will decrease from 19 basis points (bps) to 17 bps. You may review a copy of the prospectus supplements here and here.

The Russell 2000 Index is an established index that measures the performance of the small-cap sector of the U.S. equity market. The Russell 2000 is a subset of the Russell 3000, representing approximately the 2000 smallest issues and approximately 10% of the total market capitalization of the Russell 3000.1 The MSCI EAFE Index is an industry-recognized index composed of MSCI country indices representing developed markets outside of North America—Europe, Australasia, and the Far East.

Converting to these indices from Schwab’s proprietary indices offers more transparent fund management for all segments of investors, plus better tracking and comparison data from third-party providers. Lowering the expense ratio of the Schwab Small-Cap Index Fund offers a better investment value for your clients.


Both funds have performed as expected against their respective benchmarks in the past.  We believe these are positive changes and both funds will  continue to be excellent representatives of their respective market segments.

Please give us a call if you have any questions or concerns about the changes.

1.  It is not really “different this time.”  Vanguard, in a recent study entitled “Stock Market Volatility:  Extraordinary or ‘Ordinary’?”, concludes that recent volatility appears extraordinary compared to the relative calm of the markets in 2010, but is in fact “ordinary” when compared to similar periods characterized by major global macro events – they cite the Asian currency crisis of 1997, the Russian debt default and bailout of Long-term Capital Management in 1998, the tech market bubble (2000-2002), and of course the financial crisis of 2008-2009.  Market volatility spiked in similar ways during each of these events as markets tried to re-price risk in the face of startling new information.  This time it is political paralysis and the European sovereign debt crisis.  So the reason is different, but the market reacts to crisis in similar fashion, over and over again.

2.  Diversification provides a remarkable amount of protection from volatility.  Information in the charts below is taken from the same Vanguard study mentioned above.


3.   The only way to fully participate in the up days is to be able to withstand the down days.  Volatility refers to moves in both directions.

4.   Remember that you are investing and not trading.  “Sitting out” the current volatility is an appealing notion, but timing the market is something better left to speculators and traders.  Trying to benefit from correct predictions of short-term moves in the market is not a long-term investment strategy.

5.   “The market has been volatile and just dropped dramatically – what do I do now?”  This is a bad question and bad questions do not lead to good investment decisions.  A better question would be, “Am I still taking an appropriate amount of risk considering my goals and time horizon?”

Sticking to your disciplined investment strategy is a better response than panic.  When stock prices tumble and bond prices soar, it provides an opportunity to rebalance your portfolio by taking some profits from the bonds and buying stocks at reduced prices.

Renewed fears of a double-dip recession, policy paralysis across the U.S. and Europe, and the looming threat of a financial crisis in the euro zone combined to create very volatile markets and a devastating quarter for equities.

Equity Markets
The third quarter of 2011 saw the value of small stocks and international stocks fall more than 20%, which is generally considered a bear market correction.  Large domestic stocks (S&P 500) did a bit better but fell nearly 14% in the quarter, dropping into negative territory for the year at -8.7%.

Fixed Income
Government bonds, on the other hand, had a stellar quarter, defying logic and many experts’ expectations, by rising in value after S&P downgraded the U.S. Government debt rating.  The broad bond market index, which is dominated by government securities, rose 4.7%.  The value of TIPS (Treasury Inflation Protected Securities) rose even more than the general bond market, as hope for economic recovery diminished, and action by the Federal Reserve drove expectations for real interest rates further into negative territory.  Based on the pricing of Treasury securities, and TIPS, the market now expects inflation to average less than 1.8% over the next ten years with ten-year government bonds providing a return above inflation of a meager 0.20% on average.  Government bonds of shorter maturities are expected to provide returns less than inflation, so investors’ purchasing power will diminish.

Return Expectations
We cannot predict future returns, but it can be instructive to examine assumptions built into current market pricing.  As mentioned above, the expected return on ten-year government bonds is barely above the expected rate of inflation, driven by dismal expectations for economic recovery, extremely accommodative monetary policy, and fear of another financial crisis coming out of the euro zone.  This is well below the long-term average, which is about 2% above inflation.

Stocks on the other hand appear priced to provide future returns more consistent with their long-term risk premium of 6-8% above inflation.  The S&P 500 index is at a price level first achieved in 1998, but since that time the Price/Earnings Ratio for the index (price paid per dollar of expected earnings) has fallen dramatically.  So today’s price reflects a lower, and perhaps more realistic, assumption of growth in dividends and earnings.

\A May 2011 lengthy article by Gahagan and Martin,  suggests a modest, permanent allocation to inflation-hedging -assets , such as TIPS, commodity futures, and REITs.

The interesting part of the article is a discussion of how different inflation-hedging assets perform across the inflation cycle.  For example, TIPS perform best in an inflationary period of less than 5% inflation while Commodity Futures perform best when inflation is more than 5%.

The bottom line of the analysis is that a mix of inflation-hedging assets provides a better risk-adjusted outcome across an inflation cycle.


I have generally recommended the use of Treasury Inflation Protected Securities (TIPs) as a hedge against inflation.  Are Commodity Futures an attractive inflation hedge similar to TIPs?

In a March 2011 article, author Geetesh Bhardwaj, addresses the use of various investments as a hedge against unexpected inflation.  (Let me know if you would like a copy of the paper).  The author differentiates between expected inflation, that is already incorporated into stock and bond prices, and unexpected inflation, that is not reflected in prices of most assets.  Both TIPs and Commodity Futures have a positive correlation to unexpected inflation and are unrelated to expected inflation.   Interestingly, REITs show little or no relationship to unexpected inflation.

One negative of commodity futures is that they can be volatile in price, unlike TIPs, whose value should be more stable.

As an investor wanting to hedge against inflation, a portfolio consisting of stocks, bonds, TIPS certainly makes sense.  Commodity Futures, while intriguing,  probably carry more risk than reward.

All too often lately, I have heard people talking about their individual stock holdings and the income they are providing them in retirement.  They love mentioning how they are receiving quarterly income from these companies regardless if the stock market is trending up or down.  The stockbrokers refer to this as the “get paid while you wait” way to invest in the market.  What they are referring to are dividend paying stocks, and with interest rates where they are today, they seem to have quite the appeal with many investors in retirement.  The theory is that dividend paying stocks are providing both a systematic payout method and stability in their portfolio.  Are they being misguided?

Thoughts to consider:

1.  Dividends are not a “free lunch”:  Stocks that pay dividends tend to be large companies who focus less on growth and instead pay out a portion of current income in the form of a dividend to its stockholders.  Non-dividend paying stocks reinvest back into the company in an effort to provide more opportunity for growth.  All else being equal, dividends are a trade-off, taking current income for slower growth in the company’s sales, earnings, and stock price.

2.  Remember to diversify:  Most dividend paying stocks are large capitalization companies.  These are great to have in a portfolio, but only if they are accompanied by other equity investments to provide some diversification.  We all remember what the market did in 2008, but what many forget is that it was the smaller US companies and international stocks which really helped drive the market back upwards in the following two years.

3.  How much risk are you taking in your portfolio?:  If you own a portfolio of dividend paying stocks then the answer is probably too much.  Just because a stock is providing you income does not make it any less volatile.  There is an inherent risk in owning stocks, which must be offset with a fixed income investment (bonds) for both the stability and further diversification it brings to your portfolio.

4.  Dividend paying stocks are not an alternative to bonds:  The “Dogs of the Dow” are a well-known index of dividend paying stocks.  How well did the strategy do in the recent market downturn?  Not so great.  As the S&P 500 Index plunged 37% in 2008, the Dogs of the Dow recorded a negative 38.8% return.  Bonds held up quite well during the same period.  As measured by the Vanguard Total Bond Market Index Fund, bonds were up 5% over the same period.

Coming up with a systematic way to provide yourself with income in retirement is very important, but you want to make sure you do so in a way that makes sense from a risk standpoint as well.  Dividends from a stock portfolio will fulfill the income need you may desire at retirement, but it may come at a cost!  We, as investors, can’t control the direction of the stock market, yet we can control our exposure.  This becomes even more important when you are nearing retirement and why proper diversification is crucial.  Investing is a long road and when you reach retirement you are only halfway there, so make sure to work together with your advisor to come up with a strategy that makes sense for you!

The second quarter of 2011 provided a rollercoaster ride in the stock market that will look uneventful in the history books.  April was a strong month for the market, but by mid-June the S&P 500 had fallen more than 7% from its April high, erasing the first quarter gains and falling back to where it was in December of 2010.  In the last two weeks it jumped nearly 5%, recouping the first quarter gains and providing a 6.0% return for the year to date, when dividends are included.

Other markets experienced a similar pattern, as the relevant news was global in nature.  Oil prices are up; inflation is threatening the developing economies in China, India, and Brazil; sovereign debt in Greece and some of the other EU countries is a problem; and the US economic recovery remains sluggish.  None of these issues are going away, and any hint of growing uncertainty sends markets downward, but any hint of improvement sends markets in a positive direction.

Bonds contributed significantly to portfolio returns in the second quarter, so more conservative portfolios benefited from holding larger bond allocations.  This return, once again, came from a decline in rates that drove bond prices higher.  The quarterly return of 2.3% for the broad bond market index (Barclays Capital US Government/Credit Index) was nearly equal to its annual yield (interest return).  It is worth keeping in mind that the opposite will happen at some point – when rates rise a similar amount, bond prices will fall, and the loss in value will wipe out an entire year’s worth of interest income.

“The Sky is Falling!”… Can we please ignore the noise?  “Economic worries drove a plunge in US stocks Friday morning, pointing to a sixth straight weekly decline that would be blue-chip stocks’ longest skid since 2002” – (Dow Jones June 10, 2011)

That headline seems almost silly in the context of a quarter that delivered flat returns on blue-chip stocks, but it apparently sells newspapers, and we read something similar every day the market went down last quarter.  Markets are volatile.  Enduring volatility is necessary if investors hope to enjoy the long-term rewards expected from stock market investment.  So…ignore the noise.

Lessons we should learn from Bernie Madoff
A new book came out recently entitled The Wizard of Lies, and the author, Diana Henriques, was interviewed by Morningstar.  She makes several interesting observations including the fact that Madoff did not try to exploit people’s greed, as do most Ponzi schemes, promising outsized returns.  He instead seduced them with consistent returns that exploited their fear of losing money, providing yet another reminder that risk and return cannot be separated in the real world.

She also compares Madoff’s operation to the relative safety of a mutual fund when she asks, “…what was he running?  He was running a secret, unregistered, unregulated, sort of quasi-hedge fund that produced no prospectuses,” whereas mutual funds have auditors, and third-party custodians that can verify the existence of fund assets.

This observation brings some old, but simple truths to mind:

1)  If it sounds too good to be true, it probably is;

2)  If no one can really explain why it works, you should not buy it; and

3)  It is good to trust, but verify.

Since the Madoff scandal broke, many investors have been worried about the safety of their investments.  The role of a third-party custodian is critical.  Rockbridge relies on third-party custodians, like Charles Schwab and TD Ameritrade, to provide monthly statements to our clients that verify every asset and transaction in their accounts.  The Madoff fraud relied on clients accepting verification from a Madoff owned and controlled custodian.  Independent verification makes the scheme impossible to replicate.  Investment risk cannot be avoided, but the use of an independent custodian is a simple safeguard that should give investors confidence that their assets are safe from fraud.

In my discussions with clients and prospects, one of the recurring themes is how, as their investment advisor, I can best provide advice contrary to their bias, intuition, or reaction to current business/economic  events.

An example is the current investor bias toward equities since the stock market has performed so well recently and bonds are feared because of the threat of increased inflation.

It is probably natural to hear that the asset allocation decision made just a short time ago is being questioned based on market psychology and the resulting impact on investment decision-making.

My role, as an investment advisor and fiduciary, is to challenge these tendencies and serve as a source of independent insight.

One client is a couple in their early 50s who have put two of three children through college.  They have a substantial joint income, no debt, but few investment assets.  We have established that they will require $2 million in investable assets to afford a comfortable retirement and they have less than one-third of that amount presently.  We have used an Aggressive Model for their investments with 70 percent invested in equities.   Investment panic has set in with the realization that full retirement in their early 60s is unlikely.  Their reaction is to move 100 percent into equities and is buoyed in that opinion by the recent stock market results.

As their investment advisor, I want to avoid simply confirming my clients’ bias in order to accommodate them.  They are overconfident in the stock market by extrapolating recent gains into overly rosy forecasts.  I find this behavior pattern is especially prevalent with people who have been successful in the business world.  It is similar to the thought that “I can beat the market” since I have made other correct decisions in my professional career.

Research has shown that individuals who report that they are “100% sure” of a particular fact are wrong 20% of the time.  I experience the phenomena with my barber, who never met a fact he could not mangle.  Overconfidence is the best known bias in making investment decisions.

Clients working with Rockbridge have two advantages.  First, we provide investment models that are not subject to current whims of the investment media.  Second, we provide independent advice and we see our role as providing an unbiased viewpoint.

Ron Lieber, of the New York Times, profiles Dimensional Fund Advisors in a recent article.  The funds offered by DFA are only available to investors through approved fee only investment advisors.  We recommend DFA funds in many of our client’s portfolios.  You can find the article here:

Your Money: Finding Success, Passionate Followers in Tow

You can also find more information at DFA’s own website.


Most investors track the direction of the financial market by checking where the S&P 500 or Dow Jones Industrial Average finishes on a daily basis in their local paper.

Some days they were pleased with what they saw and others not, but as a whole 2010 left most investors optimistic about the direction of their retirement portfolios.  However, most people forget to check how their portfolio returns did relative to these numbers, and if they had, might think of changing advisors as a New Year’s resolution as well.

In 2010, a mere 25% of active managers beat their respective benchmarks, with many active managers calling it the “toughest year on record.”  High correlations between stocks, low spreads on returns, and tough economic times were their reasons for underperformance.  Nowhere did they mention that either high costs or lack of ability could have played into their lacking returns.  Better yet, only two-thirds of active managers plan to beat the S&P 500 next year, which leaves me wondering what the other third plan on getting paid for while going to work each day?

Upton Sinclair once said that “it’s amazing how difficult it is for a man to understand something if he’s paid a small fortune not to understand it,” and this seems to be the case with active management as well.  The latest data from Standard and Poor’s shows that active managers continue to underperform and at a rate that is far worse than chance.

This underperformance by active managers is not unique to 2010, yet instead, it only gets worse when you look at it over the long run.  For the five years ending September 2010, only 4.1% of large-cap funds, 3.8% of mid-cap funds, and 4.6% of small-cap funds maintained a top-half ranking over five consecutive 12-month periods.  Statistically, 6.25% of funds would fit this criteria, assuming a 50% chance of falling into the top half each year.

This shows that not only have active managers underperformed their respective benchmarks in 2010, but that you have a better chance of picking which one will outperform its peers over a five-year period by blindly drawing a name from a hat!

So as you look back over 2010 and plan for another year, do yourself a favor and review your retirement portfolio.  It’s more important than you might think and can make a drastic impact on the way you spend your retirement years.  No individual wants to pay a premium for the likelihood of underperforming market returns, yet a majority of the populations does.

Take a moment this New Year and make sure you are not just following the crowd.  Though, for current Rockbridge clients, you can cross this one off and move to the next thing on your list of resolutions!

At the start of each new year, many of us make resolutions to improve our lifestyles.  It’s a natural time to take stock of the past year and look to make some beneficial changes for the future.  Tops on most lists are shedding pounds, getting fit, quitting bad habits, or learning something new.

In this spirit I’ve come up with my top 4 investment resolutions for 2011.

1) Ignore economic forecasts
We are constantly bombarded with contradictory economic predictions.  Markets are forward looking and incorporate all known information into a security’s price.  Generally good economic news, such as we see now, has already been incorporated into prices.  Therefore, only surprises matter to the markets.  Good surprises and bad surprises are the biggest drivers of security prices.  The surprising information is instantly reflected in the next day’s prices.  By definition, surprises cannot be forecasted, making it impossible to make bets that pay off ahead of time.

2) Keep bonds in your portfolio
I’ve recently fielded many calls from clients who are worried about predictions that bonds are poised for collapse.  Bonds have outperformed stocks over the past ten years, which is unusual but not unprecedented.  As interest rates rise, the value of your bond holdings will go down.  However, over the long run, bond returns are predominantly determined by the interest payments generated from holding the bond.  Additionally, the primary reason to hold bonds is to reduce risk in the overall portfolio that includes much riskier stocks.

3) Revisit your asset allocation
The new year is also a good time to review your investment plan.  Ask yourself a few important questions:  Have my long-term financial goals changed?  Is my time horizon different?  Has my ability, willingness or need to take risk changed?  If you answered yes to one of these questions, then it may be appropriate to revisit your current asset allocation.  Making changes to a portfolio based on short-term market disruption is almost always a bad idea.  However, reallocating your portfolio based on rational changes to your situation should be done at any time the need arises.

4) Control the controllable, ignore the rest
It’s easy to say, but hard to do.  The highest probability of investment success comes from 3 important factors:

•   Understand Risk:  Determining asset allocation based exclusively on your need, willingness and ability to take risk.

•   Control Costs:  The use of low-cost passively managed mutual funds that match the return of the various markets will result in more money in your pocket at the end of the day.

•   Diversify:  Incorporating various asset classes into an investment plan reduces overall portfolio risk for a given level of expected return.

The value of an investment advisor is to help you understand these factors for investment success and provide the discipline to carry out the plan, often in opposition to conventional wisdom.

With interest rates near historical lows, some investors may be anxious about a possible rate climb and its potential impact on their fixed income investments.  Read more

Experienced investors have heard this before. It is a headline used many times over the last 60 years.  Fear sells.  So the media sells high unemployment, potential deflation, and pending economic gloom.  Some in the investment community join in the chorus, but fiduciary advisors have a responsibility to muffle the noise and help investors take fear and emotion out of their decision process. Read more

First quarter stock market gains were erased during May and June leaving values well below the high water mark reached in the fall of 2007.  As the chart shows, large-cap stocks (S&P 500) have lost nearly 10% annually over the past three years.  Read more

Individuals are permitted to convert their Traditional IRAs (“TIRA”) to Roth IRAs if they meet current income limitations set by the IRS.  In 2010 the income limits are removed allowing anyone to convert.  I set out to examine when OR if a client should convert their traditional IRA to a Roth IRA.

Read more

After the recent and extreme turmoil we have experienced in the financial markets, it seems like in every newspaper or magazine you can find an article about where to invest in 2010.  So, where do you put your retirement nest egg and what do you believe?

Read more

The following table shows the returns from various markets over periods ending December 31, 2009:

Market Retturns Ending 12/31/09

Read more