Ready to get started?
If you’re ready to start planning for a brighter financial future, Rockbridge is ready with the advice you need to achieve your goals.
December 28, 2018
AllInvestingNews
Depending on the news you read, you may have come across headlines talking about bear markets and stock market corrections. The following is a guide to what they mean and how to put them in the context of history.
The conventional definition of a bear market is a price drop in a stock market index of 20% or greater from its high. The most quoted stock market index in America’s investment community is the S&P 500. When people reference our being in a “bear market,” they are likely talking about the S&P 500.
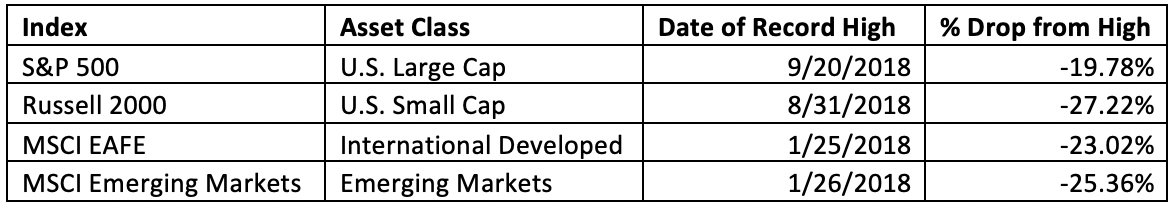
With Monday’s close at 2,351.10, the S&P 500 is 19.78% off its close of 2,930.75 set on September 20th of this year. That means we are a 0.28% drop away from entering a bear market. However, other markets are already in bear territory:
A 20% drop feels pretty bad and it is. Since 1950, we’ve witnessed 9 bear markets:
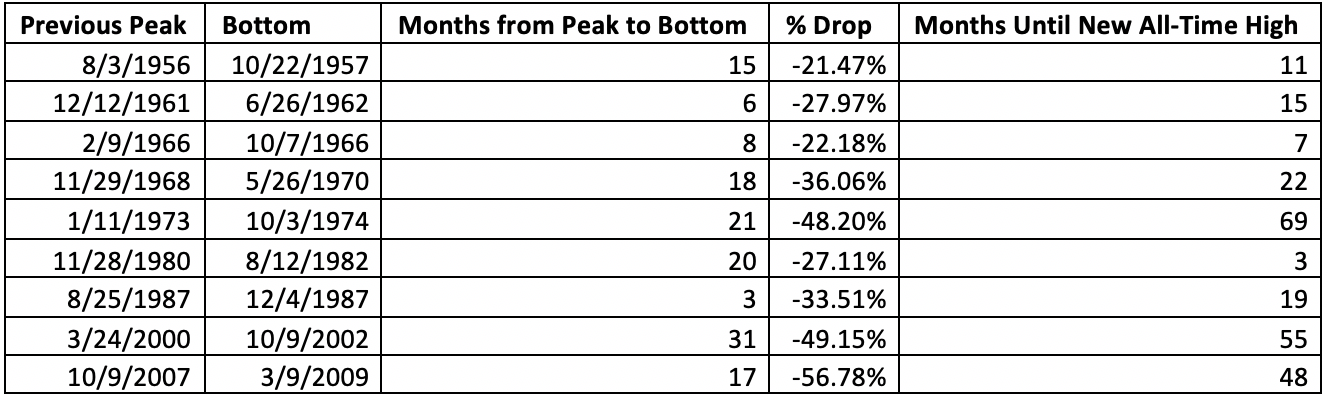
Nine bear markets over 68 years works out to one every 7.5 years. And it has been nearly 10 years since our last bear market bottom. Are we due? Maybe…
Another term in the news is market “corrections.” A market correction is generally defined as a drop of 10% or more. The following table shows all the stock market corrections since 1950 that never became bear markets:
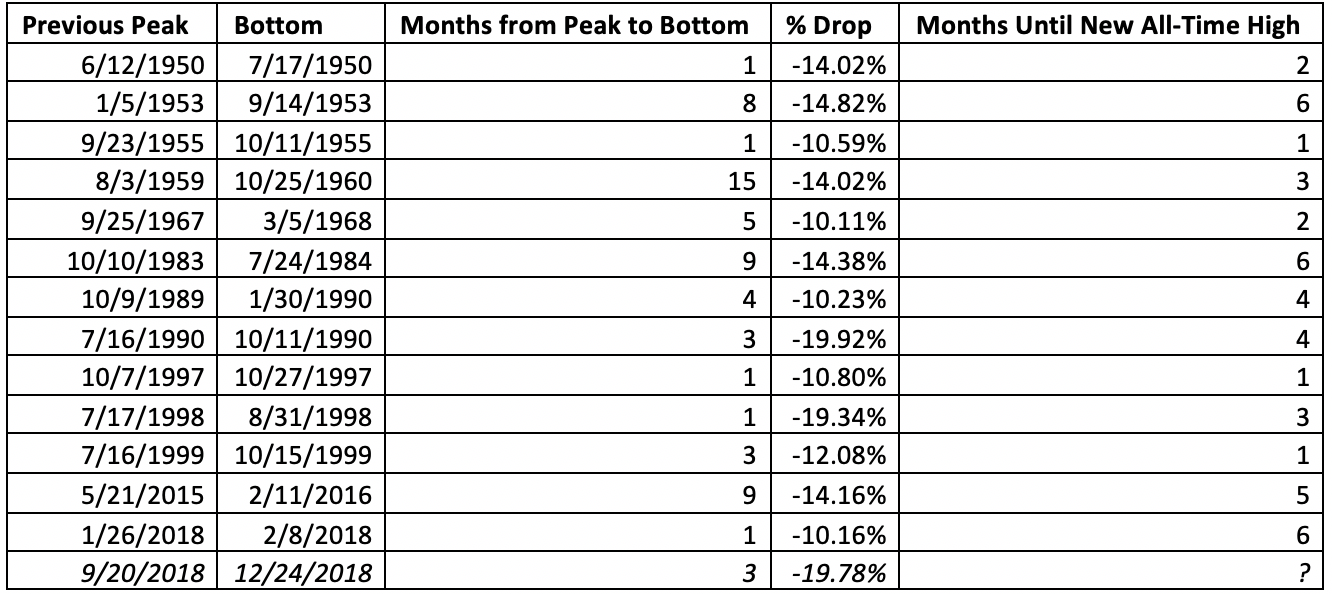
When looking at the current correction compared to all drops of 10% or greater since 1950, we see:
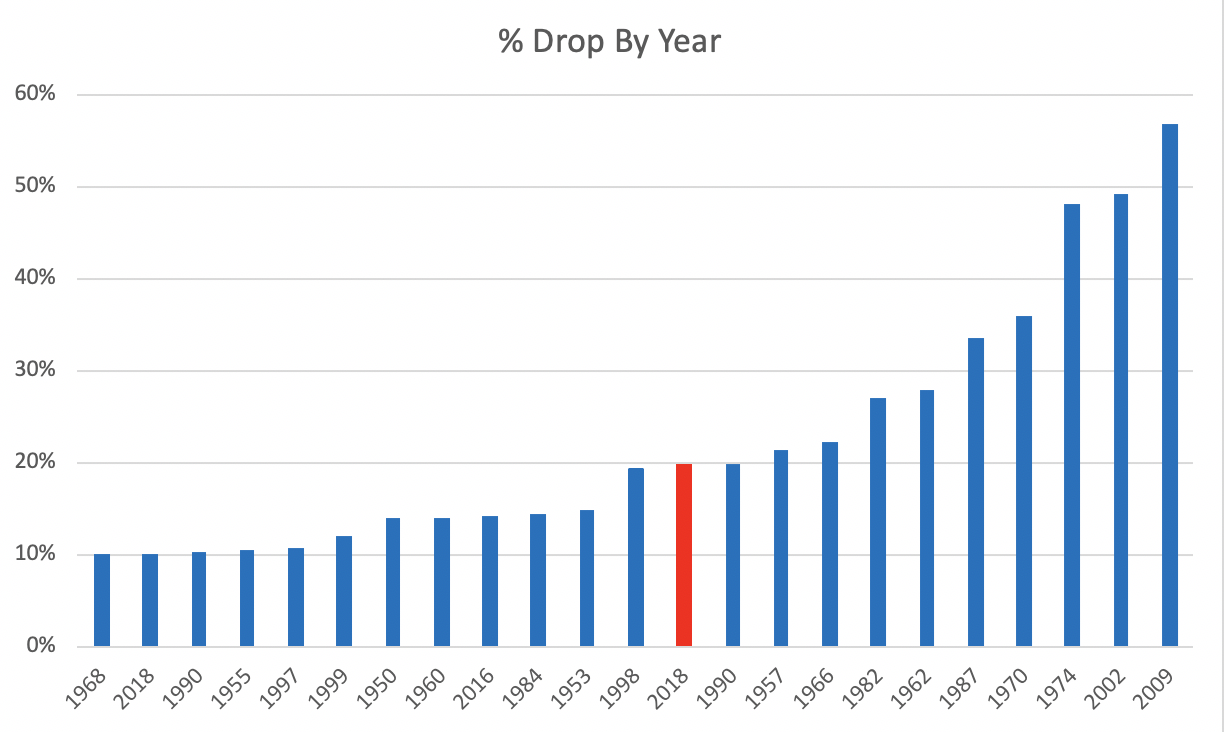
Our last two bear markets (2002, 2009) have been big ones, the two largest since the great depression. In the last 30 years, the only times the market has dropped more than 20% it’s kept falling, eventually being cut in half. Our recency bias tells us once we’re 20% off market highs we have much pain ahead, but that is not certain. It is imperative we remind ourselves that twice doesn’t make a trend and is woefully short of being statistically significant.
Maybe stocks will continue to drop, reaching a 40%+ bear market, or maybe 2018 will be a repeat of 1990. In 1990, we had a correction that barely eclipsed 10% very early in the year, followed by a larger drop at the end of the year that came within 0.1% of being a bear market. But if you had temporarily reduced your equity exposure it would have been to your detriment. For the rest of that decade, the S&P 500 appreciated at an annualized 20.9% over that 9-year span.
No one knows what the market will do next, but we do know it’s folly to try and time it. $10,000 invested in the S&P 500 in 1950 would have grown to $14,000,000 today for an annualized return of 11.1%. One way to think of it is that every day you are in the market you are earning nearly 0.03%. If only it were that easy…
If you’re ready to start planning for a brighter financial future, Rockbridge is ready with the advice you need to achieve your goals.
