Market Review

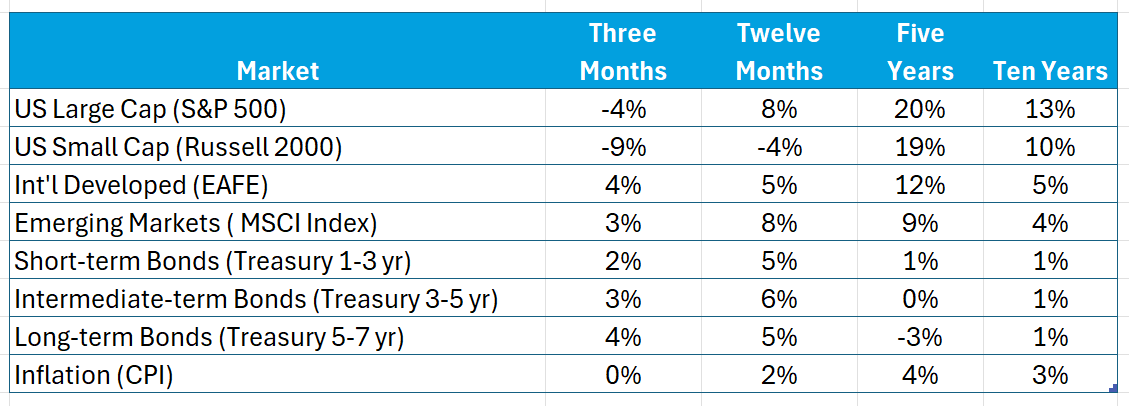
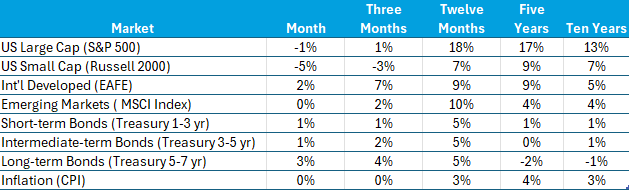
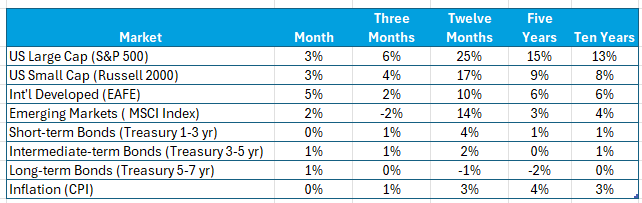
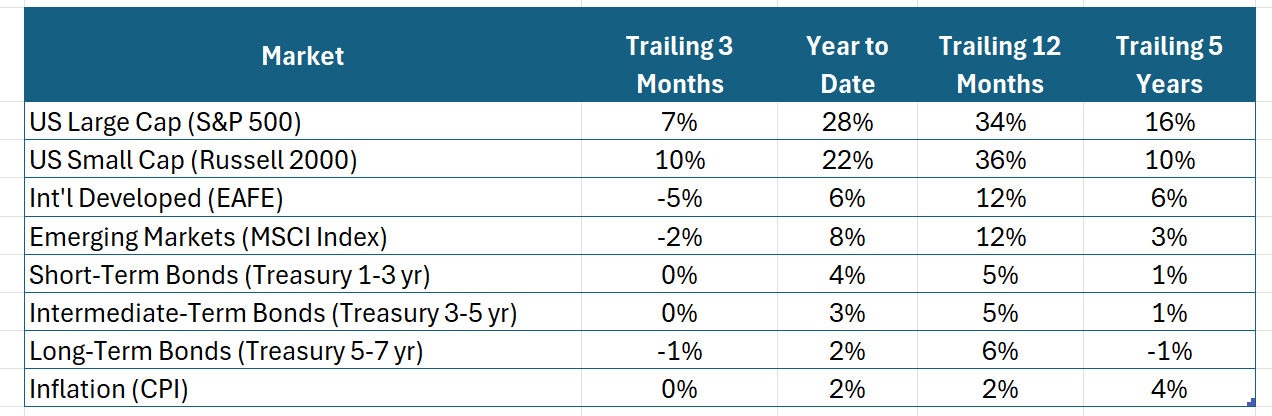
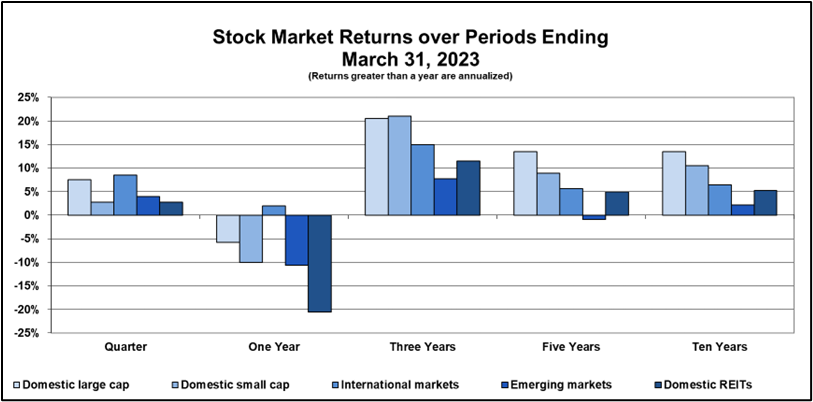
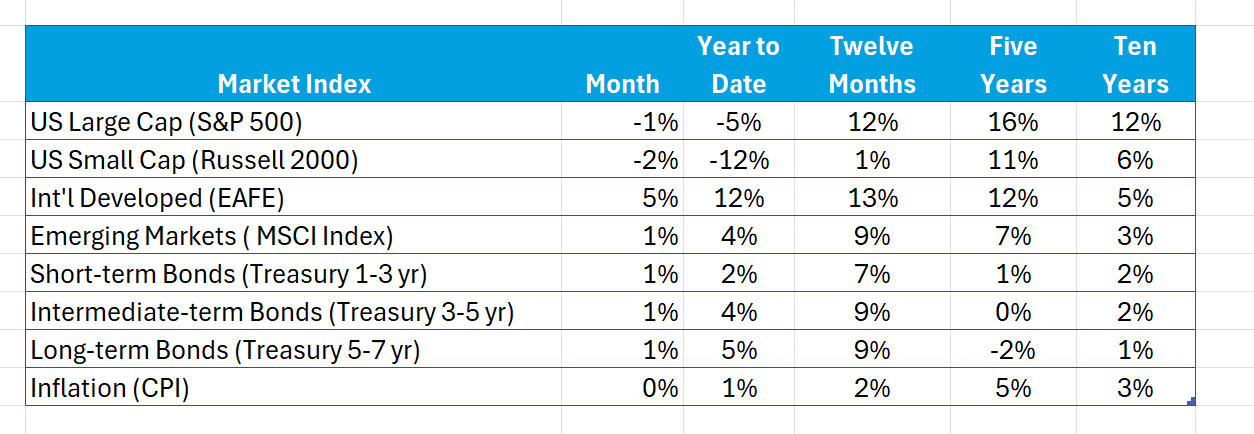
Here are recent returns from several market indices: Note especially the difference in returns among the various indices this past month and year to date. Also, note the generally positive results over longer periods.

Stocks

Domestic stock prices were volatile throughout April. After starting the month down significantly, stocks have bounced back recently to nearly flat for the S&P 500. These ups and downs primarily reflect the whims of tariff implementation.

Year-to-date domestic stock markets were down – Large Cap (S&P 500) off 5% and Small Cap (Russell 2000) down 12%. The S&P 500 results reflect that the Magnificent Stocks continue to give back much of their past extraordinary results. Year-to-date, an equally weighted portfolio of these stocks (Amazon, Apple, Google, Meta, Microsoft, Nvidia and Tesla) shed nearly 13% of their value. On the other hand, stocks traded in International Developed markets (EAFE) earned 12% from the beginning of the year, demonstrating the benefits of commitments to this market.

While domestic stock markets have been uncomfortable recently, we can take some consolation in the numbers over longer periods. While not sustainable, the level of five- and ten-year returns in the US Large Cap market stand out.

Bonds

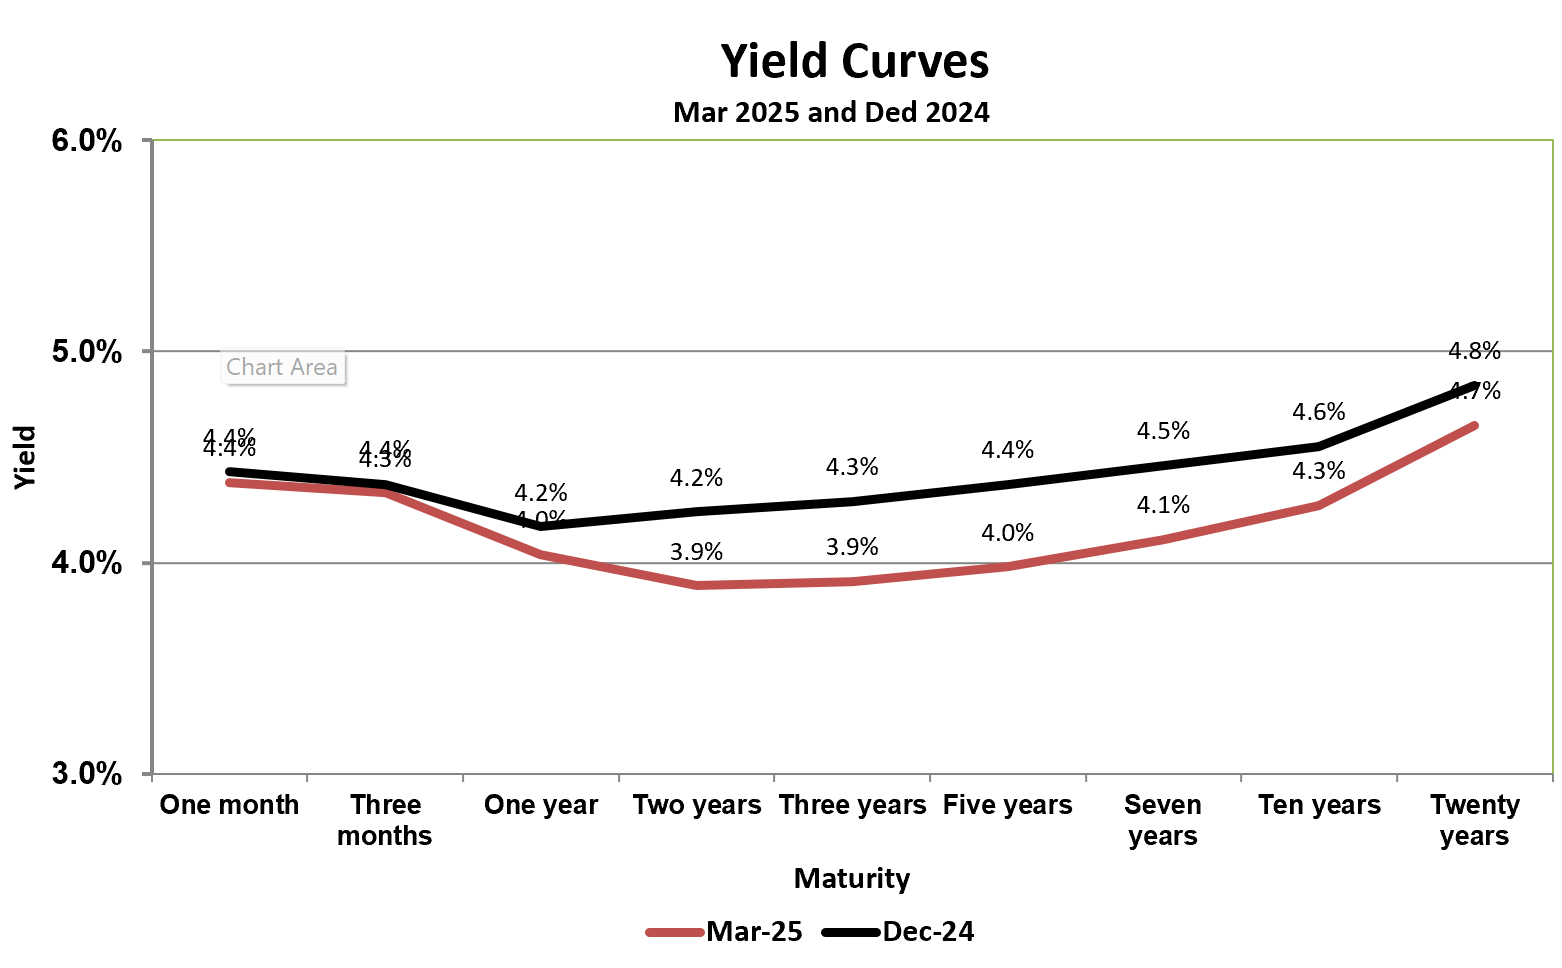
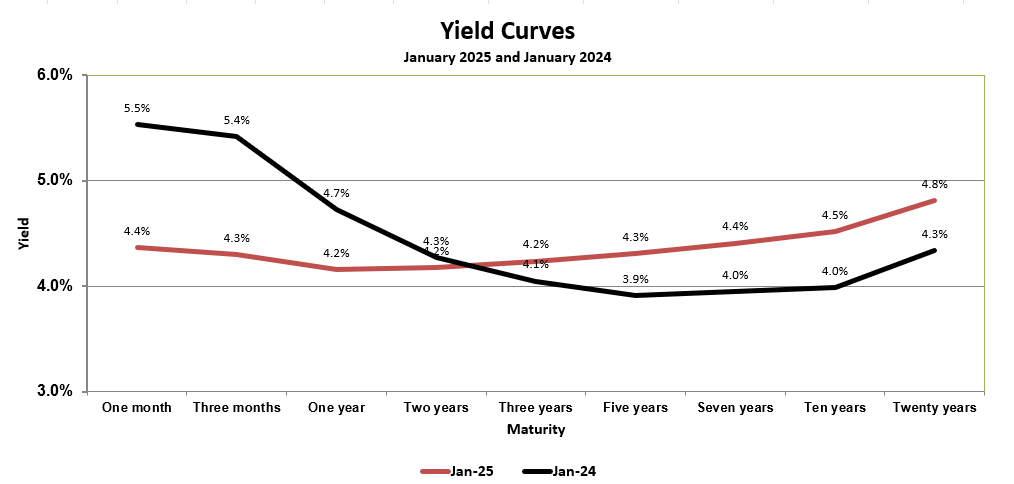
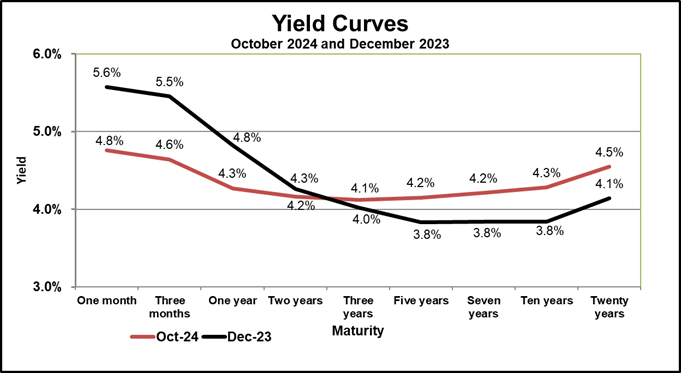
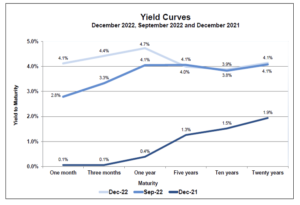
Bond markets are unsettled reflecting today’s uncertainties. Real interest rates shot up 0.4% at the beginning of the month. Although falling back recently, this behavior is worrisome as it’s indicative of increased risk in the market for US Treasury securities, making it more difficult, as well as costly, to finance growing deficits. The term premium (10-yr yield minus 2-yr yield) jumped to 0.5%.

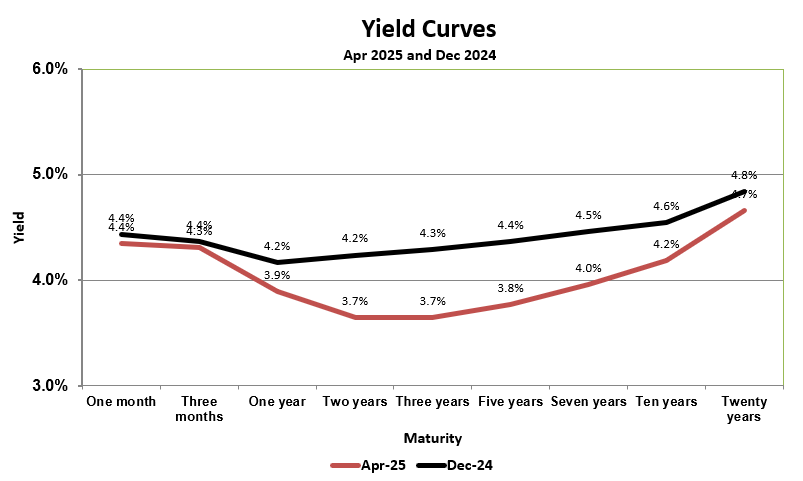
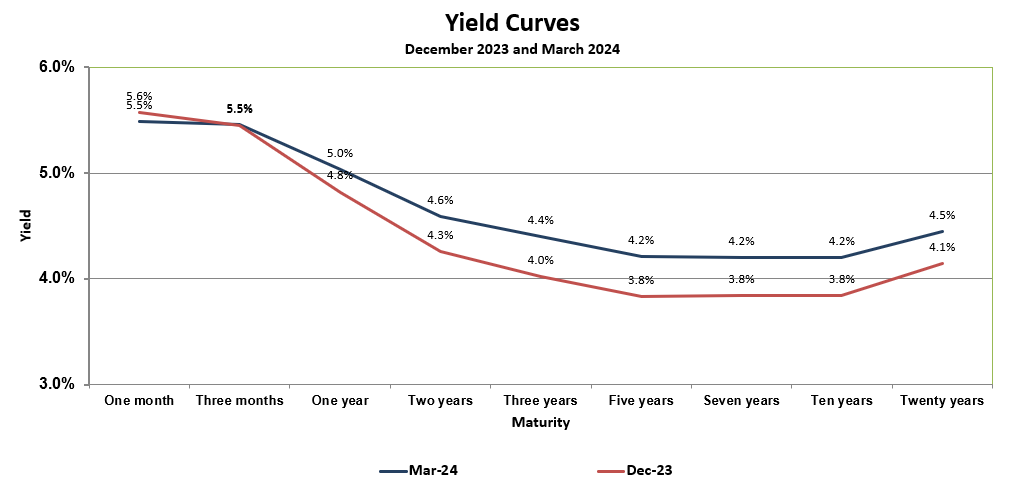
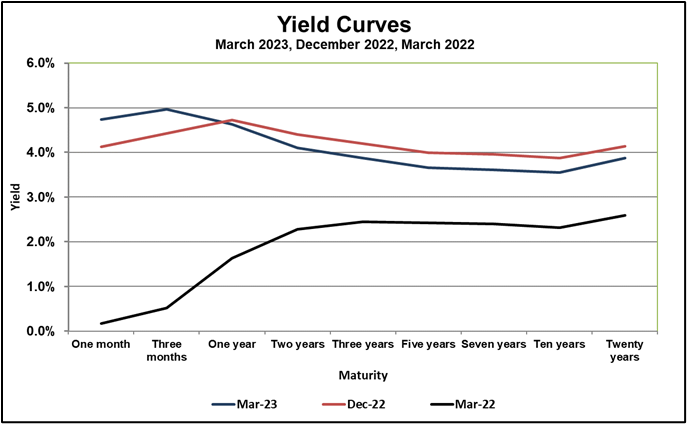
Note from the accompanying Yield Curves that while remaining generally constant in April, intermediate-term bond yields are down year-to-date, resulting in positive bond returns.

Risk and Uncertainties

Markets are forward looking. As the future becomes murky, stock prices are increasingly volatile. Among the negative clouds are the implementation and economic impact of tariffs; the threat of politicizing the Fed; the impact of budget negotiations on the deficit; and an economic slowdown (recession).

Risk and uncertainty are different concepts – risk can be measured, uncertainty cannot. Risk is the possibility that the future will be different from what’s expected. This chance can be measured with probabilities and statistics. Uncertainty, on the other hand, is a description of the state of the world. Not only is this situation constantly changing, but it can’t be measured precisely.

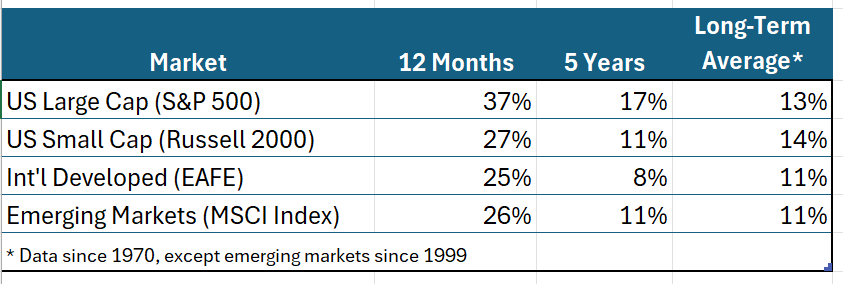
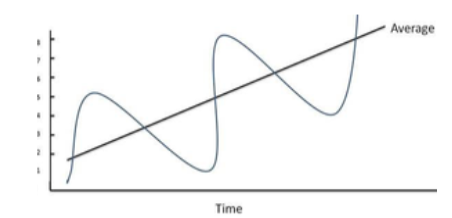
Markets have weathered uncertain periods before. Risk profiles (average returns and standard deviation) of stock returns reflect how markets deal with uncertainty. While the events that trigger volatility are forever changing, these profiles have remained generally constant and are a reasonable description of the future.

If we look around us there are always things about which we are uncertain. Today it is tariffs. We are uncertain not only about the economic effects of tariffs, but also how future tariff regimes will unfold. Of course, it’s this uncertainty of where tariffs are going that drives market volatility, which will continue until some of the uncertainty is resolved; however, others will take their place.

Market Review

Here are the recent returns from various market indices:

Stocks

Note that this quarter it’s international markets that are up, it’s domestic markets, especially the larger tech stocks, that are down – not what we’ve been used to. The S&P 500 was down 4% and the Russell 2000 down 9%, International developed markets (EAFE) and Emerging Markets (MSCI Index), on the other hand, were up 4% and 3%, respectively, demonstrating the benefits of diversification.

An equally weighted portfolio of the so-called “Magnificent Seven” (Apple, Amazon, Google, Meta, Microsoft, Meta and Tesla) portfolio lost 16% of its value this quarter. Tesla lost 35%. These results explain much of the falloff in the S&P 500.

The Russell 2000 Small Cap index, because it includes a diverse group of companies across the domestic economy, is often considered a leading indicator of economic activity. The sell-off in this market is consistent with expectations of a recession in the immediate future.

Value stocks held up better this quarter. In domestic markets, the S&P 500 Value Index is about flat, the Russell 2000 Value Index is down, less than the market-wide index. The same story in international markets – the EAFE Value Index is up significantly more than the comparable growth index. However, take care not to extrapolate one quarter’s results into the future, but acknowledge it helps to solidify the importance of remaining committed to global stock markets.

References to the “stock market” in the popular press oftentimes means the narrowly defined Dow Jones Industrial Average or the S&P 500. We see this quarterly, especially that the stock market includes several markets that can behave differently from one another.

Bonds

Allocations to bond markets were a net contribution this quarter reflecting a downward shift in the Yield Curves as shown in the accompanying chart. Our index of US Treasury securities was up 1.4% at the short end (1-3-year) and 3.6% at the long end (7-10 year).

Nominal yields on Treasury securities, which do not include the risk of default, are driven by interest rates and expected inflation.  Recent declines are attributed to declining interest rates as the spread between real and inflation-adjusted yields have remained constant. Consequently, these changes in bond yields are consistent with a slowdown ahead.

Uncertainties

Markets are dealing with a myriad of uncertainties, primarily from on and off again tariffs. Further contributing to uncertainties are recession concerns, the Fed’s monetary policy and interest rates. Markets don’t like uncertainty.

The so-called VIX index measures stock market volatility.  It is calculated daily by looking at the implied standard deviation in option prices of 30 large cap stocks. This VIX index has doubled since the beginning of the year.  These numbers confirm today’s volatile stock market.

The ups and downs of tariff policy are clearly what’s driving today’s market volatility. Tariffs impact not only the global economy, but also the political landscape. A given tariff regime will be reflected in stock prices. It’s unanticipated changes in tariff regimes that translate into volatility. Consequently, expect continued market instability.

Market Review

Here are the recent returns from various market indices:

Rockbridge Institutional - February 2025 Market Review

Stocks

Stocks are volatile this month. Returns of the six AI companies that have driven the S&P 500 recently are not as dominant. Note in the above chart that domestic stocks are down while international stocks have picked up the slack. The returns in developed international markets (EAFE) and emerging markets (MSCI Index) stand out. While certainly not a trend, it is heartening to those who have argued for a long time that an allocation to non-domestic markets is important to a well-diversified portfolio. Diversification paid off this month and quarter.

Not only volatile, but stock returns have been more dispersed recently. Returns of the six AI firms reacted differently to the introduction of the competition from DeepSeek. While Nvidia, Microsoft, and Apple were off, Amazon, Google, and Meta were up over the same period, providing evidence of some independence among these market drivers. Recent measures of dispersion are lower for stock indices than for individual stocks in the index, which is indicative of less correlation among returns in today’s stock markets.

Bonds

With declining yields in recent periods, bond returns are up. Bond returns are evidence of a mostly stable interest rate environment. The pattern of yields across several maturities (Yield Curve) remained at its more normal upward-sloping shape.

Inflation and the Yield on 10-Year Treasuries

The yield on 10-year Treasuries reflects inflationary expectations and prospects for an economic downturn. This yield came down nearly 0.25% this month. Stripping away implied inflationary expectations, this drop in yield is consistent with an expected falloff in economic activity, as the inflation- adjusted yield was down 0.3%.

While the spread between the inflation-adjusted yield and nominal 10-yr. yields ticked up a bit, it is still a rather benign 2.4%, and inflation is becoming worrisome once again. No doubt this concern reflects cost-conscious consumers changing their food buying habits, especially fewer eggs, in response to years of rising prices and an uncertain inflationary future. Tariffs, tax cuts, and deficits add to the worry of future inflation.

The Cost of Market Timing

Serious long-term investors know it is best to avoid making changes to established strategic allocations in response to market ups and downs – yet, maintaining this discipline is hard. There will be many periods, some quite long, when one particular asset class does better, sometimes dramatically, while others do not keep up. The urge to tilt towards outperforming markets and away from those that have underperformed (market timing) is difficult to resist.

However, giving in to this urge can be costly in the long run. A simple decision model may be helpful to understand this cost: I compare a timing strategy in the S&P 500 Index consisting of forgoing the subsequent quarter’s return if the current return is below the trailing five-year average. At the end of twenty years, this strategy results in a portfolio of about one-half the size of that from doing nothing and letting the wonder of compounding do its work. While admittedly a simple decision model, adding more realistic complexity doesn’t change the conclusion – market timing rarely pays in the long run.

Market Review

Here are the recent returns from various market indices:

Rockbridge Institutional - January 2025 Market Review

Stocks

The above numbers show a consistently positive environment for domestic stocks, especially the large cap tech stocks, which are a significant percentage (30%) of the S&P 500 index.  While remaining in negative territory over the trailing three months, international stocks have come back a bit in January.  The trailing twelve months numbers, led again by the S&P 500, are strong across the board.

No doubt expectations for a positive investment landscape from the incoming Administration as well as prospects for AI explain much of these recent results.  Yet, it seems clear that we are in for political disruption and uncertainty resulting in continued volatility.

The S&P 500 numbers include the impact of the recent sell-off in some domestic tech companies, primarily Nvidia, due to the introduction of competition from the Chinese Company DeepSeek.  While the falloff in Navida reflects the threat to its dominance, the impact was not negative across the board – Amazon, Google, and Meta were up in January.  The positive impact on the stocks of these companies is consistent with lower costs from increased competition leading to more applications for AI going forward.

Bonds

The outlook for interest rates continues to play an important role in capital markets. The accompanying Yield Curves show that over the past twelve months yields for short-term bonds have dropped but increased at the longer end.  The 4.68% yield on the bellwether 10-yr Treasury is up nearly 1.0% over the past year.  These changes have brought today’s pattern of yields to its more typical upward sloping shape.

Rockbridge Institutional - January 2025 Market Review

Inflation

While in check for now, the Administration’s policies on immigration, tariffs, and taxes raise concerns for renewed inflation.  Yet the difference between nominal and inflation adjusted yields, a signal of market expectations for inflation, has remained relatively constant at 2.3%.  We’ll see.

Bond Yields and Bond Returns

Yield is what’s earned by holding an individual bond to maturity – return is the difference in the bond’s price plus any interest received over a specific period – two different measures. If an individual bond is held to maturity, then return equals yield.  But yields and prices change over time in response to market conditions.  Therefore, a bond’s return is volatile on its journey to maturity.

If maintaining a commitment to a bond portfolio is part of a long-term investment strategy, then individual bond proceeds are reinvested in a new bond.  Consequently, bond portfolios don’t mature.  The weighted maturity of the bonds in a portfolio, termed duration, is an important characteristic.  It measures the portfolio’s response to changing yields (risk).  Bond portfolios are generally managed to maintain an established duration.

Note from the above recent data that bond returns have been close to zero recently.  However, because bond prices are not only less volatile but also behave independently from stocks, they are an important risk management tool.  Market history tells us that there will be future periods when bonds will do better than stocks.

Market Review

Here are the recent returns from various market indices:

Market Quarter Year 5 years 10 Years
US Large Cap (S&P 500) 2% 25% 14% 13%
US Small Cap (Russell 2000) 0% 12% 7% 8%
Int’l Developed (EAFE) -8% 4% 5% 5%
Emerging Markets (MSCI Index) -8% 8% 1% 4%
Short-term Bonds (Treasury 1-3 yr) 0% 4% 1% 1%
Intermediate-term Bonds (Treasury 3-5 yr) -2% 2% 0% 1%
Long-term Bonds (Treasury 5-7yr) -5% -1% -1% 1%
Inflation (CPI) 1% 2% 4% 3%

Stocks

We have witnessed more volatility in domestic stocks lately. Stocks dropped in response to the Fed’s rate cut but have come back some since. Except for the S&P 500, it was a flat-to-down quarter, especially in international and emerging markets.

Recent periods notwithstanding, 2024 was a good year for stocks (international developed markets the exception). The S&P 500 continues to be driven by just six companies: Amazon, Apple, Google, Meta (Facebook), Microsoft, and of course Nivida, that are expected to benefit from the continued development of AI. In 2024, an equally weighted portfolio of these six companies was up 60%; Nvidia was up 177%.  The results in domestic small cap markets and emerging markets are above long-term averages. A portfolio diversified among both domestic and non-domestic markets earned 10% in 2024.

Developed international markets did not keep pace. This relative performance does not reflect earnings shortfalls but primarily how market values these earnings.

Look at how the S&P 500 stands out in all periods; this result is again driven by just the few tech companies that are expected to participate in the development of AI.

Elections triggered expectations for an improved investment landscape, which pushed stocks upward. Cryptocurrencies especially gained, but don’t pay any attention.

Bonds

The accompanying picture showing bond yields for several maturities (Yield Curve) tells the 2024 bond story – short-term bond yields falling but rising at the longer end. Consequently, returns on short-term bonds exceeded returns at the longer end.

In recent periods bonds have not contributed much to the results of a well-diversified portfolio. This will not always be the case.

The changes in bond yields over the past year have brought the Yield Curve to a more typical pattern signaling little change in rates.

Inflation

Inflation in 2024 matched the goal of 2%, which was achieved without triggering a recession and contributed to a positive stock market environment. However, inflation at 4% for the past five years meant general price levels increased 20% over the period, which is still painful.

The difference between the 5- and 10-year nominal and inflation-adjusted yields is 2.3%, which is the market’s projection of inflation over those periods. This number is little changed from the beginning of the year.

Uncertainties Ahead

Stock prices and returns are based on continuous trading by informed buyers and sellers, both of whom make decisions on their best assessment of the future. As new information comes in, prices change – either up or down. Some of today’s uncertainties include:

  • A correction in domestic large cap markets. Recent S&P 500 returns are unprecedented. The enthusiasm for the future of AI in just a few tech companies has produced a nice run. A reasonable concern is that AI is oversold.
  • Renewed inflation. While inflation currently seems in check, an environment of tariffs, deficits and reduced immigration could bring inflationary pressures.
  • Remaining diversified to international markets has been like “waiting for Godot.” Yet, based on the evidence that markets eventually revert to long-term averages, we continue to wait for our patience to be rewarded. We’ll see.
  • Political disruptions. Voters expect disruptions from the Trump Administration. The extent and economic impact of these disruptions is uncertain.

Adding to the uncertainty of these “known unknowns,” there are “unknown unknowns” as well. Predicting this uncertain future is rarely rewarded – the best approach is enduring the uncertain future by remaining diversified.

Market Review

Here are the recent returns for indices representing various stock and bond markets:

  • These numbers present a generally positive period for stocks. Domestic stocks stand out. The results for the S&P 500 are driven by the extraordinary performance of the few (six) largest US Tech companies expected to benefit from the development of AI. Additionally, stock markets have been buoyed by continued economic growth with declining inflation.
  • These numbers present a generally positive period for stocks. Domestic stocks stand out. The results for the S&P 500 are driven by the extraordinary performance of the few (six) largest US Tech companies expected to benefit from the development of AI. Additionally, stock markets have been buoyed by continued economic growth with declining inflation.
  • Nvidia, which many consider to be a bellwether for the future of AI, posted better than expected quarterly results. While the Market apparently expected more, they reflect a continued positive outlook for AI.
  •  International and emerging markets continue to disappoint. Valuation metrics for international stocks are well below those of domestic companies, which have been the case for some time. However, extrapolating continued shortfalls in the performance of these stocks far into the future should be done with care. Maintaining commitments to both domestic and international markets ensure the long-term benefits of diversification.
  •  Bond returns are down, reflecting the recent increases in yields of about 0.5%. The yield on 10-year Treasuries is now 4.3%, up from 3.8% at the beginning of the quarter. Bond market signals are consistent with little change in interest rates.
  • The spread in inflation-adjusted yields is up a bit to about 2.3%, yet consistent with a reasonable inflation picture, which could change with the implementation of some of the Trump Administration policies.

Election

Domestic stock markets approved the election results – S&P 500 up 5% and Russell 2000 up 9%, respectively the first week of November. This response, no doubt, reflects, among other things, the anticipation of tax cuts and a relaxed regulatory environment. However, the impact of increased tariffs and reduced immigration is apt to bring another bout of inflation. In any event, with the significant changes from the election results, it is reasonable to expect disruptions and continued market volatility ahead.

A Perspective on Cryptocurrency

Anticipating less regulation, the value of Bitcoins skyrocketed – up from about $70,000 to nearly $100,000 this month. Take care before jumping on this bandwagon; these positive results, notwithstanding, Cryptocurrency has little to do with allocating capital to its best use – it is still primarily a means to gamble. Bitcoins are valued in a “Bigger Fool” market – today’s price reflects the expectation that a bigger fool will purchase it at a future higher price. Whether a particular trade works out depends on fortuitous timing.

A future use for Cryptocurrency beyond a mechanism for gambling is not apparent. Some have suggested that Cryptocurrency value comes from its future acceptance as a currency. However, it is not yet exchanged for a wide variety of goods and services. Bitcoin prices fluctuate widely, making it less than useful as a unit of account or a measure of value. Additionally, mining Cryptocurrencies is costly, requiring significant levels of energy. It is not clear what problem Cryptocurrencies solve.

Yet, Bitcoins have now been around for a while and some lucky people appear to have become wealthy.  We can expect to hear more about Cryptocurrency. Be wary.

Market Review

Here’s a snapshot of recent returns for indices representing various stock and bond markets:

Market Trailing 3 Months Year to  Date Trailing  12 Months Trailing 5   Years
US Large Cap (S&P 500) 7% 21% 37% 15%
US Small Cap (Russell 2000) 4% 10% 33% 8%
Int’l Developed (EAFE) 2% 7% 22% 6%
Emerging Markets (MSCI Index) 6% 12% 25% 4%
Short-term Bonds (Treasury 1-3 yr) 0% 4% 6% 1%
Intermediate-Term Bonds (Treasury 3-5 yr) -1% 2% 6% 0%
Long-term Bonds (Treasury 5-7 yr) -3% 1% 8% -1%
Inflation (CPI) 0% 2% 2% 4%
  • These numbers suggest a good period for stocks. The year-to-date and trailing month periods have been especially pleasant. I think it’s the expected growth of AI as well as falling interest rates and a positive economy that help to explain these results.
  • Returns of the S&P 500 stand out. This index is heavily weighted in the stocks of just six companies (Amazon, Apple, Google, Meta [Facebook], Microsoft, and Nvidia) that are expected to participate in the growth of AI. Nvidia is up an extraordinary 170% this year. Meta is up 60%.
  • China makes up more than 25% of the Emerging Markets Index and reflects the recent ups and downs of that economy.
  • Bond market returns are driven by changing yields. Observed returns depend on maturity – longer maturities do better when yields fall; shorter maturities do better when yields rise.
  • Inflation is generally in check. The Consumer Price Index (CPI) is running close to the Fed’s 2% goal. However, what keeps inflation in the news is that a 4% inflation rate over five years means price levels have jumped more than 20%.
  • We can get a hint of what’s expected for future inflation by looking at the difference between observed and inflation-adjusted yields, which is a comfortable 2.3% for 5 yr.-bonds.

Pattern of Bond Yields

The change in the pattern of yields (Yield Curve) for several maturities are shown here – notice the twists – yields at the shorter term falling and longer-term yields rising. Since returns and prices behave inversely with changing yields, these twists explain recent bond markets. Also, the Yield Curve is generally upward sloping for bonds maturing beyond two years, which is more typical.

Yields jumped over 0.5% this month, signaling increases in the cost of capital (interest rates) as inflation expectations did not move. A rising cost of capital can have a negative impact on economic growth.

Rockbridge Institutional - October 2024 Market Review

A Perspective on Recent Stock Market Results

The robust stock returns of recent periods, especially in the tech-ladened S&P 500, have led some to suggest a “correction” is ahead. There is considerable uncertainty in today’s investment landscape due to our closely contested election, wars in Ukraine and the Middle East, the impact of AI, and rising interest rates. Yet today’s prices are established in a well-functioning market and reflect what is known – the future is, of course, unknown.

In a well-functioning market prices incorporate available information. Stock prices and returns are based on continuous trading by informed buyers and sellers, both of whom make decisions on their best assessment of the future. New information drives price changes as it becomes apparent, assessments of the impact are evaluated and prices change. However, the impact could be either positive or negative.

While we may experience a correction, it will be due to unpredictable surprises. Consequently, to deal with uncertainty it’s best to maintain established commitments to a well-diversified portfolio and periodically rebalance in response to future volatility.

Stocks

The September quarter was good for stocks. While there was a brief bout of indiscriminate selling at the beginning of the month, this was quickly turned around by the enthusiasm for the ½% drop in the Federal Funds rate. This quarter’s returns ranged from 5% for domestic large cap stocks (S&P 500) to 9% for other stock market indices. China had been a drag on emerging market results until the recent bump in returns from its stimulus programs.

The year-to-date numbers are up nicely, as well. Positive returns of 11% across the board, except for the Tech-dominated domestic large cap market (S&P 500), which is up 22% since the first of the year.

Over the past 12 months the Consumer Price Index (CPI) was up just 2.1%, close to the Fed’s inflation goal. While not ready to declare victory, the Fed is seemingly pivoting to now worrying about a recession and unemployment. Even with it currently in check, the pain of inflation is reflected in the 20% jump in general price levels since 2020.

Bonds

With yields falling, the return for the US Treasury indices went from 3% at the short end (1-3 year maturity) to 6% at the longer end (5-7 year maturity). Over the past twelve months these returns went from 7% to over 11% at the longer term (7-10 year). The pattern of yields for several maturities is beginning to reflect a more typical shape, sloping upward beyond three-year maturities, which are consistent with a more stable interest rate environment.

Recent Results in Context

Recent market returns have been well-above past averages (often past averages are used as a proxy for expectations). The following table shows returns over the most recent 12-month and 5-year periods versus long-term averages:

The recent 12-month returns are well above 5-year results and long-term averages. Consequently, it could be argued these returns are not sustainable and future returns must fall back to averages. By the same token, the 5-year period results are not dramatically out of whack and the recent 12 month returns become a necessary catch-up. We’ll see.

Volatility and Risk

What explains changes in stock values is continuous receipt of information as well as simply noise, which means future returns are random and unpredictable – volatile. However, for markets to work traders must expect a payoff from accepting volatility. Risk is the chance that what’s expected will not be realized – it can be measured by the difference between actual results and expectations.

Of course, we can’t measure market expectations. But for markets to work, anticipated payoffs must be realized eventually, and past averages become a proxy for expectations. Risk is then measured by the difference between observations and averages.

While the recent 12 months have been good for both stocks and bonds, markets look ahead. There is considerable uncertainty today with not only the future of AI, but also from our domestic political environment, strike-induced supply chain disruptions, and crises in the Middle East. Market prices reflect this uncertainty. We can expect both positive and negative surprises and, consequently, volatility going forward.

Market Review

Stocks

In August, a globally diversified portfolio fell 5.6% in the first five days only to snap back to earning nearly 2% by month end. Domestic small cap stocks (Russell 2000) were down 1% in the month, giving back much of their July results. Other stock indices, however, ended up between 2% and 3%. These results confirm that “do nothing” was the best response to the unexplained falloff at the beginning of the month.

So far this year, stocks have rewarded investors, earning returns that range from 10% for the MSCI emerging markets index to 19% for the Tech-ladened S&P 500. These numbers clearly demonstrate “exuberance.”  However, with falling interest rates, reduced inflation, a “soft landing,” plus the prospects for AI, a case can be made that they may not be “irrational.” The trailing 12 months have been equally good for stocks with returns ranging from 15%-30%.

While the recent past has been good for stocks, there is plenty of uncertainty about what lies ahead.  Consequently, we should be cautious about extrapolating recent results very far into the future.

Bonds

In August, yields fell 0.4%, and between 0.5% and 0.7% since June 30, for bonds maturing beyond a year, reflecting an anticipated cut in the Federal Funds rate. It is widely expected that the Fed will reduce this rate at their September meeting. Bond prices move inversely with yields; consequently, bonds earned between 2% and 4% quarter-to-date depending on maturity (longer term up more).

Recent periods have been good for investors (a 60/40 stock/bond portfolio earned 16% over the trailing 12 months); yet, it continues to be appropriate to avoid making predictions while maintaining established commitments to well-diversified portfolios sufficient to span capital markets.

Dealing with Stock Price Volatility

This past month’s results, as well as the first days of September, confirm once again that stock markets are volatile. What explains changes in stock values is continuous receipt of information as well as simple noise, which means future returns are random and unpredictable.

Theoretically, the observed stock price is when traders decide to sell to traders who decide to buy. It’s information about an uncertain future that drives these decisions and, consequently, stock prices. As new information becomes available prices change. Since there is no pattern in the receipt of new information there is no predictable pattern in stock prices. Contributing further to this unpredictability are changes that can’t be explained by new information – “noise.” The falloff in early August fits the noise category.

However, if we are willing to accept that market response to uncertain events is consistent through time, then history provides a means to objectively describe an unknown future. While not a prediction, the past pattern of stock returns provides a reasonable distribution of future prices. This distribution provides an expected payoff, and a range of possible outcomes from which we can calculate a probability, which is perhaps the best we have for dealing with an unknown future.

Market Review

Stocks

After being up 16% last quarter, the half-dozen Tech stocks that are expected to benefit from AI (Alphabet, Amazon, Apple, Meta, Microsoft and Nvidia) gave back 4% in July. These six stocks are about 27% of the S&P 500 and explain its subdued (1.2%) return in July. While the impact of AI will no doubt be profound, the volatility of these companies’ stock prices reflect the uncertainty of its future.

While the S&P 500 Index was up just 1%, the Russell 2000, a proxy index for domestic small company stocks, jumped over 10% in July, supplying some benefit of diversification. Indices reflecting non-domestic markets were little changed in July.

Expectations for the path of interest rates drive today’s stock market. Digesting the news from the Fed is a preoccupation of many investors and explains some of the volatility in stocks. Most signs are that interest rates are heading downward.

A well-diversified stock portfolio has rewarded investors recently (annual return of 13.5%). Over the past twelve months domestic large cap stocks (S&P 500) were up 22%, domestic small cap stocks (Russell 2000) were up 15%, stocks traded in internationally developed markets (EAFE) were up 10% and emerging market stocks were up 6%. A good 12-month period indeed.

Bonds

Falling yields pushed July returns up to about 1% at the short end and 2%-3% for longer maturities. Over the trailing 12-month period, bonds returned about 5%, reasonably close to longer-term expectations.  While flattening a bit, the Yield Curve remains downward sloping (longer-term yields below those at the shorter end) indicating reduced interest rates ahead. The spread between nominal and inflation-adjusted yields at five- and ten-year maturities indicate expected inflation of just above 2% – close to the Fed’s announced goals.

What we hear in the popular press notwithstanding, there is reasonably good news on the inflation front.  Over the past 12 months the CPI was up less than 3%. However, often the rate of inflation is confused with changes in price levels – a constant annual inflation rate of 3% increases price levels by 16% at the end of five years.

Interest Rates

Anticipation of interest rate changes affects both stock and bond markets. All eyes are on the Fed, expecting a reduction in the Federal Funds Rate soon, which will lead to reductions in other market- determined interest rates.

Lower interest rates reduce the cost of capital, which is positive for stocks. A lower capital cost makes more corporate investment opportunities profitable, increasing economic activity and expected earnings  (stock price is the present value of future corporate earnings discounted at the cost of capital – a lower discount rate means a higher present value).

Falling interest rates lead to falling yields and increasing bond prices and returns. Looking at individual bonds masks the effect of changing interest rates on bond values. Changing interest rates impact bonds of different maturities differently – the longer the time to maturity the greater the impact. The maturity of an individual bond shortens as it moves toward maturity. Proceeds will be reinvested at prevailing rates.

Lower interest rates are positive for stocks and bonds. However, since markets are forward looking, lower rates may already be baked into today’s prices. Surprises, including Fed behavior and future interest rate changes, affect short-term market movements. Volatility is the only sure prediction.

Recent Market Activity

The preceding discussion includes data and analysis as of the end of July – it has not been updated to include the market’s ups and downs of the first few days of August, which have been dramatic.  Explanations include the Fed voting to keep the Federal Funds Rate where it is; an uptick in unemployment; global slowdowns; the likelihood of recession; liquidity in Japanese markets; and senior traders vacationing in the Hamptons. However, these issues were well known prior to August, leaving random noise as the best explanation, confirming that markets are volatile and unpredictable

Market Review

Stocks

Returns of stock market indices over the last quarter were mixed. The S&P 500 Index was up above 4%.  Stocks traded in Emerging Markets also turned in a good quarter, MSCI Index was up 5%. Domestic small cap stocks (Russell 2000 Index), on the other hand, were up over 3%. Stocks traded in developed international markets (EAFE Index) were about flat.

The past 12 months have been good for stocks. The S&P 500 was up 26% while other stock market indices were up between 10% and 13%.

The S&P 500 returns of 15% and 26% over the year-to-date and trailing twelve months, respectively, are well above those of other stocks and largely explained by stocks of just a half-dozen companies that are expected to benefit from the continued development of

Artificial Intelligence (AI) technology – Amazon, Apple, Google, Meta (Facebook), Microsoft, and of course, Nivida. Recent results for these companies are shown in the accompanying table: Note not only the levels, but also the differences among the recent results of these companies. Nvidia, the so-called bellwether for AI, stands out.

Bonds

Bond yields did not move much over the quarter. With little impact from changing yields, returns are up about one percent across all maturities. Year-to-date yields have increased about 0.5% resulting in negative returns, especially at longer maturities where increasing interest rates have a larger inverse effect. The pattern of bond yields for various maturities continues to be downward-sloping, signaling falling interest rates ahead, which is consistent with the Fed’s announcement of one reduction in the Federal Funds rate this year.

The Fed is committed not to let inflation get out of hand. The spread between longer-term (5-year) nominal interest rates and inflation-adjusted rates is still a reasonable 2.2%, signaling modest inflation expectations. In any event, the path of future interest rates remains uncertain resulting in continued market volatility going forward.

Diversification

The “Bull” market we have been enjoying is explained by the six stocks listed in the above table.  Obviously, to have enjoyed recent results it is crucial to have been invested in these stocks, which reflect expectations of the impact of Artificial Intelligence (AI). While expected to be profound, the future of AI is unpredictable. The short-term impact on various markets is sure to be volatile, producing significant risk in seeking to identify the future impact of AI on individual stocks.

The principle of diversification is that by holding several asset classes that move independently from one another, risk is reduced without reducing expected return. However, this strategy is difficult to implement when extraordinary returns are concentrated in just a few stocks. Yet, it is the only safe way to take advantage of the recent extraordinary rise in the few Tech stocks with appropriate risk.

The market prices of these stocks reflect where those excited about the future benefits of AI technology (buyers) trade with those concerned that we are ahead of ourselves (sellers). The economic impact of AI cannot be predicted – it is best to rely on what the market tells us, remain diversified, and hang on for the ride.

Uncertainty Today

Markets continue to be bullish on the future of AI. Nvidia, considered by some analysts to be a bellwether for the industry, turned in another blockbuster quarter with earnings up 21% and revenues up 18% over the previous quarter. It returned an eye-popping 295% over the past year. Yet, while profound, AI’s future remains unpredictable. The short-term impact on various markets is sure to be volatile. Care must be taken not to project short-term market ups and downs far into the future.

Markets respond to uncertainty for inflation and the Fed’s response. Expected inflation does not seem to be out of control. Looking at the spread between nominal and inflation-adjusted bond yields implies expected inflation over the next five years of about 2.5% – within shouting distance of the Fed’s announced objective. Yet, a 3% annual inflation rate means consumers are paying 16% more for a “basket” of goods at the end five years, which is not pleasant.

What Can Go Wrong?

The past twelve months have been rewarding for stock investors. The S&P 500 Index is up almost 30%.  Other stock market indices are up between 12% and 19%. The six largest domestic tech companies (Alphabet, Apple, Google, Meta, Microsoft, and Nvidia) representing 29% of the S&P 500, were up an average of over 100%. Truly amazing! But a run up in values of this magnitude makes us think about what can go wrong.

A recent issue of the Economist identifies some potential issues (see “Big Tech’s Capex Splurge May Be Irrationally Exuberant,” in the May 18th issue). Listed as problems in today’s rapidly changing environment are overcapacity, commodification of AI models, diminishing returns to scale and the fact that new technologies usually benefit users, not manufacturers. Theoretically, observed market prices reflect the myriad of uncertainties of AI’s future. However, given today’s excitement for the future of this technology surprises could be significant as it unfolds.

Market prices reflect where those excited about the future benefits of this technology trade off with those concerned that we are ahead of ourselves. The economic impact of AI cannot be predicted – it is best to rely on what the market is telling us and hang on for the ride.

Market Review

Stocks

Stocks continue a positive trajectory in May. The Dow hit 40,000 during the month before retreating a bit.  While all are positive, year-to-date results are more mixed – an 11% return for the S&P 500; 3% for domestic small cap stocks (Russell 2000); and International developed market and emerging market indices are up 7% and 3%, respectively. The S&P 500 Index is heavily weighted to tech stocks, which explains much of its relative performance.

Bonds

Reflecting a slight drop in yields, bond returns were positive in May. Year-to-date yields are up resulting in losses for longer maturing bonds. The downward shape of the yield curve (short-term rates above longer-term rates) continues to signal Fed easing. However, easing rates in a robust economy is unconventional and, no doubt, helps to explain the Fed’s hesitancy.

Sustainable Investing 

Incorporating sustainable investments in your portfolio can be simple. At Rockbridge, we offer solutions designed to meet your goals.

If you’d like to learn more about integrating sustainability and climate considerations into your investment process,  please visit Rockbridge Institutional  Sustainable Investing to learn more.

Inflation Redux

Renewed uncertainty about the future path of inflation is driving both stock and bond markets. After peaking at about 9% in March 2022, inflation as measured by the trailing 12 months, change in the Consumer Price Index (CPI), had been falling steadily to 2.4% in September 2023. However, since then it has been climbing, reaching the latest annual rate of 3.4%, well above Fed targets.

Inflation is usually either “cost push,” or “demand pull.” Cost push is a rise in general price levels from increasing costs without a corresponding increase in value. Demand pull is too much money chasing too few goods. Both causes can explain recent bouts of inflation.

Increasing costs due to the temporary supply chain disruptions from the pandemic, and boycotts of Russian oil after its invasion of Ukraine, help to explain the rapid run-up of inflation to 9%. Classic “cost push.” As these costs work through the economy, this inflation can become transitory.

Additionally, to help soften the economic impact of the pandemic-induced “lockdowns,” the government ran massive deficits to 120% of GDP. Deficits have remained at this level even as the economy bounced back. Government spending in response to the pandemic-induced slack economy may not have been inflationary, but in today’s more robust economy can result in price increases.

Where to go from here? No doubt the Fed is committed to not let inflation get out of hand. Consequently, any cut in interest rates will depend on the path of inflation. While we have enjoyed a “soft landing” so far, as the Fed keeps its Federal Funds rate high, it is reasonable to expect market-determined, longer-term interest rates to remain high, increasing the probability of a recession. Yet, the spread between longer- term nominal interest rates and inflation-adjusted rates is still a reasonable 2.3%, signaling modest inflation expectations. In any event, economic uncertainty has increased and we can expect continued market volatility.

Market Review  

Stocks

In April, stocks were down from 1.3% (emerging markets) to nearly 7% (domestic small cap markets). Much of this drop was triggered by inflation measures greater than expected, putting in doubt the Fed’s commitment to cut interest rates. Additionally, a pause for a breather after the robust markets (S&P 500 up 23% over the past year) is not surprising – investors shedding risk.

Year-to-date, the S&P 500 was up 6.0% outpacing other market indices, thanks to ongoing enthusiasm for the largest tech stocks: Amazon, Google, Meta and Nvidia, primarily. Year-to-date losses in Apple and Tesla have curtailed talk of lumping tech stocks into the so-called “Magnificent Seven.” Except for stocks of small companies (off 2.2%), other markets were up over this period.

Bonds

Yields increased this month due to dashed expectations for a rate cut in the immediate future.  Consequently, bonds were off 0.2% at the shorter end (1-3 years) and 4.4% for longer maturities (5-10 years) both this month and year-to-date.

Over the past two years, real interest rates (adjusted for inflation) have risen from zero to 2.3% for five-year Treasuries. While a jump of this magnitude in a short period creates uncertainty, zero to negative real interest rates were never sustainable.

Nvidia: A Bubble or Rational Exuberance

Clearly, the stock market is positive on the future of Artificial Intelligence (AI). The trajectory of Nvidia, a company engaged in the production of products for the industry, is especially a case in point. Its stock price has nearly doubled since the first of the year – up 220% over the trailing12-months. Truly extraordinary and raises the “bubble” question.

A bubble is characterized by a rapid run-up of asset prices that is well above any reasonable measure of intrinsic value. Unfortunately, it is best recognized in hindsight. Adding to the uncertainty, it oftentimes is in response to the emergence of a new paradigm. Clearly AI fits. However, while the recent rise in Nvidia’s stock price reflects exuberance, it’s a bubble if it strays dramatically from a reasonable measure of its value.

Nvidia reported a blockbuster fourth quarter – year over year sales up 265% and income up 769%. Its current PE ratio is 40 times projected 2025 earnings, well above market averages and signaling “exuberance.”  However, stock prices reflect expected future earnings well beyond a year. While projecting earnings far into the future, especially in this AI-uncertain environment is tricky, Nvidia is a legitimate company that is well-positioned in the industry. While, no doubt, there will be volatility as new information in an uncertain environment emerges, generally, prices established in a well-functioning market are the best reflection of an uncertain future.

Market Review

Stocks

Stocks turned in a good quarter. Large cap stocks (S&P 500) led the way, up by over 10%. Other market indices are up from 2% to nearly 6%, as well.

Over the trailing twelve months stocks are up nicely. The S&P 500 is up 30%. It was a good period for other stock market indices also – 20% for small company stocks, 15% in developed international markets, and 8% in emerging markets.

While contributing to the positive stock market environment is the expectation of a near-term reduction in the Fed funds rate, the prospects for AI are driving much of the recent activity, especially in the S&P 500.  The Tech companies expected to participate in AI (Alphabet, Amazon, Apple, Microsoft, Meta, Nvidia and Tesla), are the so-called “magnificent seven.” While the returns of these companies over the last twelve-months were extremely variable, ranging from a loss of 20% (Tesla) to a gain of 220% (Nvidia), suggesting a less than homogenous grouping, an equally weighted portfolio returned 72%, indicating the extent to which the S&P 500 is narrowly focused and reflects the future for AI. While it is expected that AI will be transformative, plan on volatility as the market sorts out its impact.

Bonds

Note from the accompanying chart of bond yields over several maturities at the shorter end, yields remained about where they were at the beginning of the quarter, but increase as the time to maturity lengthens. As bond prices and returns move inversely to changes in yield, over the past quarter our short-term index (1–3 year Treasuries) was up 0.2% while the index for long-term bonds (7–10 year Treasuries) was down 1.9%. Over the trailing 12 months – up 3% at the shorter end, and down 1% for longer maturities.

The downward pattern of bond yields is consistent with expectations for reduced interest rates ahead.

The spreads between nominal and inflation-adjusted yields suggest reasonable inflation levels going forward – about 2.5% for five years. This measure of expected inflation is close to the Fed’s target.

The Path of Future Interest Rates

The future path of interest rates is high on the list of what worries markets today. We can gain some insight by anticipating the Fed’s response to changes in the economic landscape and by looking at the pattern of yields on bonds across various maturities.

The Fed has the twin mandates of stable prices and full employment. Inflation expectations are, of course, a key consideration. After the Fed ratcheted up rates over the past two years, inflation seemed under control and a cut in the Federal Funds rate was expected. However, inflation snapped back a bit in January, putting this forecast in jeopardy, producing turmoil in markets. The Fed’s latest pronouncements are consistent with a rate cut, but further down the road once the prospects for inflation and economic activity become clearer. Thus, while the path of interest rates is for a reduction, the timing remains uncertain.

The Fed controls the short-term Fed Funds rate. Longer-term rates reflect the buying and selling by traders in the bond market, which is reflected in the pattern of yields. The observed yield is what a trader earns if the bond is held to maturity. However, there is a market in which bonds can be traded – investors do not have to hold the bond until it matures. Thus, the pattern of yields at various maturities is formed by combinations of observed and expected yields. For example, two-year yields (4.6%) include the combination of observed one-year yields (5.1%) and expected lower yields (4.2%) one year hence. Consequently, today’s pattern is telling us to expect lower rates.

While uncertainty remains, both the Fed and yields point to reduced rates ahead. We’ll see.

Market Review  

Stocks

Stock indices were up nicely in February. All but developed international markets (EAFE index), which was up 1.8%, jumped nearly 5% this month. Over the past 12 months, stock investors have been rewarded – a diversified stock portfolio earned 12%, well above historical averages. The S&P 500 12-month return of 31% stands out.

The S&P 500 continues to be driven by the results of the largest tech companies engaged in the development of Artificial Intelligence (AI). Nvidia, the premier manufacturer of chips for AI, is the poster child. Its recently reported earnings were well above market expectations producing a one-day pop of over 16% on the news. It is up 29% in February and 243% over the trailing twelve months – extraordinary results indeed.

China is about 25% of our emerging markets index and explains much of its volatility. A proxy index for China’s stock market was up 10% in February, but about flat over the last quarter and down nearly 20% over the trailing twelve months.

Bonds

Our Treasury bond indices were down from 0.3% for short-term maturities to almost 3% at the longer end in February due to rising yields. The total increase in 5-year and 10-year yields of about 0.5% is explained in equal measures by increasing inflation expectations and an uptick in the underlying cost of capital.  Over the trailing 12 months, Treasury securities maturing in the 3–5-year range earned 4.2%, a 1.4% premium above inflation (CPI).

The Price Earnings (P/E) Ratio

The P/E ratio is used by analysts to establish a company’s expected value. Multiplying either reported or projected earnings by this ratio gives an indication of this value. It provides a perspective on current stock prices.

The PE ratio is the price per share divided by earnings per share. It measures what the market pays for a dollar of reported earnings. While substantial effort is oftentimes used to project future earnings, as P/E ratios are not constant, this analysis must be done with care.

P/E ratios not only differ widely among companies, but also fluctuate significantly over time depending upon the company’s growth opportunities and the economic landscape. For example, while the P/E ratio of the S&P 500 over the past 90 years has been generally between 10 and 20 times; it has been as low as 6 times and, briefly, over 120 times. A high P/E ratio signals that a large portion of future earnings are expected to come from investment opportunities (growth).

P/E ratios for S&P 500 stocks have been increasing over the trailing 12-month period – from 22 to 26 times. Increasing P/E ratios help to explain the 21% return of the S&P 500, which is well above other market indices. Not surprisingly, the current P/E ratios of the so-called “Magnificent Seven” are above what’s typical, no doubt reflecting prospects for Artificial Intelligence (AI) – Amazon (84 times), Nvidia (82 times), and Tesla (61 times) stand out. These P/E ratios mean that the future impact of AI is a significant part of today’s stock price.

Market Review  

Stocks

Stock indices were mixed in January. Stocks traded on developed international markets were up a little less than 1% (EAFE Index) while emerging market stocks (MSCI Index) were off almost 5%. The S&P 500 Index was up almost 2% in January. This result is concentrated in stocks of just a few tech companies – the “Magnificent Seven” less Tesla that lost 30% due to a hiccup in earnings and concerns for the whims of Elon Musk.

Our emerging markets index was dragged down by losses in China and Korea, both down about 9%. These two countries make up 40% of the index. Over the past year, China was down 23%, primarily reflecting the economic turmoil from debt-financed real estate.

At their recent meeting, the Fed voted to keep the federal funds rate where it is. While the market’s initial response was negative, it has bounced back since. The current pattern of yields over the next year implies a drop of about 1% in short-term rates. However, not only is the eventual cut by the Fed uncertain, the impact on stocks depends on the extent to which any change is already imbedded in prices.

Bonds

Not much change in bond prices in January. Up a bit at the short end; down a bit for longer maturities.    The shape of the Yield Curve is currently downward sloping with short-term yields above longer-term yields, which has been the case for some time. To return to the more typical upward slope, either short-term rates must fall, or longer-term rates rise. Falling short-term yields seem more likely, but we’ll see.

Year in Review

After plenty of ups and downs throughout the year, financial markets turned in reasonable results in 2023 – a globally diversified stock portfolio was up 16%, a reasonable proxy for bonds (Barclays Aggregated Bond Index) returned 6%. News on several fronts helps to explain this year’s results:

Interest Rates, Inflation and Prospects for a Soft Landing

Throughout 2023, all eyes were on the Fed’s effort to tamp down inflation without a recession. Much uncertainty was associated with its ability to pull this off. During the year, the Fed raised its Federal Funds Target Rate by 1% to 5.5%, which seemed to have the desired effect, as the annualized change in the Consumer Price Index (CPI) fell from almost 7% to 3% by the end of the year. Unemployment remained at historical lows in a growing economy suggesting a soft landing – not the conventional wisdom at the start of the year.

Stocks responded positively. The tech-ladened S&P 500 was up over 26%; domestic small company stocks (Russell 2000) up 17%; international developed markets (EAFE Index) returned 18% and emerging markets (MSCI Index) 10%.

Bond yields fell back in response to expectations that the Fed is done raising interest rates. The yield on the closely watched 10-year Treasury Note fell over 100 basis points (1%) from its October peak. Yields are now about where they were at the beginning of the year, producing returns for Treasury securities of about 4% across all maturities.

Artificial Intelligence and the Magnificent Seven

News on Artificial Intelligence (AI) impacted financial markets positively. Amid the short-term uncertainty, it is clear the impact of AI will be profound. Domestic tech companies expected to benefit from AI, termed the “Magnificent Seven” (Apple, Amazon, Google, Meta, Microsoft, Nvidia and Tesla) representing 30% of the value of the S&P 500, were up big in 2023. An equally weighted portfolio of these stocks more than doubled over the year.

Interest rate risk and bank failures

Rapidly rising interest rates from near zero means banks are susceptible to interest rate risk by funding long-term loans with short-term liabilities. This risk explains the failures of Signature Bank and Republic Banks, as well as increased concern for the banking system in early 2023.

Political upheaval

We have endured our share of political upheaval in 2023, including the ongoing fighting in Ukraine, the brutal attack by Hamas and Israel’s response, coupled with the ongoing dysfunction of our Congress. This political wrangling and global uncertainty, plus a three-year increase in the average price of goods in the CPI of 17%, helps to explain the public perception of the domestic economy generally being worse than what’s implied by the numbers.

What’s Ahead in 2024

The beginning of a year is when we are treated to various forecasts of what’s ahead. Don’t pay any attention – no one knows. A long history of market behavior does give us a sense of what’s expected, but what’s realized is driven by surprises, both positive and negative. Market prices are the best predictor – diversification is the best way to deal with uncertainty. Take advantage of the wonders of compound interest by maintaining established commitments to several markets and avoid getting caught up in anyone’s predictions.

Investing in the “Magnificent Seven”

Now the leading high-tech companies are the “Magnificent Seven” (those of a certain age will relate). These companies – Apple, Alphabet (Google), Amazon, Meta (Facebook), Microsoft, Nvidia, and Tesla – make up about 30% of the S&P 500 index. While it is a stretch to expect an investor is lucky enough to have built and maintained an equally weighted portfolio of these stocks over the past ten years, had they done so it would have earned a compound annual return of 40% – an extraordinary result indeed. Unfortunately, investing is not done with hindsight. We can’t expect a repeat performance of the last ten years for the “Magnificent Seven.”

Realized returns depend on how an uncertain future unfolds versus what’s expected. The extraordinary past results of the “Magnificent Seven” can be explained by changing expectations for the impact of AI (Artificial Intelligence). Unfortunately, the future of AI, while no doubt profound, is probably no clearer today.

Market prices reflect the best predictions based on what is known. Any predictions that are different should be taken with a “grain of salt.” While we are faced with significant uncertainty about the future of AI, at any point in time market prices reflect this unknown future. Of course, there will be surprises — diversification lessens their impact.

Yet, it is important to participate in the risks and rewards of AI. Since the S&P 500 includes a significant commitment to the “Magnificent Seven,” holding an allocation to stocks of this index in a well-diversified portfolio meets this objective. Avoid trying to guess the future of AI by maintaining established commitments and enduring the impact of the surprises

Market Review

Stocks

Stocks snapped back nicely this month on the positive inflation news, leading to expectations that the Fed will relent on increasing interest rates. Stock market indices are all up over 8%. The November numbers are evidence of how quickly markets can turn around. I don’t recall many predictions of a turnaround at the beginning of the month.

Year-to-date returns, while variable among various markets, are all in positive territory. The 20.8% return of the S&P 500, which is dominated by the largest tech companies, is well above other stock market indices that ranged from 4% (Russell 2000) to 12% (EAFE). The jury is still out on whether these recent results are evidence of the so-called “soft landing” from the Fed’s efforts to tame inflation – but it feels better.

Bonds

Bond yields dropped in the past month, also reflecting the positive inflation news and Fed expectations.  While yields on short-term bonds stayed about where they were, longer-term yields dropped significantly producing positive returns on longer-term bonds. The yield on the bellwether 10-year Treasury fell significantly from 5.0% to 4.3%, a -0.7% drop for the month.

As the Fed embarked on its program to tame inflation, the 10-year yield has jumped a remarkable 300 basis points (3%), alarming many observers. However, it is important to note that this increase is off an unsustainable low. Yields at today’s levels are more reasonable.

Interest Rate Risk in Bonds

Rapidly rising interest rates explain bond market losses in recent periods. The Bloomberg U.S. Aggregate Bond Index, a reasonable proxy for the U.S. bond markets, is off 4% over the past three months, confirming that bonds are risky.

Bond risk is from two sources primarily – credit risk and interest rate risk. Credit risk is straightforward – it’s the chance that the bond won’t pay interest and principal as agreed. The premiums for bearing this risk change primarily in response to changes in the economy. Interest rate risk is the variability in bond values in response to changes in interest rates. Recent results reflect the impact of changes in interest rates (interest rate risk).

Interest rate risk is not the same for all bonds. It depends on its duration (years to maturity adjusted by the effect of periodic cash flows). We can see the impact of duration on bond returns by looking at recent results for U.S. Treasury indices. Securities issued by the U.S. Government, by definition, bear only interest rate risk. The 1-3 Year Index earned 1%, while the 3-5 Year Index lost 1%, and the 7-10 Year Index lost 5% over the past three months. It’s only if the bond is to be held to maturity and there are no coupon payments (Treasury Bill or zero-coupon bond) that it will earn the yield implied when it was purchased. Otherwise, there is interest rate risk.

Bonds are risky – the sources of this risk are complex. It is important that they are well understood.

MARKET REVIEW

Stocks

While showing some signs of coming back, stocks are down this month, which brings the trailing three months’ numbers to negative 3% for the S&P 500 and 12% for the domestic small cap index (Russell 2000). In this three-month period our international market index (EAFE) and emerging market index (MSCI Emerging Markets) are down 6% and 8%, respectively. A globally diversified stock portfolio is off 8% over this period.

Clearly, there has been a reduction in the appetite for risk. However, while the turmoil in the Middle East gives us more to worry about, the economy seems in good shape – unemployment is low, inflation is falling, rapidly increasing interest rates are mostly behind us, and we seem to have avoided a recession. Of course, it’s hard to be optimistic about inflation when the average price of items that make up the Consumer Price Index (CPI) has gone up 30% over the past three years. The outlook seems better and, as the past few days have demonstrated, it can become positive quickly.

Bonds

Over the last three months, yields on short-term Treasuries have not moved from the 5.5% range. After moving up significantly, longer-term yields fell back in just the last few days of the month to where they are just above where they were at the beginning of the month. Over the trailing three months, on the other hand, these yields have pushed up – the current 10-year yield of 4.7% is up from 4%. Since bond prices move in the opposite direction from yields, we can see the impact of these increases in the 3.5% loss in the 7–10-year Treasury index. The spread between nominal and inflation-adjusted yields, a reasonable measure of the market’s expectation for inflation, has remained at a little more than 2%.

“Irrational Exuberance” and Market Pricing

The price of Nvidia stock, a software design and development firm that manufactures chips integral to the gaming industry and, consequently, a proxy for Artificial Intelligence (AI), skyrocketed from $142 per share on December 30 to $494 per share today – a gain of over 230%. Does this increase in value reflect irrational exuberance or the markets’ pricing of the unknown future of AI?

Unlike cryptocurrency there is substance to AI. It has the potential to profoundly impact society and the economic landscape. While exciting, much of this potential is unfolding. Market prices discount today all that is known about this uncertain future. As new information becomes available, it is quickly incorporated into prices and results in ups and downs, which can be dramatic. Today’s prices of AI stocks, especially Nvidia, gives us a hint of what market participants expect for AI. While dramatic, it can reflect “rational exuberance.”  Where these prices go from here depends on unknowns, which can be both positive and negative for AI.

MARKET REVIEW

Stocks

Stocks were down across the board this month. With little change in the outlook for inflation and economic growth, this month’s drop seemingly reflects less appetite for risk. Yields moved up, making less risky bonds relatively more attractive. While we would like to explain monthly ups and downs in stock market behavior, oftentimes it is simply random noise. Quarter-to-date results, except for the slightly negative results in the International Developed Market Index (EAFE), were positive, however.

The year-to-date numbers remain upbeat. Even after the August falloff, a stock portfolio diversified sufficiently to span global markets is up nearly 9%, led by a 19% uptick in the S&P 500, which is heavily influenced by domestic Tech companies that are primed to participate in the future of AI.

A portfolio of stocks traded in the China markets was off nearly 6% since the first of the year, a distinct outlier from other markets. This performance, no doubt, reflects the economic slowdown and the implosion of its real estate market. The significance of China notwithstanding, many analysts observe that because our trade with China is not large and our financial markets are not correlated, this slump will have a minimal effect on the U.S. economy. While China is an outsized contributor (26%) to our emerging market allocation, it represents less than 4% of our global stock portfolio.

Bonds

Yields on longer maturing bonds were up, resulting in negative returns (price reductions offsetting coupon payments). Yields on 10-year Treasuries climbed more the 0.3%. This uptick is in real interest rates, not inflation expectations, as the spread between nominal and inflation-adjusted yields has remained at a little more than 2%.

While the Yield Curve (pattern of Treasury yields across several maturities) continues to slope downward, with increasing yields at longer maturities, it has “flattened” to some extent, but still consistent with falling future interest rates. Reduced inflation expectations and an economic slowdown continue to be the popular explanations. We’ll see.

Inflation and a “Soft Landing”

Inflation expectations and the economic impact of the Fed’s ratcheting up its Target Interest Rate has been a major source of uncertainty. So far, the trajectory of inflation has been in the right direction and unemployment has remained low. The trailing 12-month change in the Consumer Price Index (CPI) has declined from its peak of 9% in March 2022 to less than 3% this month, while unemployment has remained in the historically low 3.6% range. Equity markets have responded positively. However, this good news notwithstanding, uncertainty seems to persist.

This uncertainty reflects the conventional wisdom that increasing interest rates to fight inflation means a recession. One indicator of an impending recession is a downward sloping Yield Curve (future interest rates expected to be lower). The argument here is that the Fed will have to reduce rates to pull the economy out of a recession. However, the shape could also mean lower future inflation. Interest rates typically include a risk-free rate plus a premium for expected inflation. With inflation coming down, a reduction in that premium could explain the expectation for lower interest rates implied by the downward sloping Yield Curve.

Further confounding the usual link between rising interest rates and a recession, is the extent to which inflation is embedded or transitory. The pandemic not only produced massive deficits to offset unemployment, but it also brought on supply chain disruptions. Additionally, the invasion of Ukraine drove grain prices up. While these factors seem temporary, with the recent 0.25% increase in its Target Federal Funds rate, the Fed seems committed to drive out any embedded inflationary expectations erring on the side of an economic slowdown.

What to do in the face of these uncertainties is always the same – avoid predictions, continue to rebalance to established strategic allocations, and enjoy the ups and endure the downs 

Market Review

Stocks

Stocks up nicely this quarter with returns from 3% to over 6% for small cap value stocks. Diversification helped this quarter as markets other than the S&P 500 picked up the pace. Year-to-date, however, it’s that market (S&P 500), led by the usual Tech companies (Amazon, Apple, Facebook, Google, Microsoft and Nvidia), that turned in returns better than 20%. Nvidia, perhaps the most popular way to jump on the AI bandwagon, more than doubled since the beginning of the year. Other stock markets turned in returns nearing 10% over the year-to-date period.

Bonds

Yields were up resulting in essentially flat bond returns (price reductions offsetting coupon payments) this month. This pickup in yields is consistent with the Fed’s 0.25% increase in its Target Interest Rate.

The Yield Curve (pattern of Treasury yields across several maturities) continues to slope downward, suggesting reduced yields ahead. The jury is still out as to whether this signals a future need for the Fed to reduce rates in response to a recession or reduced inflation expectations. The market’s expectation for inflation, as evidenced by the spread between 5-year nominal and inflation adjusted bond yields, remained at just above 2%. This number is consistent with the Fed’s target and a seemingly positive implication for inflation ahead.

Predicting Future Prices

If we could predict future prices for financial assets, then investing would present no problems. As Will Rogers tells us: “Don’t gamble; take all your savings and buy some good stock and hold it till it goes up, then sell it. If it don’t go up, don’t buy it.”  Unfortunately, it doesn’t work that way.

The observed market price, which consolidates the predictions of all participants from available information, is usually the best price. Because new information comes randomly, prices will fluctuate unpredictably – investors need confidence to make decisions using only observed market prices.

Instead of predicting the future, we can use past data to construct an average and, importantly, a range.  Using this description of the future allows us to consider investment alternatives objectively. Relying on predictions to make these decisions, while it can be comforting, rarely pays off.

Market Review

Stocks

Stocks were up this quarter and six months, helped by significant advances in a few large tech companies. The S&P 500, which is over-weighted by these stocks, was up almost 9% for the quarter.  Other market indices were up between 1% and 5%. The story is much the same for the year-to-date numbers. While over this period international developed markets (EAFE), domestic small cap stocks (Russell 2000) and emerging markets (MSCI emerging markets) were up a comfortable12%, 8% and 5%, respectively – they were well below the 15% return of the S&P 500. The equally weighted portfolio of the six largest tech stocks (Apple, Microsoft, Google, Amazon, Nivida and Facebook) was up 27% over the quarter and 83% year-to-date. Nvidia, a software company engaged in the manufacture and distribution of chips for AI (Artificial Intelligence) headquartered in Santa Clara, CA, is new to this group. It was up over 50% for the quarter, and has nearly doubled in value since the first of the year. These numbers tell us the market’s enthusiasm for AI. We’ll see whether it is misplaced.

The Consumer Price Index (CPI) is up 2.7% over the trailing twelve months, close to the Fed’s long-term objective. While the Fed has paused its drive to increase interest rates, inflation remains a concern and there are no declarations of victory, only discussions of the difficulty of interpreting the data. Regardless, we are in a better place than a year ago, which helps to explain the positive stock market.

Bonds – Yields Versus Returns

Over the June quarter, bond returns are negative, reflecting rising yields. The Yield Curve (pattern of bond yields for various maturities) shows a parallel shift upward of about 0.5%, which is consistent with the increase in the Fed’s Target Federal Funds rate. Bond prices (returns) move inversely to yields – yields up, prices down.

Today’s Yield Curve is unusual. The typical curve slopes upward, showing yields increasing with maturity.  The downward sloping curve we see today anticipates falling interest rates. We earn 5.4% annualized, investing for 3 months versus 4.3% for three years.

However, taking advantage of today’s short-term interest rates is not without risk, as proceeds from short-term bonds must be reinvested at an unknown rate at maturity. Today’s Yield Curve tells us this rate will be lower and in fact, one explanation (Expectations Hypothesis) of the observed shape of the Yield Curve is that you will end up at the same place by taking advantage of the higher short-term rates and “rolling over” the proceeds over three years as you would by earning the three-year rate. Market predictions of future yields are embedded in the observed Yield Curve.

Stocks

Stock markets are volatile waiting for some resolution of today’s uncertainties, which include not only the Debt Ceiling, but also the banking system, the trajectory of interest rates and the Fed’s perseverance, inflation expectations and the prospect for a recession.  Monthly stock returns are mixed – Domestic stocks are little changed; international stocks are down.  The year-to-date numbers look better driven by the largest US Tech Companies and developed international markets.  The EAFE is up 7% and the S&P 500 is up nearly 10%, almost all of which is explained by Apple, Microsoft, Google, Amazon and Facebook.

Bonds

Over the past thirty days yields for shorter-term bonds were up, especially for one-month maturities.  Yields for bonds that mature beyond two years were little changed.  The shorter-term yields shot up due to the uncertainty in the resolution of the US debt ceiling negotiations.

The yield curve continues to slope downward – usually a sign of lower interest rates ahead, which is consistent with expectations for a more accommodative monetary policy to combat a recession and reduced inflation.  The spread between 5 and 10-year nominal and inflation-adjusted yields, a reasonable measure of market expectations for inflation over these periods, remains just above the Fed’s 2% objective.

Diversification

The year-to-date stock market numbers show us some of the short-term costs of maintaining a well-diversified portfolio.  Recently large company stocks traded in both domestic (S&P 500) and international (EAFE) markets, earned returns well above those of other markets making it uncomfortable to remain committed to a diversification strategy.  Yet, it is well known that diversification increases a portfolio’s expected return without assuming more risk – a “free lunch.”

Allocations to value stocks (value effect) and stocks of small companies (size effect) have been shown to produce diversification benefits.  It is reasonable to expect premiums of 1% to 1.5% but with considerable short-term variability.  This variability is especially evident in recent periods. While over the previous three years a portfolio geared to take advantage of this value and size effect has matched the returns of broad market indices, recently it has lagged by an uncomfortable 3% margin.  However, because shortfalls will not last forever and turnarounds can happen quickly, it is important to remain committed to these markets.

Monitoring Results

Monitoring results is an important role of fiduciaries. While at first glance this process seems straightforward, it is not.  Two problems loom – (1) using short-term results to monitor long-term expectations, and (2) random noise in the data. To deal with the first problem fiduciaries construct and maintain benchmarks that reflect appropriate risk profiles.  Periodic results are measured against these benchmarks and nothing else.

The second problem means that periodic results will not always match even a well-constructed benchmark – sometimes they will be above, other times below (tracking error).  Regardless of whether positive or negative, tracking errors must be investigated, and explanations understood.

Monitoring periodic results and maintaining diversification strategies can be hard, yet is key to investment success.

Stocks

Large cap stocks, traded in both international and domestic markets, were up in April; emerging market stocks and stocks of small companies, on the other hand, were down. Year-to-date stocks produce positive returns that range from 1% in small cap stocks to almost 12% for developed international markets. Year-to-date stocks have performed reasonably well with a globally diversified stock portfolio, earning 4%.

Bonds

Since the beginning of the year bond yields were up at the short end, but down across maturities beyond 90 days, resulting in positive bond returns (bond prices move inversely with yields). The pattern of yields across various maturities peaks at three-months and falls off steadily before beginning to move up at about ten years. This shape is consistent with expected lower interest rates, which might be explained by the Fed “taking its foot off the gas,” lower expected inflation, or an expected economic slowdown – take your pick. The spread between nominal and inflation-adjusted five-year yields, a reasonably good indication of expected inflation over that period, stayed at about 2.5%.

Uncertainty

The trajectory of inflation, the path of interest rates, expectations for a “soft landing,” the banking system and a looming debt ceiling are some of the sources of uncertainty today. While we can be concerned about what inflation has been, current numbers tell an improving story – the Consumer Price Index (CPI) was flat for the month and under 1% year-to-date. The Fed seems to be committed to keeping interest rates high. However, keeping them there too long and triggering a recession is a worry. While there could be surprises ahead, markets seem to be taking today’s unknowns in stride. We’ll see.

The Wonders of Compound Interest

Einstein referred to compound interest as the eighth wonder of the world! He went on to say: “he who understands it – earns it, he who doesn’t – pays it.” To profit from compound interest investors must establish and maintain commitments to risky markets through thick and thin. It is especially important to avoid the common urge to move into the asset class with the best recent results. While diversification means always looking back with regret from commitments to some markets, the fruits of compound interest come from enduring this short-term regret and looking ahead.

The wonder of compound interest lies in its ability to turn small amounts into significant sums over time (playing golf for $1.00 that doubles every hole means playing the 18th hole for more $260,000!). It is the process of earning interest on both the principal amount and reinvested interest that accumulate over time. It means that the longer the portfolio is left untouched, the more it will grow due to this compounding. It is a powerful tool to leverage time to achieve investment goals and weather market volatility.

Investors seeking to build wealth know they must endure risk to achieve growth. Maintaining a diversified portfolio throughout the inevitable market ups and downs is the best way to navigate an uncertain path to growth and realize the wonder of compound interest.

Stocks

After enduring ups and downs due to the uncertainty in the financial system and the Fed’s response triggered by the collapse of Silicon Valley and Signature banks, stocks ended the first quarter in positive territory. Domestic large cap stocks, International developed markets and emerging markets were up between 4% and 8%, small cap stocks and REITs up just under 3%. Over the trailing twelve months, on the other hand, except for International developed markets, stocks were down significantly because of rising interest rates and inflation uncertainty.

While the past year was not kind to stocks, the story has been mostly positive over longer periods. The past three years saw a portfolio diversified among several markets earning about 15%. Although with considerable variability among individual markets, a diversified stock portfolio earned about 4% and 7% over the last five and ten years, respectively.


Bonds

Recent turmoil in the banking system drove bond yields down, especially for longer maturities. Since prices move inversely to yields, this downward trajectory in yields pushed first quarter bond returns up between 1.5% and 2.8% depending on maturity. The Yield Curves below show the extent to which yields have climbed since March 2022. The primary culprit is the Fed increasing its Federal Funds rate to dampen inflation. While yields fell back a little this quarter, with the recent 0.25% increase in the Federal Funds rate, the Fed seems committed to keeping rates high for the immediate future.

The spread between nominal- and inflation-adjusted five- and ten-year yields, which is a reasonable measure of the market’s expectation for inflation over these periods, is close to the Fed’s inflation target. The shape of the yield curve can be a harbinger of future interest rates – today’s downward sloping shape implies reduced rates ahead. These signals are positive for future inflation.


Failure of Silicon Valley and Signature Banks

The turmoil in banking brought on by the collapse of Silicon Valley and Signature Banks has not only unsettled markets, but also increased uncertainty in the financial system associated with rapidly rising interest rates and the fight to dampen inflation. These two banks failed because after being accustomed to low interest rates, management lost track of the impact of rising interest rates on bond values. It was surprised by the prices at which its bonds had to be liquidated to meet unanticipated depositor withdrawals, causing sharp losses and eventual failure.

Further exacerbating this interest rate risk, these banks had a concentrated base of large depositors. In response, the Fed has stepped in to protect all depositors. While this intervention has lessened the impact of this crisis, the extent to which it creates a moral hazard that distorts future economic decisions is a downside.

While the implications of the failure of these two banks appear to be well-known and somewhat manageable, it brings heightened uncertainty, not only in the banking system, but also with the Fed’s continued resolve to squeeze out inflation, the availability of credit and economic activity going forward. While the market has absorbed this uncertainty reasonably well so far, we can anticipate continued market volatility.

Stocks

All stock markets were down In February no doubt reflecting the ongoing uncertainty of rising interest rates, inflation and an economic slowdown.  With its 0.25% increase in its Federal Funds Target Rate, the Fed continues to signal its commitment to rein in inflation.  While Consumer Price Index (CPI) increases are looking better recently, no one is declaring victory.  How far the Fed will go with increasing rates and whether it will trigger a recession remains uncertain.  Not only does this uncertainty impact stocks negatively, but also Increased interest rates reduce the present value of future cash flow and stock prices generally.

This ongoing uncertainty helps to explain losses in domestic large cap (S&P 500), small cap (Russell 2000) and international developed markets of about 2% this month.  Emerging markets were off nearly 4%. After a pretty good January, these February results brought the quarter-to-date returns in a global stock portfolio to under 5%.  While short-term stock returns are unpredictable, continued volatility remains a safe bet.

Bonds

Yields for Treasuries maturing beyond a year, yields were up 0.05% in February pushing prices down. An index of 3-to-5-year Treasury securities was off 2% in February.  An index of shorter maturing Treasures was off a little less than 0.1% while those maturing in 7-to-10 years were down over 3%.

While the future path of inflation is far from clear, market predictions over 5- and 10-year periods obtained from the spread between nominal and inflation adjusted yields has remained relatively constant at about 2.5%, which provides some comfort that inflation may be short-lived.  We’ll see.

The Value Premium

After trading at significant discounts in recent years, over the most recent twelve months an index of domestic large cap value stocks traded at a premium of 8% to the S&P 500.  These results prompt an examination of the persistence of value premiums.

Stocks are often divided into two categories – “growth” and “value”.  Expected cash flows from growth stocks reflect future investment opportunities and a steeper trajectory, expected cash flow from value stocks, on the other hand, are from assets in place, and consequently the slope is flatter and more immediate. Growth stocks are distinguished by higher price to earnings (P/E) ratios, value stocks by lower PE’s and higher book to market ratios.  Value investing goes back to 1934 with the publication of Benjamin Graham’s “Security Analysis – Warren Buffett is a disciple.  Metrics that distinguish growth and value stocks are used to build indices and allow us to measure value premiums in past data.

Using indices published by Russell and MSCI we observe an average 1% premium in domestic small cap and international market indices.  We don’t see an average premium in domestic large cap market in Russell indices.  However, an annual average value premium that exceeds 2% with greater volatility is present using the so-called “pure value index” published by Standard & Poor’s. While there is evidence of a value premium over the long run, taking advantage means accepting volatility.

Stocks

Stocks continued to climb in January, with small company and non-domestic stocks earning between 8% and 10% leading the way.  Domestic large cap stocks (S&P 500) returned 6% for the month somewhat less than other markets, which is a change from recent history. A globally diversified stock portfolio was up 8% for the month and 14% over the trailing quarter. International developed markets and emerging markets were up 8% this month and 19% over the trailing quarter reflecting to some extent the decline in the value of the dollar.  These recent numbers demonstrate the benefits of diversification to non-domestic markets.

Bonds

Except for an up-tick in one-month maturities, short-term bond yields did not move much in January.  Yields on longer maturing bonds (beyond two-years), on the other hand, fell a bit resulting in positive returns.  An index of U.S. Treasury securities maturing in 1 – 3 years returned 0.7% in January; the 3 – 5-year index earned 1.7%. Over the trailing 90 days, the shorter-term index posted a 1.8% return; longer-term index returned 3.6%.  These results are significantly better than what we experience the past twelve months.

Inflation as measured by changes in the Consumer Price Index was flat for the month and trailing quarter.  Over the training twelve months the change was 5.7%, well below 8.7% we saw in March 2022.  The spread between 5-year nominal and inflation-adjust yields, a reasonable measure expected inflation over the period, is 2.3% – not far from the Fed’s goal.

A “Soft Landing”?

Since January 2022 the Fed Funds rate increased from 0.25% to 4.5% reflecting the Fed’s effort to dampen inflation.  The goal is to do this without a significant economic slowdown that often accompanies interest rate hikes.  Markets are forward looking.  While surprises could be lurking, generally market signals anticipate a “soft landing” – stocks are up, bond yields look reasonable, and labor markets are robust for now.

Signals from stock markets are positive.  Last quarter and this month stock returns are up with relatively low volatility.  While these markets can change quickly, current prices do not reflect a significant downturn.

Bond market signals are mixed. Current bond yields are constant at 4.7% over the next year but decline to 3.7% at five years. This downward shape of the Yield Curve can be a predictor of recessions as it suggests a future need for the Fed to reduce interest rates to spur growth.  Yet, expected future interest rates (roughly 3%) implied by today’s pattern of yields do not anticipate a need for massive changes in monetary policy.

Current signals from the labor market are positive.  Unemployment levels and rates are about where they were prior to the Pandemic and much anecdotal evidence suggests difficulty in hiring. While the current spate of announced layoffs in large Tech companies is unsettling, labor markets do not seem poised for a sharp recession.

While there is always room for uncertainty, current signals from stock markets, bond markets and labor markets point to any future recession being reasonably mild – a “soft landing”.

2022 in the Rear View Mirror
Inflation, the Fed’s response and rising interest rates, a sharp falloff in stock and bond prices, uncertainty of a looming recession and Cryptocurrency implosion were all part of the investment landscape in 2022. Although we don’t know what’s ahead, glad this year is behind us.

Inflation and Interest Rates
Inflation and the Fed’s response dominated the investment environment. 2022 saw the inflationary effects of prior years’ stimulus payments, supply chain disruptions, war in Ukraine, and an accommodative Fed – too much money chasing too few goods. The pattern of inflation, measured by prior year changes in the CPI, is shown in the accompanying chart. Throughout the past year, the Fed worked to bring inflation in check without triggering a recession. While some would argue a little late, the Fed ratcheted up the Federal Funds Target rate continuously from 0.75% to 4.50%. While it is too early to declare victory, a quick look at its recent trajectory shows the pattern of our measure of inflation bending in the right direction.

The rising interest rates in 2022 are seen in changing Yield Curves. (Yield Curves show the pattern of returns for holding various Treasury securities to maturity. Generally short-term yields respond to monetary policy; longer-term yields reflect market expectation for future interest rates.) The upward push in yields moved bond prices and returns lower – an index of long-term bonds was down over 14% in 2022. The December 2022 curve showing an upward slope for shorter intervals, then falling off is especially noteworthy. The short run pattern is consistent with the Fed’s continued tightening. The downward slope beyond a year projects interest rates to fall. Often this shape is explained by an anticipated need for an accommodative monetary policy down the road to spur economic growth in a recessionary environment. A more optimistic reason might be an expected reduction in inflation. We’ll see.

Stocks
Although the recent quarter was positive, 2022 was a down year for stocks, reflecting emerging inflation, increasing economic uncertainty and rising interest rates. A globally diversified stock portfolio finished the year down 18% – a sharp and unsettling change from recent market trajectories.

Stock price reflects the present value of expected future cash flows – as interest rates increase present values (prices) fall. The farther away are the cash flows, the greater the impact of interest rate changes on prices. Consequently, growth stocks lagged value stocks in 2022. Domestic tech stocks were especially hard hit – an equally weighted portfolio of Apple, Microsoft, Amazon, Google and Meta (Facebook) was down nearly 40%.

Inflation and the Fed’s response produced surprises and market volatility in 2022. No doubt we are in store for surprises going forward, some may even be positive.

Cryptocurrency
The Cryptocurrency phenomenon seems to be unwinding. Bitcoin, the most popular of the lot, fell by almost 70%. The Cryptocurrency exchange, FTX, blew up. While it appears the cause of FTX is simple fraud, greed and embezzlement, it prompted a discussion of the Cryptocurrency technology and its expected role going forward. There are two technologies involved – Cryptocurrency as money and “blockchain” to keep track of transactions. It is hard to imagine Bitcoin, or any other Cryptocurrency as money. After 14 years, Bitcoin is nowhere near a meaningful medium of exchange. Its volatility precludes Cryptocurrency as a store of value or unit of account. Blockchain technology was developed to keep track of Cryptocurrency transactions and holdings. While blockchain technology may eventually prove to be useful in certain roles, keeping track of Cryptocurrencies will not be one.

MARKET COMMENTARY

Stocks

After this week’s ups and downs, stocks ended November up nicely – international and emerging market stocks leading the way earning 11% and 15%, respectively. While not as robust, domestic large cap markets were up 6% and small-company markets returned 2%. These results bring the quarter-to-date returns to 14% for domestic markets, 17% for developed international markets and 11% for emerging markets – a welcome improvement over the first three quarters and consistent with a generally improving economic outlook.

Value markets – both domestic and international – are trading at premiums to broad markets. Year-to-date, the value premium in domestic markets was nearly 12%, in international markets just under 8%. Prices of value stocks reflect earnings from assets in place and less from future investments. These stocks are generally identified by relatively low price earning ratios. Because earnings are not as far off, increasing interest rates have a smaller impact on prices of value stocks and help to explain recent premiums.

Stock prices reflect the future, which is always unknown. The recent upswing is surely positive, but uncertainty remains. No doubt there will be surprises ahead.

Bonds

Yields on bonds at the short end moved up the last month, reflecting the push by the Fed to increase Federal Funds rates. Yields at the longer end were down a bit as well. Yields peak at one-year maturity and fall off to 3.8% at five years. This sharp inversion indicates lower interest rates ahead and often predicts a recession. The spread between real (inflation-adjusted) and nominal yields at both five- and ten-year maturities (about 2.3%) is consistent with the Fed’s long-term inflation objectives.

A Perspective on Inflation

Inflation can often be explained by too much money chasing too few goods. This description is consistent with the recent economic environment. One source of too much money is the massive stimulus payments made in 2021 to counteract the impact of Covid. These payments become inflationary if they exceed what is necessary to bring the economy to full capacity. The disruptions in the supply chain throughout the pandemic, and constraints in energy supplies from the invasion of Ukraine, meant too few goods. Additionally, throughout this period the Fed was especially accommodative. That inflation resulted should not be a surprise.

The landscape looks different today. Stimulus payments are beginning to work through the economy; supplies are more readily available; embargos seem to have reached a “steady-state,” and; the Fed is committed to being more restrictive. All of which should dampen inflation pressures. The bond market continues to signal benign inflation expectations. Stock markets appear to anticipate a more relaxed interest rate environment, which helps to explain recent positive stock markets.Yet, there are risks with this improving outlook: fiscal and monetary policies can overshoot the mark and either trigger a serious recession or reignite inflation; inflation becomes expected, and consequently, embedded in future transactions and self-fulfilling; and labor markets continue to tighten, driving up wages. Uncertainty remains, and it is reasonable to expect market ups and downs as this future unfolds. Yet, the current inflation and interest rate environment appears to be improving.

WHO WE ARE

Rockbridge Institutional serves the unique needs of institutions, foundations, and endowments by applying a disciplined, proven and responsible investment philosophy. We are intimately familiar with the challenges boards face as we serve on boards and finance committees ourselves.

We are committed to investment ideas that are grounded in academic research. The essence of our investment philosophy is that capital markets work in the long run; a portfolio’s risk is defined by its allocation among asset classes; and that security selection is a matter of constructing portfolios with specific expected return/risk characteristics at the lowest cost.

MARKET COMMENTARY

Stocks

Except for emerging markets, stocks were up in October. Domestic markets led the way – large cap (S&P 500) up 9%; small cap (Russell 2000) up 11%. International developed markets (EAFE Index) were up 5%, while emerging markets (MSCI Index) were off 3% due to sharply negative results in China. While uncertainty remains, October is a welcome change.

Bonds

Bond yields were up, especially at the short end. Yields at 1-year maturity are 4.5%, up 0.4%; 1- month and 3-month yields are up 1.0% and 0.8%, respectively. Yields on the 10-year are up just 0.2%-4.0%. Returns move inversely with yield changes, which explains losses in October. The Yield curve stayed inverted (1-year yields exceeding 10-year yields by 0.5%), which is often associated with a recession down the road. The spread between nominal and real yields (inflation adjusted) – a reasonable measure of the market’s expectation for future inflation – remains at 2.5% for 5-year maturities.

WHY INTERNATIONAL MARKETS?

Over the last 10 years the largest companies traded in international stock markets (EAFE) earned a real return (inflation adjusted) of just 3%, while domestic stocks (S&P 500) earned 11%. An international allocation has been a drag and raises the question of the title. Yet, if the goal is to build an efficient global portfolio – one with the best expected long-term trade-off of risk and expected return – then international stocks belong.

To begin to look at international stocks, we need measures of how markets are expected to behave. Unfortunately, neither we nor anyone else can reliably predict future markets – the best we can do is come up with a reasonable description that includes not only an expected payoff, but also a range of possible outcomes. Past market behavior provides a clue. Over the past 42 years there are 168 rolling 10-year periods. While I think recent periods distort the picture, and making no adjustments, the average 10-year returns are 7%; the standard deviation is 3%. This picture provides context for the most recent 10 years in international markets. If these statistics describe what we can expect from international markets, then the most recent 10 years is rare (5% probability).

Individual markets don’t all act together – when one is up, the other is apt to be down, and vice versa (e.g., over the same period domestic market returns were well above long-term averages). Because of this lack of perfect correlation, combining market results in the same expected return but with less volatility, the optimum portfolio will include an allocation to international markets, the recent past notwithstanding.

Unfortunately, the benefits of diversification are not always apparent. However, some comfort can be found in the idea of “regression to the mean.” This idea suggests that after a below-average period, to realize the average, future returns must be above the average and justifies sticking to an established strategy in the face of below-average results.

Investing risky assets is hard. It is a long-term process throughout which there will be a lot of short-term volatility. Success requires commitment and patience.

WHO WE ARE

Rockbridge Institutional serves the unique needs of institutions, foundations, and endowments by applying a disciplined, proven and responsible investment philosophy. We are intimately familiar with challenges boards face as we serve on boards and finance committees ourselves.

We are committed to investment ideas that are grounded in academic research. The essence of our investment philosophy is that capital markets work in the long run; a portfolio’s risk is defined by its allocation among asset classes; and that security selection is a matter of constructing portfolios with specific expected return/risk characteristics at the lowest cost.