It’s safe to say that both, market prices and investor confidence have taken a hit since the start of the year. Heading into 2022, we had experienced three years of S&P 500 performance averaging over 20% annually- not to mention this was all while dealing with a global pandemic. Since then, the S&P 500 has given back over 20% year-to-date, which has a lot of investors feeling uncomfortable. In times of uncertainty, it’s important to consider similar times of the past, as history tends to repeat itself in the market.

Shown below is a graph that shows consumer sentiment relative to the subsequent 12-month return of the S&P 500:

Through the last 50 years of S&P 500 return data, we can see that the times following sentiment troughs are some of the best times for market returns. Rockbridge remains committed to our disciplined investment approach because history has shown that those who are able to stay the course when things are uncomfortable will be rewarded in the long-term.

If you ask 100 different financial “experts” about future stock market performance, you’ll get 100 different opinions. Most will be wrong, but some, by sheer luck, will be correct (luck is often confused for skill). Investors often rely on expert opinions on what to do with their investments, especially in volatile markets like we are enduring today. Historical predictions prove that well known financial experts don’t know much more than you do:

1) August 1979, Business Week, “The Death of Equities”. This is one of the most infamous articles ever written about the stock market. Over 40 years ago this story was written about how inflation was destroying the stock market. An excerpt from the article stated “For better or worse, the US economy has to regard the death of equities as a near-permanent condition-reversible someday, but not soon.” As we all know, equities survived and appreciated 8,000% over the next four decades.

2) September 1998, Fortune Magazine, “The Crash of 98: Can the U.S Economy Hold Up?” Columnist Joseph Nocera said, “This time it is different. This time the market won’t be so quick to bounce back. Who can look at the world and not conclude that things have changed dramatically?” As we now know, this column did not age well for Nocera. To quote the famous John Templeton, the four most dangerous words in investing are “This time it’s different.”

3) January 1987, Ravi Batra book titled “The Great Depression of 1990”. You can probably guess what the book was about just from the title, and of course, the US stock market averaged an 18% annualized rate of return during the 1990’s. Pretty good for an economic depression!

It’s important to remember that pessimism is poison. New uncertainties pop up regularly, and markets have dealt with these uncertainties quite well despite what you read. If you let fear drive investment decisions you’ll likely end up burying your money in your backyard (which isn’t a sound investment strategy!). The best course of action is to develop an investment plan and stick to that plan persistently. Most importantly, focus your time and energy on factors you can control; how much risk to take with your investments, what mix of investments, and how much the investments cost to name a few.

The most commonly accepted definition of a bear market is a 20% decline in value from the last market high. The S&P 500 has crept into bear market territory on and off so far in 2022, and it’s impossible to know for certain when things are going to turn around. However, when dealing with times that may feel uncomfortable in the stock market, it’s important to think about what we do know:

Bear Markets come and go quickly

From 1926-2021, the S&P 500 has experienced 17 bear markets. The average duration of each bear market was roughly 10 months. For long-term investors of all ages and stages of life- 10 months is a relatively short period of time in the grand scheme of things, and you are rewarded for staying invested during periods of uncertainty. Over the same period (1926-2021), the S&P 500 had an annualized return of ~10.5%.

Markets bounce back strong

An example we can all remember- the bear market that came with the start of the pandemic had a drop of over 20% by mid-March of 2020. Those who stayed the course for the remainder of the year saw their full account balances come back and continue to rally another ~20% by the end of the year.

This is not an uncommon trend. From 1926-2021, the average 1-year return following a 20% market decline was ~22%, the 3-year following cumulative return was ~41%, and 5-year following cumulative return was ~72%. The graph below shows strong returns following 10% & 30% drops as well:

Conclusion

Bear markets are a part of being a market participant, and the only way you can hurt yourself in the long run is by making an emotional decision. At Rockbridge, we are advising all clients to stay the course, as we always have, and will continue to stick to our disciplined approach.

If you are still feeling uncomfortable or uncertain with your financial plan, schedule a time to chat with a Rockbridge advisor today!

There’s been a lot of talk about recessions lately: Whether one is near, far, or perhaps already here. Whether we can or should try to avoid it. What it even means to be in a recession, and how it’s related to current market turmoil.

To put market and recessionary concerns in perspective, it might help to describe six ways a recession resembles a bad mood. There are some intriguing similarities!

1. There Is No Precise Definition.
We all know what a bad mood feels like. But there is no clear definition for a nebulous mix of real and perceived setbacks, and how they’re going to affect us.

Likewise, there is no single signal to tell us exactly when a recession is underway or when it’s over. Instead, recessions can trigger, and/or be triggered by a number of conditions connected in various fashions and to varying degrees. These usually include a declining Gross Domestic Product (GDP), along with rising unemployment, sinking consumer confidence, gloomy retail forecasts, disappointing corporate balance sheets, a bond yield curve inversion, stock market declines, and similar combinations of objective and subjective events.

In the U.S., the National Bureau of Economic Research (NBER) defines a recession as follows (emphasis ours):

“A recession is a significant decline in economic activity that is spread across the economy and that lasts for more than a few months.”

Rather vague, isn’t it? That’s intentionally done. Similarly, the World Bank Group has stated, “Despite the interest in global recessions, the term does not have a widely accepted definition.”

2. You Usually Can’t Spot One Except in Hindsight.
How do you know when you’re in a bad mood? Often, you don’t, until you’re looking back at it.

Recessions are similar. Since a widespread downturn must linger for a while before it even qualifies as a recession, the NBER only declares one after it’s underway. For example, in July 2020, the NBER announced we’d been in a recession for two months between February–April 2020. This was triggered, of course, by the abrupt arrival of the global pandemic. It was the shortest U.S. recession to date, and already over by the time we officially acknowledged it.

3. Sometimes, We Get Stuck for a While.
Hopefully, your bad moods come and go, resulting in more good times than bad. But sometimes, one misfortune feeds another until you feel gridlocked. It may take a while before improved conditions, a more upbeat attitude, or a blend of both help you move forward.

In similar fashion, recessions can become a self-fulfilling prophecy. As Nobel Laureate and Yale economist Robert Shiller describes, “The fear can lead to the actuality,” in which (for example) economic conditions might feed inflation, which inverts the bond yield curve, which signals a recession, which shakes corporate and consumer confidence, which leads to unfortunate reactions that further aggravate the challenges. And so on. When this occurs, a recession and its related financial fallout may last longer than the underlying economics alone might suggest.

4. They’re Inevitable.
It’s never fun to be in a bad mood, but we can all agree they’re part of life. It would be unhealthy, exhausting even, if we were endlessly giddy every minute of every day.

Similarly, nobody celebrates a recession. But it helps to recognize they aren’t aberrations; they are part of natural economic cycles. And while they may not be anyone’s favorite tool for the job, they can sometimes help rein in runaway spending, earning, and pricing for companies, consumers, and creditors alike.

For example, in our current climate, we may enter into a recession (or already be in one) as a byproduct of the interest rate increases, aimed at warding off rising inflation, amidst the backdrop of lingering COVID-19 supply side issues and global economic sanctions against Russia. If we can avoid a recession, all the better. But if it’s going to take a modest one to reduce inflation, it may be the preferred, if challenging choice at this time.

5. Experience Helps.
When we’re youngsters, we have little perspective to help us realize we won’t be miserable forever just because we’re unhappy in the moment. No wonder we give it our all, every time. As we mature, we learn to temper our moods, and/or seek support if we do get stuck in a rut.

The same can be said about recessions, and similar challenges. It’s been more than a decade since the Great Recession; and more than 40 years since the U.S. last experienced steep inflation. As such, many investors have had little first-hand experience managing such turbulent times.

It may help to acknowledge we’ve been here before. While commenting on the most recent two-month recession in 2020, “A Wealth of Common Sense” blogger Ben Carlson lists nearly three dozen distinct U.S. recessions dating back to the 1850s, with an average length of 17 months. Some were considerably longer. We endured a series of years-long recessions during the era of the Civil War in the mid- to late-1800s. Then there was the Great Depression from 1929–1939.

It also helps to remember: Every recession has eventually ended, with economies and markets thriving thereafter. As Dimensional Fund Advisors shows us, one-, three- and five-year average cumulative returns after significant U.S. stock market declines dating back to July 1926 have all been positive, rewarding investors who placed their faith in future expected returns. Since markets are ultimately driven by the underlying growth in global commerce, we can expect similar aggregate performance moving forward in domestic and international markets alike.

Consider these words of wisdom from one of the most experienced investors of all, Warren Buffett, in his 2012 Berkshire Hathaway shareholders letter (emphasis ours):

“Periodic setbacks will occur, yes, but investors and [business] managers are in a game that is heavily stacked in their favor. … Since the basic game is so favorable, Charlie [Munger] and I believe it’s a terrible mistake to try to dance in and out of it based upon the turn of tarot cards, the predictions of ‘experts,’ or the ebb and flow of business activity. The risks of being out of the game are huge compared to the risks of being in it.”

6. You Can’t Change Others, But You Can Change Yourself.
When you’re in a funk, it doesn’t matter whether it’s due to one or many unfortunate events, or “just because.” There’s ultimately only one person who can change your mood: yourself.

The same is true for your response to recessions, bear markets, and other external events standing between you and your financial wellbeing. Life is filled with causes and effects over which we have no control, especially with respect to our investments. And yet, there are many small, but mighty acts we can take to contribute to the positive outcomes we wish to see in our homes, our nation, and the world. We can manage our household budgets. We can show up for work (or perhaps volunteer in retirement). We can be loving family members, engaged citizens, and generous donors to the causes we hold dear.

And, we can invest wisely. This means taking charge of your personal wealth by focusing on the drivers you can control, and ignoring the greater forces you can’t. For example:

• We can’t avoid recessions. But we can channel our inner Warren Buffett to look past today’s risks, and retain an appropriate amount of market exposure in pursuit of our long-term financial goals.
• We can’t avoid bear markets. But we can avoid generating unnecessary losses by panicking and selling low in the middle of one.
• We can’t avoid inflation. But we can establish a thoughtful budget to track our income and spending, with a plan in place for making adjustments as warranted.

Last and hardly least: It’s very hard to change the world. But you can always change yourself. Sometimes all it takes is a shift in sentiment to seize your next best move. As always, we’re available to assist with that in any way we can. How can we be of service to you and your family? Don’t hesitate to be in touch.

Recent headlines have been dramatic as “Inflation Soars to Highest level in 40 Years!” and “Stocks Plunge to 2022 Lows!” It sounds like the authors are all shouting, and we should really panic. It feels like we should “do something” but let’s take a step back from the headlines, and put today’s market in perspective first.


1. Stocks are in bear market territory if we use the standard definition of a 20% drop from market peak. In fact, the large cap growth sector tracked by Morningstar is down over 40% so far this year. On the other hand, the S&P 500 first reached current levels at the end of 2020, a mere 18 months ago, when the headlines said “S&P 500 Reaches New All-time Record High!” Again, these were delivered with shouting and exclamation points, inducing panic for Fear of Missing Out (FOMO) as people were bidding up the prices of Tesla, and Peloton, and crypto currency. As of May 16, the index is back to where it was 18 months ago, but the emotion is to bail out before it drops lower. Stock markets are volatile, we should expect these kinds of swings from time to time, and trying to predict them with any consistency is a fool’s errand.


2. Total Bond Market funds are now down about 11.5% year to date. This is explained by the dramatic and unexpected increase in interest rates, which are now about 2% higher than at the beginning of the year. The $1.00 you had invested at the beginning of the year was earning 1.25% per year. It is now worth $0.88 and earning 3.25%. The average maturity of the fund (measured by duration) is over six years. It is not surprising that earning 2% more over six years would earn back the 12% lost, and you would be back where you expected to be at the beginning of the year.


3. The odd sort of silver lining here is that the change in interest rates is primarily due to an increase in expected real returns, and not just due to higher inflation. In fact, despite recent record levels of inflation, the expectation for average inflation over the next five years is about the same as it was in January, so the expectation for higher fixed income returns is “real”. This signals a return to a more normal situation where long term savers earn something greater than inflation, which was not the case through much of the pandemic recovery period.


4. Things could get worse before they get better. In hindsight it is easy to agree with the people who said the economy was over-stimulated during pandemic recovery. It has led to record low unemployment, and resolved the Fed’s inability to push inflation above 2%. Unfortunately it is now WAY above 2%. Jerome Powell, Chair of the Federal Reserve is the person responsible for finding that just right balance between full employment and stable prices. Unfortunately, his tools are limited. “We don’t have precision surgical tools. We have essentially interest rates, the balance sheet and forward guidance and they’re … famously blunt tools,” Powell said at a recent press conference. It is quite possible that monetary policy pushes the economy into a recession in an effort to bring down inflation.


5. This is a good time to assess your risk tolerance. It is easy to take risk when it feels like markets only go up. We are now preparing to grit our teeth and rebalance by selling some fixed income securities and buying more stock. If that feels really scary, we should have a conversation about your investment time horizon, and appropriate risk tolerance.


In summary, it is a good time to ignore the headlines, reassess your investment horizon and appropriate risk tolerance, and continue to expect positive long-term returns for taking diversified investment risk.

Stock and bond markets alike are sorting their way through a potent brew of uncertainties these days. War, inflation, supply constraints, rising interest rates, growth concerns, and even crypto-currency dislocations are combining to drive markets lower by the day.

It’s certainly no fun to sit through tumultuous markets, but turmoil like we’ve seen recently is normal from time to time; our expectations for what markets deliver to investors is built on long-term global market history that includes many instances of such turmoil. We derive asset allocations from this long history that match up with your plans, goals, mission, and tolerance. So, if nothing has changed for you in the long term, then your portfolio shouldn’t change in the short term.

It sure would feel good to do something, though. The decades-long market experience and data that we use to build expectations for the future, however, also show that there are no signals for times to exit and re-enter markets. So, as much as it feels like doing nothing is incurring more pain than necessary, history shows us clearly that there is more pain associated with trying to time market actions.

Days, weeks, or even months like this are a recognition that being invested to generate returns over the long run means enduring volatility in the short run. It is the cost of being invested.

That’s a very long way of saying “do nothing”. But that still remains the best way to sum up the best possible response to markets like this one.

Has the specter of inflation got you spooked? Recent headlines are filled with sightings. In this two-part series, let’s take a closer look at what to make of all the commentary, and what you can do about it as an investor. First and foremost, we caution against succumbing to fear or panic in the face of inflation. As usual, careful planning remains your best guide.

What Is Inflation?

Inflation is the rate at which a currency loses its purchasing power as prices increase over time. So, say a cup of coffee cost $1.00 twenty years ago. If the average annual inflation rate had been 2% between then and now, that same pour would now cost you $1.49. Various goods, services, and sectors often experience different rates of inflation at different times, but general inflation is usually calculated based on the Consumer Price Index (CPI), or a similar broad pricing index.

Recent headlines have been reporting a noticeable uptick in inflation. Superlatives like “best” and “worst” grab the most attention, so outlets have been abuzz with reports of how a 5% May consumer pricing surge was “the biggest 12-month inflation spike since 2008.”

Putting Inflation in Proper Context

Before you read too much into these recently rising numbers, it’s worth remembering their context. We’re comparing May 2021 to May 2020, when we were still deep into what The Wall Street Journal called a “screwy” pandemic economy. The WSJ explained, “If a company takes a hit in one year and then gets back to normal the next, it can look like its profits are soaring when in fact they are just getting back on track.”

Zooming out even further, the Federal Reserve’s 10 Year Break-Even Inflation Rate is one common estimate of the market’s expected average annual inflation rate for the next 10 years. As of mid-June, that rate stood at 2.3%. That’s up from the lower 1.2% rate expectation from mid-June 2020, but it’s still not eye-popping.

Which leads to another important point: Not all inflation is bad. In fact, a bit of inflation goes hand in hand with economic growth and reasonable interest rates for lenders and borrowers alike. A 2% annual inflation rate is typically considered a desirable norm for greasing the wheels of commerce, without destroying the working relationship between currencies and costs.

What if Inflation Runs Amok?

And yet, while inflation has its purposes, it’s concerning if it goes on a rampage. When it does, uncertainty has spiked as well, wreaking havoc on commerce, the economy, job markets, real estate, and financial markets. (Deflation—the opposite of inflation—can also upset the economy if prices drop too precipitously.)

Investors who were around in the 1970s may remember the last time the U.S. experienced red-hot inflation, and what it felt like when it spiked to a feverish 14.8% in 1980.

The New York Times described it as an era when “prices of real assets like houses, gold and oil soared. Average mortgage rates exceeded 17 percent, and interest rates on bank certificates of deposit approached 12 percent. It was hard to know whether a 5 percent pay raise was cause for celebration or despair.” While 12% CD rates may sound great, when interest and inflation rates are comparable, the real returns from even high-interest CDs essentially become a wash.

After the 1980 high-water mark, the Volcker-era Federal Reserve tamped inflation back down. So younger investors have heard of, but never experienced such steep inflation for such an extended time. Despite occasional alarm bells, inflation has mostly continued to hit the snooze button for decades. At least so far.

Next Up: What Can You Do About It?

What if inflation does get out of hand, and stays that way for a while? Depending on who you heed, the possibility ranges from unexpected, to possible, to a near certainty. In our next piece, we’ll cover why forecasts remain as fuzzy as ever, and how investors can best prepare for whatever may happen next. As usual, prudent planning is preferred over rash reaction.

With the general election approaching, many investors are worried about heightened volatility in the stock market. We have had several people reach out with three types of concerns: concern around an election without a clear winner (or a candidate not admitting defeat), concern around an election result different than their preference, and concern around general volatility.

This election is unique, but so is every election. That’s what makes it “news” and news moves markets. While the news is always different, the way markets react to news is fairly steady over time. In this piece, we analyzed market behavior in the 30-day period around each election over the last 96 years.

Starting 15 days before the election (a Monday in late October) and ending 15 days after the election (Wednesday in November) we looked at returns of the S&P 500 and the standard deviation of daily moves during that time.

In the 23 elections listed above, the average return over the month is 0.72%, which is slightly behind the 0.83% we’ve seen on a monthly basis over the last 95 years. The volatility (standard deviation of daily returns) during these 505 trading days was also slightly elevated, at 1.44% per day compared to an average of 1.20% (23,310 trading days since 1926).

The volatility is 20% higher, which isn’t a meaningful difference for a month. The return averages 0.11% less but is still rather positive and the difference is far from being statistically significant.

That message probably won’t allay the fears of those who feel this particular election is too unique to be captured by historical data. Still, it should provide a degree of comfort that returns around elections have historically been positive and close to average market returns.

Two things are worth remembering. First, markets move on events that differ from expectations. The stock market didn’t drop in 1984 because Reagan was reelected or in 2008 because Obama was elected, both of those outcomes were expected. The market dropped for other reasons. Second, a company is worth the present value of all future profits. Perhaps the market will be volatile around this election, but for stocks to drop, and stay down, the market must decide expected future corporate profits are worth less.

At Rockbridge, we believe the best course is to stay invested through the election, we are recommending that to all clients and doing it with our own investments. However, if you can’t sleep at night you should reach out and have a conversation with your advisor.

Departing thoughts: I recently overheard someone intending to get out of the market now and buy back in at a lower price. They said they were hoping to “make” a little money from the trade. They should have said “win” a little money. Timing the market is a zero-sum game, and a game of chance, it’s not earned money and if the market doesn’t behave as desired money will be lost.

Many of our clients have been asking why the stock market has recovered so much in the last two months while the economy is shrinking, and unemployment is hitting record highs. Implied in the question is whether the stock market is “overvalued” and will drop in the near future. The stock market may drop in the future because of new information and events that have yet to happen, no different than any other day. Here we will try to put the market’s actions into perspective and provide an explanation for current share price.

The best way to look at market valuation is through fundamentals. The price of a stock, or the market as a whole, is the value of all future earnings, from now until the end of time, discounted back to today. If you’re retired and think “But I don’t have forever”, worry not because the market does and that’s what prices stocks.

Our valuation equation consists of earnings (numerator) divided by a discount rate (denominator). Earnings will be less this year, though the degree of the drop and its longer-term impact are open to debate. According to FactSet Market Aggregates, analysts are expecting a 22% decline in earnings for 2020 (still positive just smaller than 2019), with 2021 reverting to just shy of what 2020 was supposed to be. If this were to hold, and using a 12/31/2019 valuation baseline, the S&P 500 should be around 3,000 – a 2.7% discount from where it stands today. A larger decrease in earnings or a prolonged reduction in earnings growth would harm stocks further.

Earnings are only half the equation. Even a slight change to the discount rate can meaningfully alter equity valuations. Were the discount rate to drop from 8.2% to 7.7% equities would increase 9.1% in value. The most indisputable thing affecting discount rates at the moment is the drop in inflation expectations and bond yields. If inflation is lower and you’re getting a lower return from a safe investment like a treasury bond, it stands to reason the market will demand a lower return from the stock market, meaning a lower discount rate and higher stock prices.

Many think of stock market returns as an “equity risk premium” or the extra return you get by bearing the extra risk associated with the stock market. Since 1926, the S&P 500 has returned an annualized 7.3% more than inflation and 5.1% more than five-year treasury notes. At the start of the year, the 5-year treasury note was yielding 1.67%, which was about the same as 5-year inflation expectations. Now the five-year note is at 0.33% and five-year inflation expectations are 1.06%. If real bond returns are lower, you’d expect real stock returns to be lower which is manifested through a lower discount rate and higher valuations.

Some argue the market’s increased volatility should mean a higher discount and lower stock prices. This argument has merit and may be partially responsible for lower equity prices. However, others argue the recent fiscal policy of the legislature and monetary policy of the federal reserve has been faster and more accommodating than previously expected. With the government quick to intervene to protect corporate profits and prevent bankruptcies perhaps stocks are less risky than previously thought and the discount rate again should be lower.

Things that decrease future risk, lead to a lower discount rate, and lower expected returns.

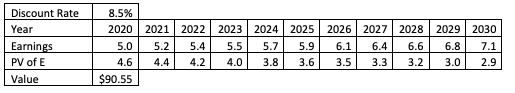
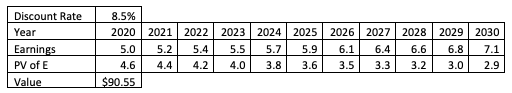
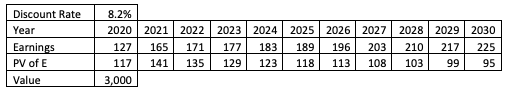
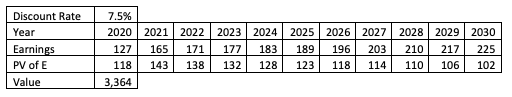
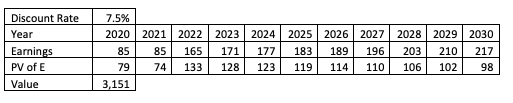
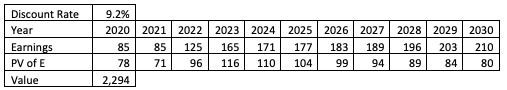
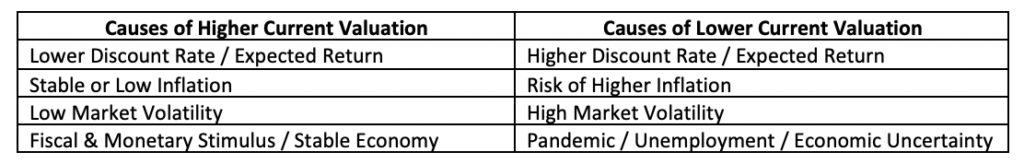
In the appendix of this article we run through several scenarios adjusting corporate earnings and discount rates to assess their impact on S&P 500 fair value.  Some interesting observations:

  • At the end of 2019, the price of the S&P 500 Index, projected earnings (analyst expectations in the near term and historical real growth in the long-term), implied a discount rate/expected return of 8.2% over a 50-year window.
  • A temporary reduction in earnings, and a slight decrease in the discount rate can explain current market valuations.

No one knows what the market will do in the coming months, but it’s wrong to think the market must go down. Things like future earnings and discount rates are impossible to know and subjective to each persons’ point of view, but it is not difficult to get to current equity values under reasonable assumptions. The following are key takeaways:

  1. Markets are forward-looking and move when events transpire differently than expected.
  2. Earnings drive prices but one bad year will not make an enormous impact as long as future years return get back close to expectations.
  3. The rate at which future earnings are discounted is very important. A lowering of the discount rate will cause market prices to increase substantially and there is good reason to believe the market’s discount rate is lower today than it was six months ago.

Appendix

Key Terms

Discount Rate: The interest rate used to calculate the present value of cash flows in the future.

Earnings: Corporate earnings, either of a single stock or a weighted earnings of a whole index. For all examples below, we assumed a long-term growth rate of 3.5% which represents the 2% real earnings growth rate we’ve seen over the last 140 years, plus the 1.5% current long-term inflation expectation.

PV of E: The present value of earnings are the future earnings that have been discounted back to today’s dollars by the discount rate.

Value: This is the sum of the “Present Value of Earnings.”

The following table shows the value of a fictitious stock that will earn $5 next year, those earnings will grow 3.5% a year, and the discount rate applied to the stock is 8.5%.


If you sum the “PV of E” (present value of earnings) for the next 50 years you get $90.55. We cut the chart after 11 years to make it fit on one page. The most sensitive variable is how much larger the discount rate is than the growth rate. In this case it was 5%. If we lowered that to 3% (say a 4.5% growth and a 7.5% discount rate) the value jumps to $126/share. If we widen it to 7% it drops to $69/share. What makes valuing stocks difficult is that no one knows future growth, or the market assigned discount rate. A critical thing to note, the discount rate is the expected return.

We can put this formula to practice with the S&P 500 looking back to the end of 2019. At the time, the S&P 500 was trading at 3,231 with expected 2020 earnings of 170.


Using the same method of summing the next 50 years, we get an index value of 3,231 (the index’s close on 12/31/2019) from a discount rate of 8.2%.

With this premise in place, we can explore different scenarios. First let’s look at the consensus estimates by Wall Street analysts. They are forecasting the S&P 500 to make 127/share in 2020, with 2021 being close to 2020’s original forecast or 165/share in earnings.


Were that to happen we should see an S&P 500 valuation of about 3,000 or 1.7% below today’s prices. This is assuming no change in the discount rate. This may be what the market is expecting and how it’s currently priced.

But what if the effects of the Coronavirus are substantially greater than the market is expecting. The following scenario assumes earnings are 50% below expectations in 2020, stay at the same level in 2021, and then revert to expectations in 2022 and beyond.


We now get a fair value that is 8.2% below where the market is currently trading. To get a market valuation down in the 2,300s like we saw near the bottom  in March, earnings would have to come in substantially below expectations and would need to have a lasting impact through the rest of the decade, and likely we’d need an increase in the discount rate (we revisit this later).

The prior scenarios are all assuming a change in earnings but not a change in the discount rate. If the discount rate is altered, even slightly, then equity valuations would be meaningfully changed.

If earnings forecast came in on top of expectations, but the discount rate was lowered by 0.70% to match the decrease in the real yield of treasury bonds, we’d actually see a valuation near the record highs we saw in February.


The next table incorporates a more severe earnings decrease combined with a reduction of the discount rate. The result is an equity valuation about 3.2% above what we see today.


If you’re pining for an equity valuation around the lows we saw at the end of March, the following table is one way to get you there.


We’d need very depressed (50%) earnings for the next two years, followed by a year that gets us halfway back to what analysts are currently expecting for 2021. Furthermore, the discount rate would have to increase to 9.2% which would happen if investors became more nervous because of stock market volatility or if inflation were to increase substantially over expectations.

It is important to remember the relationship between discount rates, valuation, and expected returns. Most people’s Intuition would say to root for a lower discount rate in order to increase equity valuations. However, a lower discount rate means lower expected returns in the future. On the flip side, a larger discount rate would cause the market to drop, but you’d be compensated in the long run by greater expected returns going forward. For the market to do well in the long-run companies need to create wealth and make money.

Rebalancing the allocation among risky assets in your investment portfolio is an important discipline.  It provides a structured way to maintain consistent risk exposure over time and forces us to “buy low and sell high” when it is not always the comfortable thing to do.  This quarter is a good example, in the midst of crashing stock prices, and record volatility in markets, we have been selling bonds to buy stocks in our portfolios.  Buying stocks during all this uncertainty can feel uncomfortable if not downright frightening, but here are a couple of things to keep in mind.

Cash never “goes to the sidelines.”  If you listen to the talking heads of financial news-media, it can sound like all investors are reducing their exposure to stocks, and hoarding cash to buy back in when prices are lower.  But that’s not the way markets work!  Whenever a share of stock is sold, another investor buys it.  When there are more sellers than buyers, prices fall to clear the market.  Warren Buffet’s famous saying bears repeating now, “Be fearful when others are greedy, and be greedy only when others are fearful.”  Another famous quote strikes a chord as well, “In bear markets, stocks return to their rightful owners.”  Long-term investors want to be the owners of stocks and down markets are an opportune time to buy.

When stock prices drop, expected returns increase.  It may at first seem counterintuitive, but the math is fairly straightforward.  The value of a stock, or any other asset, can be described as the discounted present value of all future cash flows.  There are two factors that influence the value of a stock:  future cash flows and the discount rate.  When cash flows become more uncertain, we apply a higher discount rate.  Logically, a rational investor would pay less for an uncertain stream of cash flows than a stream with greater certainty.  The discount rate is a reflection of expected returns.  When risk and uncertainty increase, investors demand a higher expected return.  Over the past two months many stocks have decreased in value by 30% or more.  Some of the decrease in value is driven by an expectation of lost revenue and profits (future cash flows) resulting from Coronavirus’ shutdown of the global economy.  However, some of the decline is due to fear and uncertainty, which translates to a higher discount rate.  Both of which have a negative impact on stock valuations.  In turn, buying stocks at today’s prices comes with the expectation of higher rates as compared to two months ago.

Rebalancing is a valuable and important discipline.  If you still have questions about rebalancing, or worry about the appropriateness of your target allocation, talk to your advisor.

Stock Markets

The damage to stocks from the Coronavirus pandemic is shown in the chart below as all markets are down dramatically. The domestic large cap stock market (S&P 500), driven by the largest tech companies, held up a little better.  Except for this market, this quarter’s falloff brought the five-year returns to essentially breakeven and we must look to the ten-year numbers for returns that generally compensate for risk.

We are in uncharted territory and will be for a while.  It’s not the usual economic “slowdown”, but a “shutdown”.  Ben Bernanke, Fed Chairman during the 2008 financial crisis, likens to a natural disaster not a depression. Markets are clearly discounting the massive uncertainty of the trajectory of the Coronavirus pandemic, the global economic impact and government’s response.

It is reasonably clear that this health crisis and our response will alter the future economic landscape. There will be ups and downs as we move from where we are to where we are going. Today’s prices reflect current information about what is known and what is unknown about this journey. The expected return implied by these prices is not only positive but is apt to be better than what we have seen in the past to compensate for the greater risk in this period of heightened uncertainty. There is no reason to conclude this expected return won’t be realized eventually. To earn these returns means to remain committed to established investment plans.

Bond Markets

A yield is what you earn by holding a bond to its maturity. It has been shown to be a reasonable proxy for the return expected.  Changes in yields drive returns – falling yields positive, rising yields negative.  The longer a bond’s maturity the greater the impact a given change will have on prices and returns.

You can see to the right how yields have dropped over the last quarter.  It’s only at maturities greater than five years when yields are better than zero.  The falloff in bond yields of over one percent since last quarter reflects the Fed’s reduction in interest rates and its announced commitment to provide liquidity during this crisis.  In addition to the activities of the Fed, yields at the longer end are consistent with a desire to avoid risk and the expectation of low rates well into the future.  We have the Fed’s playbook from the 2008 liquidity crisis to give a sense of how they will apply the various tools.

The impact of the massive stimulus package is another uncertainty. No doubt we’ll see increased deficits, which is usually accompanied by inflation.  However, inflation has been benign over the last ten years as we worked through the effects of the last recession. The same could hold true this time around, although the deficits are going to be greater. The bond markets are telling us to expect that inflation will remain in check.

Risk and Uncertainty

Uncertainty can’t be measured, but risk can as both are associated with an unknown future. The stock market, where investors buy and sell based on an uncertain future, is an example.  Using historical data, we can construct expectations and a range of outcomes, which can be used to measure stock market risk.  A pandemic is new territory and if we accept that how markets deal with uncertainty is reasonably consistent through time, then history provides some insight into describing what’s ahead.

Today it’s the uncertain trajectory of the Coronavirus.  As more data is gathered through the ongoing testing’ the uncertainty is translated into measurable risk, which is then reflected in expected outcomes and variability. While the stimulus package signals Congressional support in lessening the economic fallout, there is not much history in implementing a package of this magnitude. Be prepared for a trial and error process, and volatility.

Where are We?

It is hard to imagine what we are going through won’t have a lasting social and economic impact.  The level of expected unemployment claims and government spending is new territory. The highest priority right now is to reduce the uncertainty of the health crisis. It will take time to expand the testing to better understand this pandemic and for “social distancing” to begin to work.  In the meantime, commitment and perseverance is our immediate future.

Markets look to the future, which is significantly murkier than a month ago.  It may be a while before the future looks much clearer.  While especially difficult in the face of today’s falloff, the time-worn prescription for investing in these times continues to be apt – maintain established commitments, endure the volatility in the near term and expect positive returns for bearing these risks over the long term.