Ready to get started?
If you’re ready to start planning for a brighter financial future, Rockbridge is ready with the advice you need to achieve your goals.
October 5, 2022
Market Volatility
It’s safe to say that both, market prices and investor confidence have taken a hit since the start of the year. Heading into 2022, we had experienced three years of S&P 500 performance averaging over 20% annually- not to mention this was all while dealing with a global pandemic. Since then, the S&P 500 has given back over 20% year-to-date, which has a lot of investors feeling uncomfortable. In times of uncertainty, it’s important to consider similar times of the past, as history tends to repeat itself in the market.
Shown below is a graph that shows consumer sentiment relative to the subsequent 12-month return of the S&P 500:
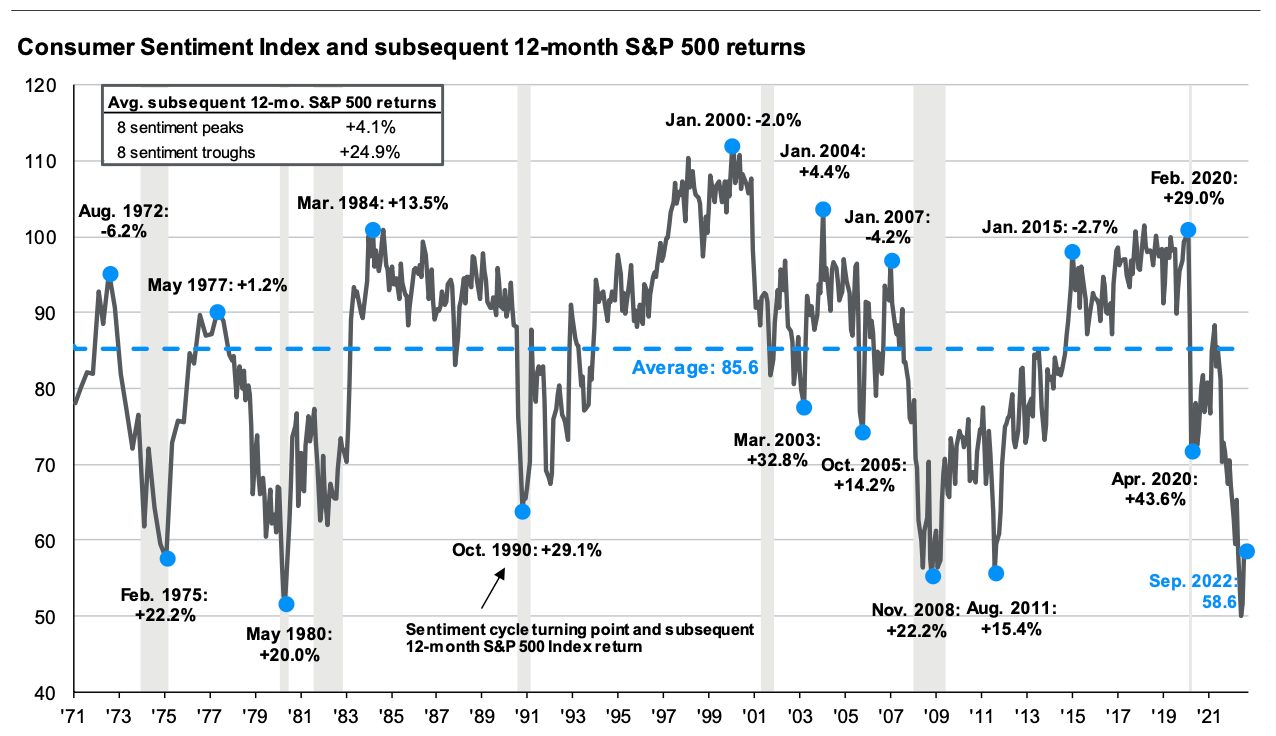
Through the last 50 years of S&P 500 return data, we can see that the times following sentiment troughs are some of the best times for market returns. Rockbridge remains committed to our disciplined investment approach because history has shown that those who are able to stay the course when things are uncomfortable will be rewarded in the long-term.
If you’re ready to start planning for a brighter financial future, Rockbridge is ready with the advice you need to achieve your goals.
