When deciding what electric vehicle to purchase, tax credit eligibility can be a big factor. All-electric, plug-in hybrid, and fuel cell electric vehicles purchased new, in 2023 or after, may be eligible for a federal tax credit. However, there are various qualifications for both the buyer and the manufacturer that must be met in order to qualify for tax credits. The tax credit applies to battery electric vehicles with an MSRP below $55,000. It also includes zero emission vans, SUVs, and trucks with an MSRP up to $80,000.

Filers’ eligibility for this tax credit depends on their Adjusted Gross Income (AGI). Eligible AGI values vary based on if the vehicle is new or used. For all new vehicles these following income guidelines must to qualify. For married couples filing jointly, AGI must not exceed $300,000. For a head of household, AGI must not exceed $225,000. For all other filers, AGI must not exceed $150,000.

The following AGI thresholds apply when purchasing a qualifying used EV.  For married couples filing jointly, AGI must not exceed $150,000. For head of household, AGI must not exceed $112,500. Finally, for all other filers, AGI must not exceed $75,000.

If you are purchasing a new car that meets all requirements AND your income is below the AGI thresholds, you are eligible for a federal income tax credit of up to $7,500. The tax credit breaks down as follows:

  • $2,500 base tax credit
  • Plus $417 for a vehicle with at least 7 kilowatt hours of battery capacity.
  • Plus $417 for each kilowatt hour of battery capacity beyond 5 kilowatt hours, up to $7,500 total.

If eligible, your tax credit will be applied to your tax owed.  It’s important to note that any unused tax credit will not rollover into the next year nor is it refundable as cash.  To take full advantage of an EV tax credit, you may want to consider adjusting your withholdings or estimated tax payments to ensure you have enough tax owed to utilize the entire credit.

Starting in 2024 there will be a new electric vehicle credit rule allowing the option to take a tax credit as a discount at the time of purchase. The tax credit would be transferred to the dealer and the price of the vehicle would decrease by the expected tax credit amount. This would allow people who qualified for the tax credit to benefit sooner rather than being forced to wait until it’s time to file tax returns.


Notes: 

  • If not all vehicle and income requirements are met, then a $3,750 tax credit may still be available if the vehicle meets either the critical minerals requirement or the battery components requirement.
  • New York residents may be eligible for a state-level rebate of up to $2,000 on top of the federal tax credit. It is important to take advantage of this opportunity and understand which vehicles qualify for tax credit in 2023.


Vehicles that qualify for the full tax credit ($7,500):

Tesla Model 3 (Performance Model included)

Tesla Model Y

Chevrolet Equinox

Chevrolet Blazer

Chevrolet Bolt

Chevrolet Silverado

Ford F-150 Lightning

Cadillac Lyriq

Volkswagen ID.4

Chrysler Pacifica PHEV

Lincoln Aviator Grand Touring PHEV

Partial Tax Credit ($3,750):

Jeep Grand Cherokee PHEV 4xe

Jeep Wrangler PHEV 4xe

Lincoln Corsair Grand Touring PHEV

Rivian R1S

Rivian R1T

Ford Mustang Mach-E

Tesla Model 3 (Single motor model)

Vehicles that no longer qualify for tax credit if put into service after April 18, 2023:

Audi Q5

BMW 330e

BMW X5 (may return to 2024 list)

Genesis GV70

Nissan Leaf

Volvo S60

Predicting Future Prices

If we could predict future prices for financial assets, then investing would present no problems. As Will Rogers tells us: “Don’t gamble; take all your savings and buy some good stock and hold it till it goes up, then sell it. If it don’t go up, don’t buy it.”  Unfortunately, it doesn’t work that way.

The observed market price, which consolidates the predictions of all participants from available information, is usually the best price. Because new information comes randomly, prices will fluctuate unpredictably – investors need confidence to make decisions using only observed market prices.

Instead of predicting the future, we can use past data to construct an average and, importantly, a range.  Using this description of the future allows us to consider investment alternatives objectively. Relying on predictions to make these decisions, while it can be comforting, rarely pays off.

Market Review

Stocks

Stocks were up this quarter and six months, helped by significant advances in a few large tech companies. The S&P 500, which is over-weighted by these stocks, was up almost 9% for the quarter.  Other market indices were up between 1% and 5%. The story is much the same for the year-to-date numbers. While over this period international developed markets (EAFE), domestic small cap stocks (Russell 2000) and emerging markets (MSCI emerging markets) were up a comfortable12%, 8% and 5%, respectively – they were well below the 15% return of the S&P 500. The equally weighted portfolio of the six largest tech stocks (Apple, Microsoft, Google, Amazon, Nivida and Facebook) was up 27% over the quarter and 83% year-to-date. Nvidia, a software company engaged in the manufacture and distribution of chips for AI (Artificial Intelligence) headquartered in Santa Clara, CA, is new to this group. It was up over 50% for the quarter, and has nearly doubled in value since the first of the year. These numbers tell us the market’s enthusiasm for AI. We’ll see whether it is misplaced.

The Consumer Price Index (CPI) is up 2.7% over the trailing twelve months, close to the Fed’s long-term objective. While the Fed has paused its drive to increase interest rates, inflation remains a concern and there are no declarations of victory, only discussions of the difficulty of interpreting the data. Regardless, we are in a better place than a year ago, which helps to explain the positive stock market.

Bonds – Yields Versus Returns

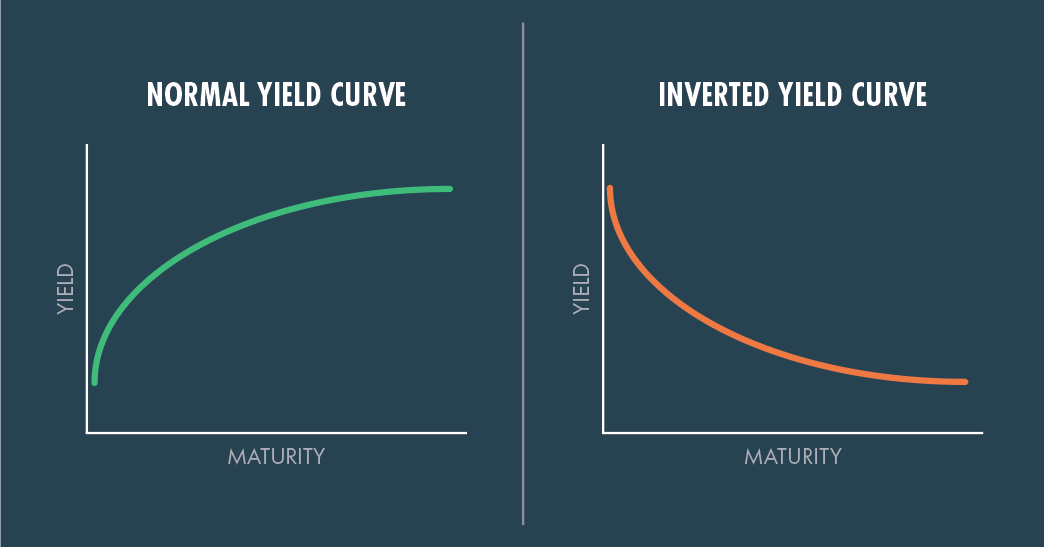
Over the June quarter, bond returns are negative, reflecting rising yields. The Yield Curve (pattern of bond yields for various maturities) shows a parallel shift upward of about 0.5%, which is consistent with the increase in the Fed’s Target Federal Funds rate. Bond prices (returns) move inversely to yields – yields up, prices down.

Today’s Yield Curve is unusual. The typical curve slopes upward, showing yields increasing with maturity.  The downward sloping curve we see today anticipates falling interest rates. We earn 5.4% annualized, investing for 3 months versus 4.3% for three years.

However, taking advantage of today’s short-term interest rates is not without risk, as proceeds from short-term bonds must be reinvested at an unknown rate at maturity. Today’s Yield Curve tells us this rate will be lower and in fact, one explanation (Expectations Hypothesis) of the observed shape of the Yield Curve is that you will end up at the same place by taking advantage of the higher short-term rates and “rolling over” the proceeds over three years as you would by earning the three-year rate. Market predictions of future yields are embedded in the observed Yield Curve.