This recent market downturn has many investors drawing parallels to how they felt during the infamous 2008 financial crisis. The last 11 years have been a roller-coaster ride for investors. Right after seeing market highs in late 2007, investors experienced a nearly 50% market decline of the S&P 500 in 2008. In the following 9 years, the S&P 500 delivered double-digit positive returns in all but two years, and then unfortunately had that barbelled with today’s most recent threat on a bear market with the S&P 500 going down 19.77% since late August. Well, to summarize, it has been a volatile ride!

So how does this 11-year ride stack up in the history of stock returns? There have been 83 trailing 11-year periods since 1926 for the S&P 500. 2008-2018 ranks in the bottom 25% for these periods when measuring performance. To make things worse, the S&P 500 was the shining star over this time period beating out the returns of U.S Small-cap, International, and Emerging Market Stocks.

Knowing this, you would assume a diversified investor (60% stocks and 40% bonds) probably didn’t fare too well over these past 11 years. They didn’t get the 6-7% return we would expect for the long run, but still managed a return of 5.14%.

When put into perspective, a 5.14% return doesn’t sound too bad given the period we just went through. Contrary, a saver who invested in 1-year CD only averaged 1.05% during the same period, losing over 1% per year to inflation. $500,000 invested in January of 2008 grew to $867,796 with the 60/40 portfolio vs $560,395 if saved in 1-year CD.

There are many takeaways here, but most important is the reminder to stay the course. Being invested in the market certainly will come with volatility at times (see at left), but it is one of the best ways to get returns that keep up with inflation and help us meet our long-term goals. We don’t expect future equity returns to be in the bottom 25% going forward. Things will turn around like they always do. As investors, the only thing we can do is make sure we are participating when that time comes.

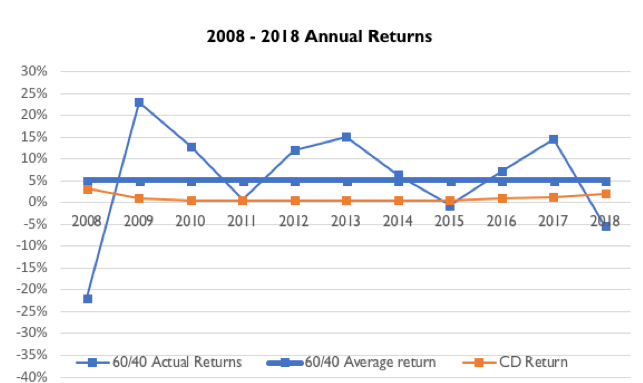
2018 was a woeful year for investing. All major stock market indexes were down, bonds enjoyed a year-end rally to finish flat, and commodities such as gold and oil fell. Seeing all asset classes drop in unison is unusual and unlikely to continue.

Stocks

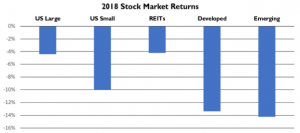
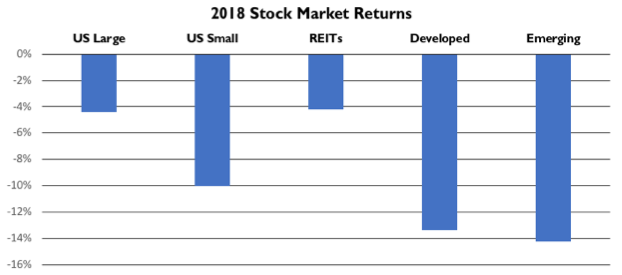
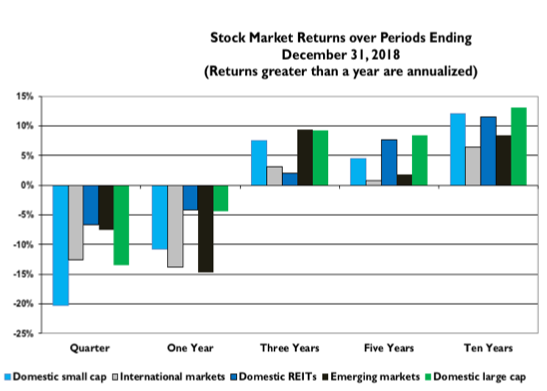
Stocks began the year on solid footing, but fortunes quickly changed as early February saw a 10% drop in equities. Markets steadied over the spring and summer, with domestic stocks reaching new highs in the early fall. And then the 4th quarter happened. All equities suffered substantial losses. In aggregate, U.S. Large Caps and REITs were the best performers of 2018, followed by U.S. Small Caps, and then International Stocks.

2018 was a poor year for International Stocks, but Emerging Markets are still the best performer over the last two years (after being up 38% in 2017). December was a reminder of why we stay diversified. While U.S Stocks were down 10%, International Developed lost 4.8% and Emerging Markets lost 2.6%. Again, we see diversification help to dampen volatility.

Bonds

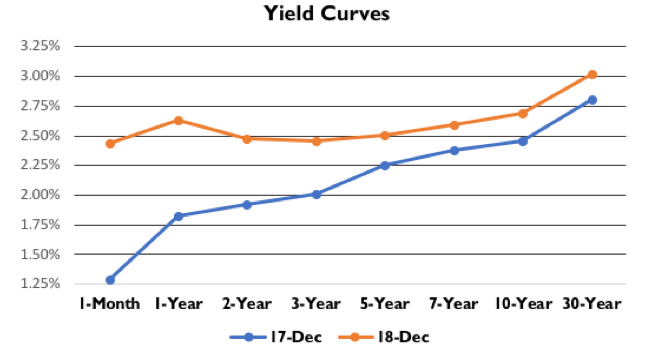
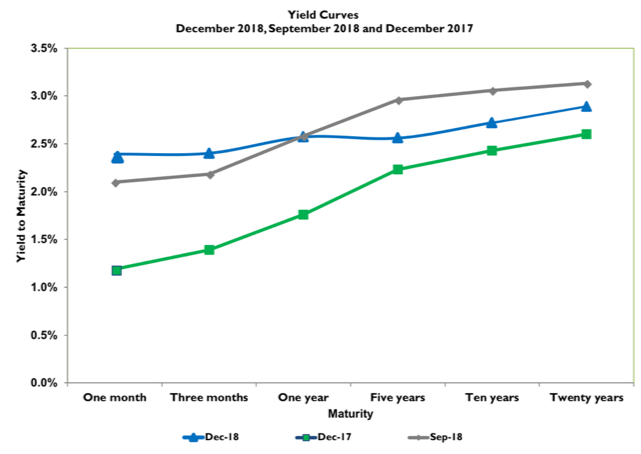
Yields rose in 2018 and the curve flattened substantially. The Federal Reserve hiked rates four times last year as they viewed a strong economy and a tightening labor market reason enough to aggressively unwind their accommodative monetary policy. The U.S. 5-Year Treasury, a good proxy for our Bond holdings, began the year with a yield of 2.25%, before selling off to reach a high of 3.09% in early November. At that point, the aggregate bond market was down 3% for the year and it looked certain we’d finish the year negative for the 4th time in the index’s 43-year history. But a 58 basis point rally in the final two months spared Bonds, allowing them to finish 2018 with a positive return of 0.01%.

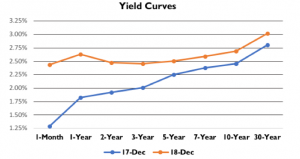
The yield curve is now the flattest it’s been in a decade. The 1-Year Treasury Bill is yielding more than the notes maturing in 2-7 years. It appears the market is pricing in one more hike in interest rates, followed by a few cuts from the Federal Reserve. These cuts could come as a result of a recession or simply because global growth slows (but doesn’t contract) and inflation softens below the Fed’s goal of 2%.

Near Bear Market

On Christmas Eve, the S&P 500 closed down 2.7%, ending a 7-day stretch where stocks lost 11.3% of their value. That selloff put us on the cusp of a “bear market” meaning a drop-in price of 20% or greater from a previous high.

The causes of the selloff are numerous. America and China are involved in a growing trade war, the Fed is raising interest rates, analysts lowered global GDP growth estimates, manufacturing activity is below expectations and our government is in a shutdown with no end in sight.

On top of that, we’ve had a record long 10-year run of strong stock market performance and economic expansion that is the second longest in history. It seems there is plenty to be fearful of. Our cognitive biases aren’t helping. Some of us may be experiencing  recency bias. In the last 30 years, the only two times the market has dropped more than 20% were because of the dot-com bubble and the financial crisis. In those instances, we saw the market sell-off 49% and 57% respectively. Being 20% off the highs investors think, “I know what happens next.” The next logical question is– shouldn’t we sell out of stocks now, wait until the market falls 50% and buy back in? But just because that’s how the last two drops have happened doesn’t mean this one will be the same. It’s possible the bottom of the market will be a 21% selloff, or 23%, or 27%, or 32%. Or it’s possible that the bottom was the 19.78% we saw on December 24th.

Some of us also suffer from negativity bias; we remember the things that ended poorly but forget instances where things turned out well. In 2011, the market was in the middle of its recovery from the financial crisis when cracks began to appear. Greece was heading towards bankruptcy and there were concerns the Eurozone would break apart. Bank of America was experiencing extreme volatility, and some feared they may be insolvent. High-profile investors such as Ray Dalio, who predicted the 2008 crash, were warning of a “double-dip” recession, pushing markets back to levels in 2008 & 2009. In the five months from May until October, the market sold off 17%. But the crash never came. Greece and the rest of the EU didn’t implode, Bank of America got a $5 billion investment from Warren Buffet, and the economy kept chugging along.

The same fear investors feel about the market today they could have felt in 2011. But we forget 2011 and remember 2008, though there is no reason to think that 2019 will be like 2008 and not 2011 (throughout history there have been a lot more 20l1’s than 2008’s).

2019 and Beyond

We do not know what the stock market will do in 2019, and neither does anyone else. Despite the pessimism in the markets and in the media, there are plenty of reasons to feel good about stocks. America’s economy is expected to grow at 2.3% and the broader world is expected to grow at 3.0%. 2018 ended with a very strong jobs report as wages and hiring continues to be robust. Perhaps most promising of all was an increase in the labor force as those who had previously not been looking for jobs re-entered the market.

Every Wall Street Bank that puts out a price target for the S&P 500 is predicting a positive year in 2019. The average earnings for the S&P 500 are expected to be $173. With a 2018 close of $2,507, that works out to a forward P/E of 14.5, which is low by historical standards meaning stocks are currently a good value. This puts equities on par with where they were at the start of 2013 – that year the market rallied 34%.

We don’t know what next year and beyond have in store for stocks, but we do know over time it pays to be invested. Investing in the market isn’t easy which is why it pays so well in the long-run. Volatility like we saw in the last quarter causes people to sell out of stocks. This is beneficial to the disciplined investor as there are fewer people with whom he or she has to share corporate profits.

The best thing a person can do is find the right mix of stocks and bonds that fits their individual needs and then stay the course. And lastly, if the market closes next year right where it started at $2,507, your return won’t be 0, you’ll have made 2.2% because companies pay dividends!

I’ve been watching people drive all my life. I’ve been an individual investor and an investment advisor guiding clients for more than half of my adult life.  I’m a curious soul and during a recent trip from Syracuse to Atlanta, I had quite a bit of time to watch and observe the behaviors of all sorts of motorists and their driving habits.  I could not help but draw comparisons between peoples’ driving habits and their investing habits; impatient drivers expose themselves to all sorts of unnecessary risk and stress.

On a long trip, my GPS estimates the time I will arrive at my destination, usually within a few minutes.  As advisors, we tell clients what they should expect in terms of average market returns knowing that, in any one year, those returns could be considerably higher than expected (2017) or perhaps lower than expected (2018).  Over your investing lifetime, you will likely achieve what you set out to accomplish in terms of investment results if you stay the course and remain committed.  Your GPS will do the same; despite the fact that you may be driving faster or slower than expected at certain times along the way, you will generally arrive on time.

While not always the case in Syracuse, in Atlanta, traffic jams are ever-present during the rush hours.  Undeniably, some drivers feel the need to constantly change lanes expecting something better to happen.  Rather, I conclude, the best option is to stay in one lane and let the “jam” naturally work itself out – no different than what long-term investors should do in an efficiently functioning market.  We have all observed motorists who change lanes whenever they suspect that other drivers may be getting an advantage.  Just as there is added risk in changing lanes and avoiding bumpers and accidents with other moving vehicles, there is risk in jumping from one investment to another based on news reports or a gut-feeling that you are not moving forward fast enough.

The next time you are in a traffic jam, observe the experienced drivers who do in fact stay in their lane – they have been there before, they have seen it play out and they know the stress and risk is not worth the potential reward.  Although they may be frustrated, they tend to remain calm and logical at the same time – accepting the inevitability of certain occurrences.

The best drivers I have observed in my lifetime have a high degree of patience.  And you guessed it, the most proficient investors are very patient as well.  Successful investors understand that some years will be better than others.  Poor economic cycles or market corrections (although fairly common and expected) are impossible to predict in terms of veracity or duration.  This is a valuable lesson I have learned over the last twenty plus years as an investment advisor.  If you feel the need to change lanes, end your investment journey, or simply seek assurance that you’re headed in the right direction, be sure to reach out to your Rockbridge advisor!


Stock Markets

December’s market reminds us that risk is real – even after the uptick at the end of the month, a global stock portfolio is down about 15% for the quarter and 12% for the year. Technology stocks (Amazon, Apple, Microsoft, Google, Facebook, Netflix), which have been driving the market to new heights in recent years, were off nearly 20% this quarter.

Future returns depend on news, which, of course, can’t be predicted. (If it could it wouldn’t be news!) Maybe markets have exaggerated today’s concerns or maybe there is more to go.  For sure, increased volatility lies ahead.  We have been lulled into a stock market that has provided a mostly smooth ride upward over the past few years.  That pattern is not typical – risk matters.

Up until now, the market has shrugged off the myriad of issues that have been plaguing us for a while. These include:  international trade wars and tariffs, rising interest rates, privacy and social media concerns, impact of last year’s Tax Bill, resolution of Brexit, slowdown in global growth, sliding oil prices, political dysfunction and Government shutdowns.  Market prices reflect a continuing forecast of the eventual economic impact of these issues.  In December, these forecasts turned negative.

The ten-year numbers above tell us there is a reward for enduring the normal ups and downs of stock markets, including recent results.

Bond Markets

Bonds earned positive returns for the quarter, fulfilling their role of reducing the overall risk of a diversified portfolio. 

The shape of bond yields across various maturities is unusual.  Even as the Fed increased interest rates, the market-determined yields on longer-term bonds fell.  This pattern can be a harbinger of a difficult economic environment ahead. On the other hand, it is also consistent with an overall move to reduce exposure to risky assets.

We are now dealing with the risk side of investing, which we can divide into two categories:  (1) the impact of factors that affect all securities, and (2) the impact of what affects only an individual security.  By diversifying, the effect of any individual security becomes minimal.  Expected return is the reward for enduring the variability of market-wide uncertainties.

Stock markets are risky, but what about the eventual reward?  Do investors eventually earn what they expect?  We look for answers in two places:  (1) If market participants, who are constantly buying and selling, didn’t eventually earn what they expect, they wouldn’t play, and (2) There is evidence that over the long run, returns tend toward long-term averages.  But long-term means long and succumbing to short-term variability ensures failure.  It’s why risk matters.  It’s why the urge to give up makes success hard to achieve.