Stock MarketsThe Diversification Story April 17

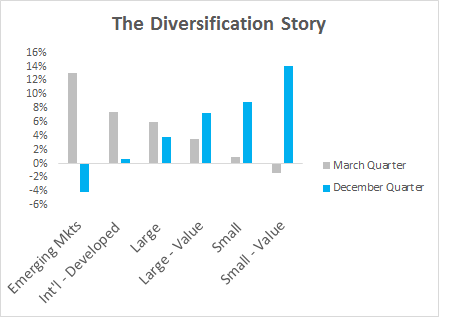
The accompanying chart illustrates the diversification story. It shows returns in several markets over both the March and December quarters. The upward sloping blue columns of the December 2016 quarter show an increase from the low (4% loss) in emerging markets to the high (14%) for the market of small-cap value stocks. Note the variability of returns in these different markets. Now, look at the gray columns of the March quarter and how they decrease across the same markets from a high (13%) for emerging markets to a low (1% loss) for small-cap value stocks. Just the opposite is happening. If you couldn’t predict how these different markets would fare, then to achieve the positive returns stock markets provided over the last two quarters, you had to have commitments to each. This is the diversification story.

A longer perspective is provided in the accompanying Equity Market Returns chart. As you can see, the variability among the different markets tends to lessen over longer periods. Yet, even over the ten years, variability remains. Generally speaking, ten years is a short period in capital markets, and it takes courage to remaEquity Returns 3 31 17in committed to markets that have produced below average returns for ten years. The fact that international developed markets have languished over the past ten years tells us very little about the future in this market sector.
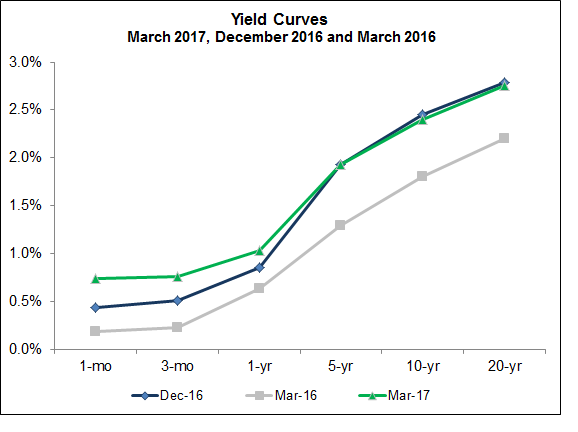
 Yield Curves 3 31 2017

Bond Markets

A Yield Curve shows bond yields across a spectrum of time to maturity. These curves can be useful for both providing some sense of what is expected for future interest rates and understanding recent changes. One thing we see this time is a persistent increase in yields across shorter maturities over the three periods. These changes reflect what the Fed has been doing to increase rates. While yields of longer-term bonds have increased since March 2016, primarily in response to the Election, there is little change over the last quarter even in the face of increasing short-term rates. Changing expectations for future inflation helps to explain this lack of movement in longer-term yields.

On March 15, 2017, the Federal Reserve increased interest rates for just the third time since the financial crisis in 2008-2009. Investment theory tells us when interest rates rise, bond prices fall, so rising interest rates are bad for bond returns. However, bonds have performed well since the Fed raised rates a few weeks ago… WHY?

Looking closer, we see that most interest rates fell after the Fed raised rates:

Yield Numbers 4 2017

Fed Controls Short End of the Curve

If you plot this data on a graph, you will see the yield curve – an upward sloping line that shows higher rates for longer maturities. When the Fed raised rates, the curve “flattened,” meaning short-term rates rose slightly while long-term rates dropped slightly. The yield curve is constantly changing shape, and is not always upward sloping – it is referred to as inverted when short-term rates are higher than long-term rates.

Markets Anticipate

The Fed raised rates by 0.25% and the one-month treasury rate went up 0.06% because everybody knew that the Fed was planning to raise rates; the change was already factored in almost entirely. There was some small chance the increase would be delayed, so there was still room for a small increase when the change became certain.

Inflation Expectations Drive Long-Term Rates

What markets did not anticipate was a Trump Presidency, so there was a significant jump in longer-term rates immediately following the Election last Fall. Inflation expectations drive long rates, and President Trump’s proposals to cut taxes and spend billions on infrastructure are perceived as inflationary. Inflation happens when there are too many dollars chasing too few goods, and prices rise.

Monetary Policy

Theory suggests that cheap money promotes economic growth, which creates more jobs. However, as the economy approaches capacity and full employment, demand for goods and services exceeds supply; the result is unwanted inflation. The mission of the Federal Reserve is to maintain the ideal equilibrium between full employment and price stability through monetary policy.

If the Fed is too slow to raise rates and cool down rapid economic expansion, the market can push long-term rates up in anticipation of higher inflation. This is driven by the fact that investors want an interest return that exceeds inflation and compensates them for taking risk. So even if risk stays the same, they demand a higher rate when inflation expectations rise.

In the current economy the opposite seems to be true. The market is concerned that any increase in rates will dampen an already sluggish economy, putting even less pressure on rising prices. So the Fed raised rates… but interest rates went down.

Conclusion

It is important to remember, as recent events illustrate, bond returns are not directly impacted by the Fed Funds Rate. Through monetary policy the Fed can influence economic growth, and inflation expectations, but the linkage is not very solid. In the aftermath of the financial crisis they were left “pushing a string” – the Fed Funds Rate went to zero, they pumped up money supply, and economic growth and employment still collapsed. Similarly in today’s economy, monetary policy may be important, but its impact can be easily overshadowed by fiscal policy (taxes and government spending). The bottom line – Do not necessarily assume that bond returns will suffer every time the Fed raises rates.

The stock market crash of 2008-2009 is a very recent memory for many investors who still bear the scars from the experience. At Rockbridge, we also have prospective clients who walk into our offices saying that they haven’t recovered yet from the financial pain their portfolio endured over those several months.

Why? It’s usually a combination of some or all of the following factors:

  • Their advisor trying to time the market
  • Lack of broad diversification
  • Excessive investment and advisory fees
  • Emotional response to short-term market fluctuations

“More money has been lost trying to anticipate and protect from corrections than actually in them.”

– Peter Lynch, renowned Fidelity fund manager –

The last 10 years haven’t given investors the risk-appropriate returns they deserved (a 50% stock and 70% stock portfolio basically had the same 10-year result), but if you stayed the course, you’re certainly not “still recovering” from 2008-2009.

For example, a $100,000 investment (50% stocks and 50% bonds) at the market peak at the end of 2007 returned to $100,000 only 13 months after the market bottom, as shown by the graph below. This is not something we want to experience again, but certainly a result most investors could live with given the circumstances.

Now, how do you accomplish that result?

  • Stay the course
  • Diversify your investments
  • Keep investment costs low
  • Limit emotions by having and sticking to a plan

“The investor’s chief problem and even his worst enemy is likely to be himself.”

– Benjamin Graham, “The Father of Value Investing”

We can’t predict or control what the crowd will do in the financial markets we are seeing today, but we can increase our odds of a successful outcome by controlling the aspects of investing that can be controlled: diversification, asset allocation, costs and discipline.

We might see a period of negative stock market returns in 2017, but we don’t know. All we do know is that the best way to guarantee underperforming the market is to not be invested in the market, so our answer is to stay the course and periodically review your portfolio with us to be sure the level of risk you are taking is appropriate for your specific goals.

Screen Shot 2017-04-17 at 9.56.51 AM