The holiday season is a great time to see friends of old who are back in town and catch up with family you don’t get to see as often as you would like.  While getting caught up on each other’s lives, and amidst the small talk, most people these days bring up their dissatisfaction with the stock market.  I even hear, from time to time, that some people feel that they would have been better off if they had just stored their savings underneath their mattress rather than dealing with the ups and downs of the recent market.

Over the last decade investors have been faced with a tremendous amount of volatility in the financial markets.  The “technology bubble” was the first obstacle investors ran into and unfortunately had to bear with for over two years before the markets began to recover in late 2002.  That recovery lasted for around five years and culminated in late 2007 when the Dow Jones hit its all time high.  Unfortunately, this high was short lived and in 2008 investors saw one of the worst market corrections of their lifetimes!  So has this decade been a waste for investors? Are their depictions of the market over the last ten years correct? Hardly, as long as you were properly diversified.

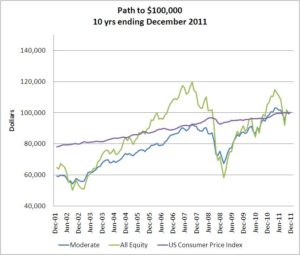
The graph below shows the performance of various benchmark portfolios and how they have fared over the past ten years.  The green line tracks a well-diversified all stock portfolio.  What this graph shows is that if you wanted $100,000 today, you would have needed to invest $64,500 ten years ago to achieve that.  The blue line shows the returns of a moderate portfolio (50% stocks, 50% bonds), which is a more realistic holding for most investors.  With a moderate risk portfolio, an investor could meet his $100,000 demand today with an investment of only $59,200 ten years ago!  I know these are double digit annualized returns we are looking at, but to see this kind of growth in supposedly a “lost decade” seems pretty good to me.


Now, let’s take a look at how your investments would have done over a longer period of time.  The graph below shows the path of those same benchmark portfolios over a time period of 32 years; a time horizon more indicative of what many investors face during their years of saving.  In this case, a mere $4,500 was needed back in 1979 to reach our goal of $100,000 today.  That equates to over a 10% annualized return!


The “investment rollercoaster” of the past decade has played with many investors’ emotions and has been hard to handle.  However, for those who have stayed the course and were properly diversified, you are better off for it.

It is times like these that we need to step back and look at the bigger picture and realize that the recent volatility is nothing more than a few potholes on the road to your financial success!


Related Articles:


Over the holidays, many of our clients and friends asked how business is going.  I thought it would be a good time to provide an update on Rockbridge Investment Management and what we are looking forward to in the New Year.

Financial Results
As a firm, Rockbridge continues to grow steadily.  Over the past two years we’ve grown the amount of assets under management by 20% from $194 million to $232 million.  While the markets have contributed to this increase, most of this rise is due to new clients who have discovered our firm via a referral from a current client or through our website.

Surprisingly, a significant number of our new clients have found us via our website after searching for a local fee-only advisor.  We’ve invested in website improvements to bring our story to more people.  We don’t have an advertising budget and rely on referrals as our main source of new clients.

Our Business Model is a Winner
While our clients know this, it’s worth repeating.  Rockbridge is a fee-only Registered Investment Advisor (RIA).  Our only source of revenue is from fees paid by clients.  We have never accepted a commission from a product we recommend.  The fee-only RIA business model has experienced steady growth while commission-based brokers continue to lose market share as individual investors discover the value of working with an objective fee-only investment advisor.

Our Fees Are Modest
Our mantra continues to be “costs matter.”  The amount an investor pays in investment costs will definitely affect their standard of living.  We continue to have a relentless focus on costs for our clients.  Each year, Charles Schwab surveys the advisors they service.  Rockbridge participates in order to benchmark our firm against others like us.  The survey revealed that our management fees are less than our peers.  Our fees for a typical client average .50% of assets managed versus our peers whose fees average .67%.  Lower investment costs mean more money in our client’s pocket.

Education Never Ends
Our firm is part of a study group of likeminded advisors committed to the passive investment philosophy.   We meet quarterly in New York City to discuss investment strategies or products and compare notes on our business practices.  The insight we get from these meetings makes us better advisors.  We also continue to be a member of The National Association of Personal Financial Advisors (NAPFA).  NAPFA is the country’s leading professional association of fee-only financial advisors—highly trained professionals who are committed to working in the best interests of those they serve.  NAPFA holds several training events throughout the year that we are proud to be a part of.

Plans for 2012 and Beyond
We will continue to meet with clients to review their investment plans.  There is no way to predict future returns; however, we are confident that markets will reward investors for taking investment risk over the long term.  Expected future returns may not be as high as in the past, as articulated in Craig’s accompanying article, so we will continue to help clients determine the right amount of risk to take in order to meet their financial goals.

Changes in technology and new investment products are introduced at an ever increasing pace.  We take time to evaluate new technologies and products on a regular basis.  We spend money on technologies that make us better, more productive advisors.  We are slower to make changes involving new investment products since many are designed to maximize profit  for their own companies, not necessarily for their investors.

Our strategic plan for the next three years calls for modest growth both in new clients and firm revenue.  Our five professional fee only investment advisors have capacity to help more individual investors.  As the baby boom generation is poised to start retiring, we look forward to referrals from our clients and professional networks.

Recent regulatory changes to be enacted in 2012 will shine a light on the abuses in the 401(k) marketplace, especially for small employers.  At Rockbridge, 31% of our revenue comes from managing 401(k) plans for small business owners.  We are poised to be an objective partner for other small firms who care about their employees and their retirement goals.

In conclusion, we continue to be passionate about our investment philosophy and thoroughly enjoy working with and educating our clients.  Personally, I enjoy coming to work every day surrounded by smart, confident, passionate people.

ONE– Stock market returns are seldom what we expect.
The S&P 500 index was up 2% for the year, after being up 8% at the end of April and down 12% at the beginning of October.  Large stocks did better (Dow up 7%); small stocks did worse (Russell 2000 down 4%); and international stocks did much worse (EAFE down 12%).

It is unusual for the S&P 500 to move so little from one year to the next, but it is also unusual for it to behave the way we “expect” it to behave.  Since 1926 the average annual return has been about 11%, and yet over those 86 years, the annual return has fallen between 8% and 13% only 6 times.  The range has been -43% to +54%.

TWO – Regardless of the returns we realize, markets are volatile. 
In other words, we often experience the risk without realizing the commensurate level of return.

2011 certainly felt like a rollercoaster, and the stock market was indeed volatile.  Yet was that volatility unusual considering world economic events?  The experts at Vanguard say no, and provide evidence in a recent paper.  Their evidence is based on a comparison of economic volatility and market volatility, which turn out to be closely correlated.  Moreover, they show that the volatility of the economy and markets was higher in the 1970’s than it has been over the past five years.  Risk and return are related, but we only observe the correlation in the long run.

THREE– When “everyone agrees” on the likely direction of a market (or prices, or interest rates) they can still be wrong.
At the beginning of 2011 “everyone agreed” that interest rates had to rise from current levels.  Bill Gross was one prominent expert who put his money where his mouth was, declaring that U.S. Treasury yields were so low they did not adequately compensate investors.  He sold Treasuries out of his portfolio.  It turned out to be a spectacularly bad decision as Treasury rates fell further and his fund, PIMCO Total Return, the largest bond fund in the world, underperformed.

What is a reasonable range of expected returns…
We have all read the standard performance disclaimer, “Past performance is no guarantee of future returns.”  That warning has rarely been more important or relevant than it is today.

Bond returns have now outperformed stocks over the past ten years.  Mutual fund investors continue to pour money into bond funds in response to stock market volatility and, we assume, in part because of attractive past returns.

Vanguard published a paper in November 2011 that tried to answer the question, “What is a reasonable range of expected returns for a balanced portfolio of stocks and bonds based on present market conditions?”  For the full paper, click here:  https://advisors.vanguard.com/iwe/pdf/ICRLYVE.pdf?cbdForceDomain=true

They present several interesting conclusions including:

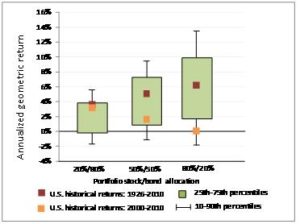
•  Expected returns for a 50% stock/50% bond portfolio are 4.5% to 6.5% nominal and 3.5% to 4.5% in real terms (after adjusting for inflation).  This result is modestly below the average since 1926 (8.2% nominal and 5.1% real) but better than the past decade.

•  Expectations for the next decade are driven by the current level of bond yields, which are highly correlated with future annualized returns from bonds.

•  The chart below shows expected returns for a more risky portfolio (80% stocks/20% bonds) more consistent with the historical average while the expectation for a less risky portfolio (20% stocks/80% bonds) less likely to achieve historical results.

Real (inflation-adjusted) returns


Notes:   Percentile distributions are determined based on results from the Vanguard Capital Markets Model.  For each portfolio allocation, 10,000 simulation paths for U.S. equities and bonds are combined, and the 10th, 90th, 25th, and 75th percentiles of return results are shown in the box and whisker diagrams.  The dots indicating U.S. historical returns for 1926-2010 and 2000-2010 represent equity and bond market annualized returns over these periods.  The equity returns represent a blend of 70% U.S. equities and 30% international equities; bond returns represent U.S. bonds only.

Sources:  Barclays Capital, Thomson Reuters Datastream, and Vanguard calculations, including VCMM simulations, and index returns.

•  With ten-year Treasury rates below 2%, it is irrational to expect bond returns over the next decade to be anything like the past decade, and nearly impossible mathematically.

•  Stocks, on the other hand, appear reasonably priced, capable of providing average historical returns, and quite likely to do better than the past decade, which began with stocks very highly valued (Price/Earnings ratios well above historical averages.)

Conclusions/Take-Aways

1.  Expect returns from balanced portfolios to be below historical averages over the next decade due primarily to low bond yields.

2.  The incentive to take stock market risk (relative to bonds and cash) may be as high as it has ever been.

3.  Chasing the bond returns we have seen over the past decade is ill-advised.

4.  Taking more stock market risk may be tempting, but comes with greater volatility.

5.  Most investors should stay the course, with a balanced portfolio that reflects their long-term tolerance for risk.