If you did not know that rising interest rates hurt bond returns, you would be among the majority of US investors according to a recent survey by Edward Jones. The study found that two-thirds of respondents did not understand how rising rates will affect their portfolios.
The bond math is complicated, but the result of rising rates is straightforward – bond prices go down when rates rise. The total return for a bond, or bond mutual fund, is the combination of interest income, plus the gain when rates fall, or the loss when rates rise.
Market participants generally agree that interest rates will rise from current levels, but no one knows when, or how much:
One analysis from PIMCO suggests that 10-year rates could rise as the Federal Reserve unwinds its unprecedented monetary policy, but less than 1.5% in the near term. Their analysis points out that the spread between the 10-year Treasury and the fed funds rate over the past 40 years has rarely been above 4%, and it rarely stays there.
At the end of September the 10-year Treasury yield was about 2.6%, and we know the Fed intends to keep the fed funds rate near zero until we see substantial improvements in the economy, which no one expects for several quarters. PIMCO also believes that even with a “tapering” of the Fed’s bond buying, or quantitative easing, the program will continue to effectively narrow the spread. Hence an expectation that 10-year Treasury rates can move up from 2.6% but not all the way to 4%.
The 10-year Treasury yield rose approximately 1% over the past year from 1.6% to 2.6%, and the total return on the intermediate bond index over that time was a loss of 1.95%. In round numbers, interest income was about 2% and the loss from price decline was about 4%, resulting in a net loss of 2%. If rates rise another 1%, the net loss will be less because interest income is now higher, and if it takes two or three years, the cumulative total return will be positive from this point forward because you will have two or three years of interest income to offset the price decline.
So What Is an Investor To Do?
Option 1 – If you are still worried about the impact of rising interest rates, you can sell bonds and move to cash until rates go up, and then reinvest at a higher return. This strategy requires a crystal ball. As pointed out above, if it takes two or three years for higher rates to arrive, the interest income you miss will be greater than the price decline you avoid.
Option 2 – Sell bonds and buy stocks. This strategy will always increase the expected return of your portfolio, but also increases risk. A significant rise in interest rates caused the bond index to lose 2% over the past year. You may still remember that many stock portfolios lost a third of their value during the financial crisis of 2008-09.
Option 3 – Stay the course, which is our general recommendation, along with ignoring media hype, and having reasonable expectations.
Ignore Media Hype Like:
“If anyone has been investing in bond funds for any length of time, it has been a great ride, but it’s time to hop off and…”
“Sooner or later, there is going to be a bloodletting in the bond market and…”
Such advice and warnings are no more useful than saying “sooner or later we will experience a devastating hurricane in Florida and…”
And Keep Expectations Reasonable:
Interest rates will eventually rise, and bond prices will fall. In the meantime, bonds are paying some interest, and cash reserves are not.
Bond returns are expected to be much lower than stock returns but continue to provide valuable stability for the portfolios of long-term investors.
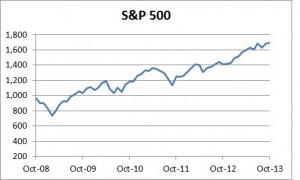 It’s hard to believe we actually made it through that period. The stock market imploded with the S&P 500 benchmark falling more than 50% to 752 on November 20, 2008. We have come a long way since that fateful month. The S&P 500 has averaged a healthy 10% annual return over the last 5 years (see chart) and the global economy continues to recover, although slowly.
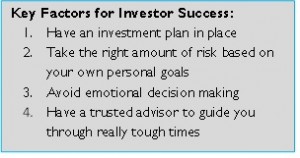 However, it’s important to note that a well-diversified portfolio helped investors to overcome one of the worst financial crises in American history. We continue to believe the keys to successful investing are simple but certainly not easy.