Ready to get started?
If you’re ready to start planning for a brighter financial future, Rockbridge is ready with the advice you need to achieve your goals.
July 18, 2014
All
Stock Markets
The first chart at right shows returns from various stock market indices over several periods ending June 30, 2014. Equity markets have rewarded those of us who stayed the course. Why? I offer three culprits:
 Surprises associated with an improving economic environment
These things are interrelated. The worldwide economy continues to improve, albeit at a sluggish pace, due in some part to the central banks’ efforts to keep interest rates low. However, these policies result in few opportunities in bond markets. The third factor, “Animal Spirits,” is a term coined by John Maynard Keynes in his 1936 book “The General Theory of Employment, Interest and Money” to explain emotional confidence and trust in the future. It is used to explain what makes individuals and corporations undertake long-term capital investments – oftentimes “Animal Spirits” can be a good explanation of the short-term behavior of stock markets.
Bond Markets
Bond market returns are driven by changes in yields and credit spreads. Positive (negative) returns follow from declining (increasing) yields and narrowing (widening) credit spreads; the longer the time to maturity, the greater the impact.
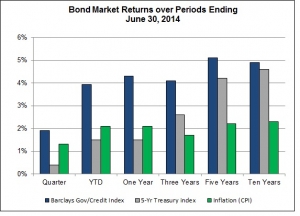
 Over the last six months the yield on the ten-year US Treasury security, which is often used as a bellwether for interest rates in general, fell from 3.0% to 2.5%. At the same time, credit spreads narrowed. The second chart at right shows inflation (percent change in Consumer Price Index) and bond returns over several periods ending June 30, 2014. (The Treasury Index reflects only changes in interest rates; the Barclays Government/Credit Index shows the impact of both changing rates and credit spreads.) Note the extent to which returns from the Barclays Index exceed those of the Treasury Index in recent periods, reflecting narrowing credit spreads. Also, note that inflation has been rather benign.
The Fed is the primary driver of interest rates. Yields have declined even as the Fed reduces its purchasing of long-term Treasury securities. While it is no doubt too early to tell, the impact of the Fed’s backing away from its “Operation Twist” seems to have had little impact on yields so far. While the Fed has promised to keep short-term interest rates near zero at least over the next year, there is a lot more discussion of the impact of increasing interest rates on economic activity, which may signal the beginning of the end of the Fed’s accommodative monetary policy – we’ll see.
Timing Markets
Strategic asset allocation is critical to investing over the long term – it defines the risk profile of the portfolio and explains most of its return. Tactical asset allocation means shifting this strategic commitment to asset classes in response to predictions of short-term market behavior. It’s a euphemism for “market timing.” Making a shift to avoid a correction is market timing.
Unless there is a specific point at which the funds are needed, market timing requires two decisions – when to get out and when to get back in. Being right with both is rare.
The market timing data is mixed. Making the wrong market timing decision can be costly. For example, buying and holding the S&P 500 since December 31, 1970 results in $1,000 growing to $78,435 by the end of this quarter, but if the best five quarters are missed, then it grows to just $31,195. Avoiding down markets, on the other hand, can be very rewarding. If the worst five quarters are missed, then $1,000 becomes $245,558, which helps to explain the appeal of market timing.
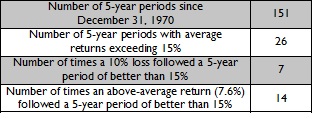
Given where we are today, we are interested in whether a period of above-average returns is generally followed by below-average returns and thus signals a potential down market. To evaluate the extent to which we can use previous five-year returns to provide a meaningful forecast, let’s look at returns from the S&P 500 Index, after inflation (change in CPI), over the 174 quarters (43½ years) since December 31, 1970. Further, let’s define a good five-year period as one with an average return greater than 15%, and a loss of 10% is the period to be avoided. The results of this analysis are at right.

There are not a lot of five-year periods when the average return exceeded 15%. However, note that a five-year period that averaged above 15% is more apt to be followed by another year of above-average returns than a loss that exceeds 10%.
While the results from avoiding a “down” market are compelling, the cost of missing “up” markets can be substantial. There is always substantial variability about the future direction of stock markets. Timing markets successfully requires reducing this variability. Unfortunately, there is no reason to think past returns will be helpful. There is simply no reason to conclude that now is the time to engage in tactical asset allocation.
If you’re ready to start planning for a brighter financial future, Rockbridge is ready with the advice you need to achieve your goals.