Ready to get started?
If you’re ready to start planning for a brighter financial future, Rockbridge is ready with the advice you need to achieve your goals.
July 24, 2017
AllInvestingNews
Stock Markets
The chart at right shows stocks performing well in the past quarter and six-month periods. Year to date, domestic large-cap stocks were up about 9% while small-cap stocks were up 5%. Stocks traded in international developed markets and emerging markets were up 14% and about 19%, respectively.
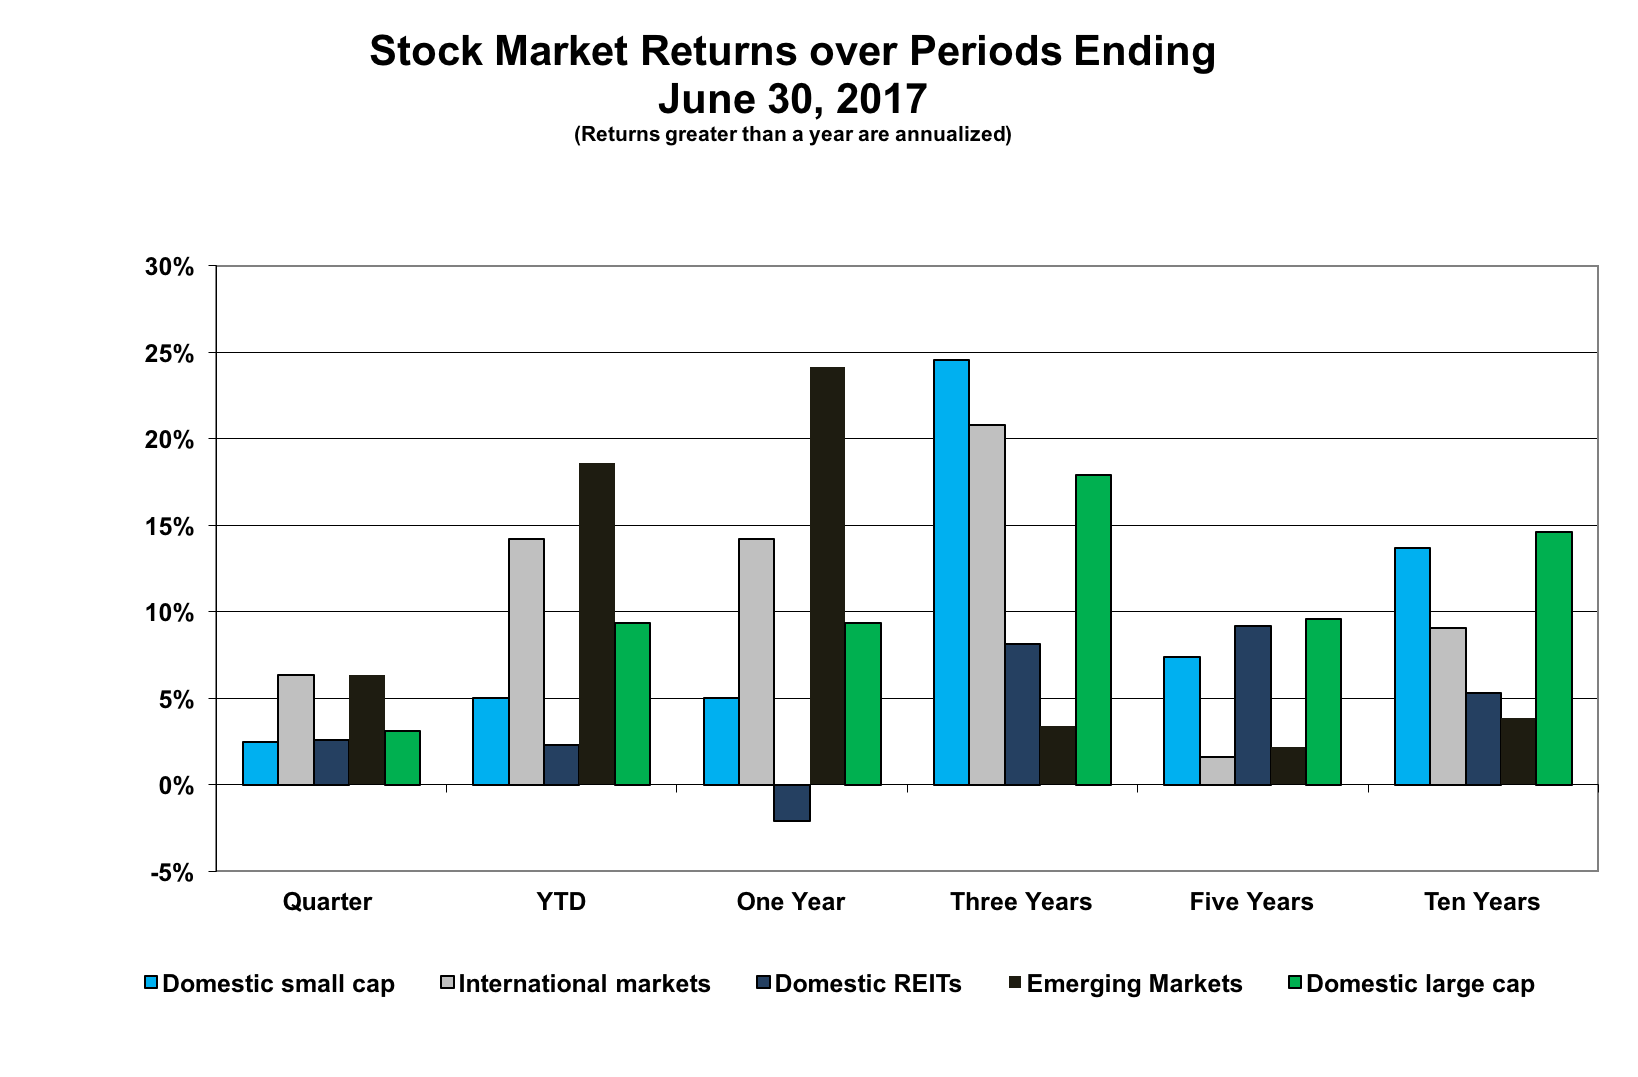 Over three, five and ten years, domestic markets (both large-cap and small-cap) were especially strong. These results are starting to give rise to concerns of “irrational exuberance” and over-valuation in these markets. Keep in mind, however, we could be observing a bounce off the sharp decline of 2008, one of the worst periods in stock market history. So, what do we have now – “over-valuation” or “regression to the mean”? Not so much exuberance in other markets.
The usual proxy for the domestic large-cap stock market is the S&P 500, a well-worn index that many consider representative of the total stock market. Today the S&P 500 is skewed by well-known technology companies – Apple, Microsoft, Alphabet (Google) and Amazon make up the top four stocks, with Facebook coming in at number six. Thus, the S&P 500 is more indicative of how the largest technology stocks fared versus stocks in general.
The chart shows the extent that markets fall in and out of favor through time, which provides an incentive to try and predict. However, this is not something we recommend. Instead, maintain commitments to each asset class and reap the benefits of diversification. In any event, recent periods have been generally good for stocks.
Bond Markets
The Yield Curves chart at the right yields of U.S. Treasury securities across various maturities as of June 2017, June 2016 and December 2016. Today’s curve is more pronounced and shown in green. Notice how it has “flattened” – long rates are down and short rates are up. Yields have increased over the past year resulting in a negative impact on bond returns over that period.
The rise in short-term rates is consistent with recent Fed activity. Yields on bonds of longer maturities are market determined. It has been, and continues to be, widely anti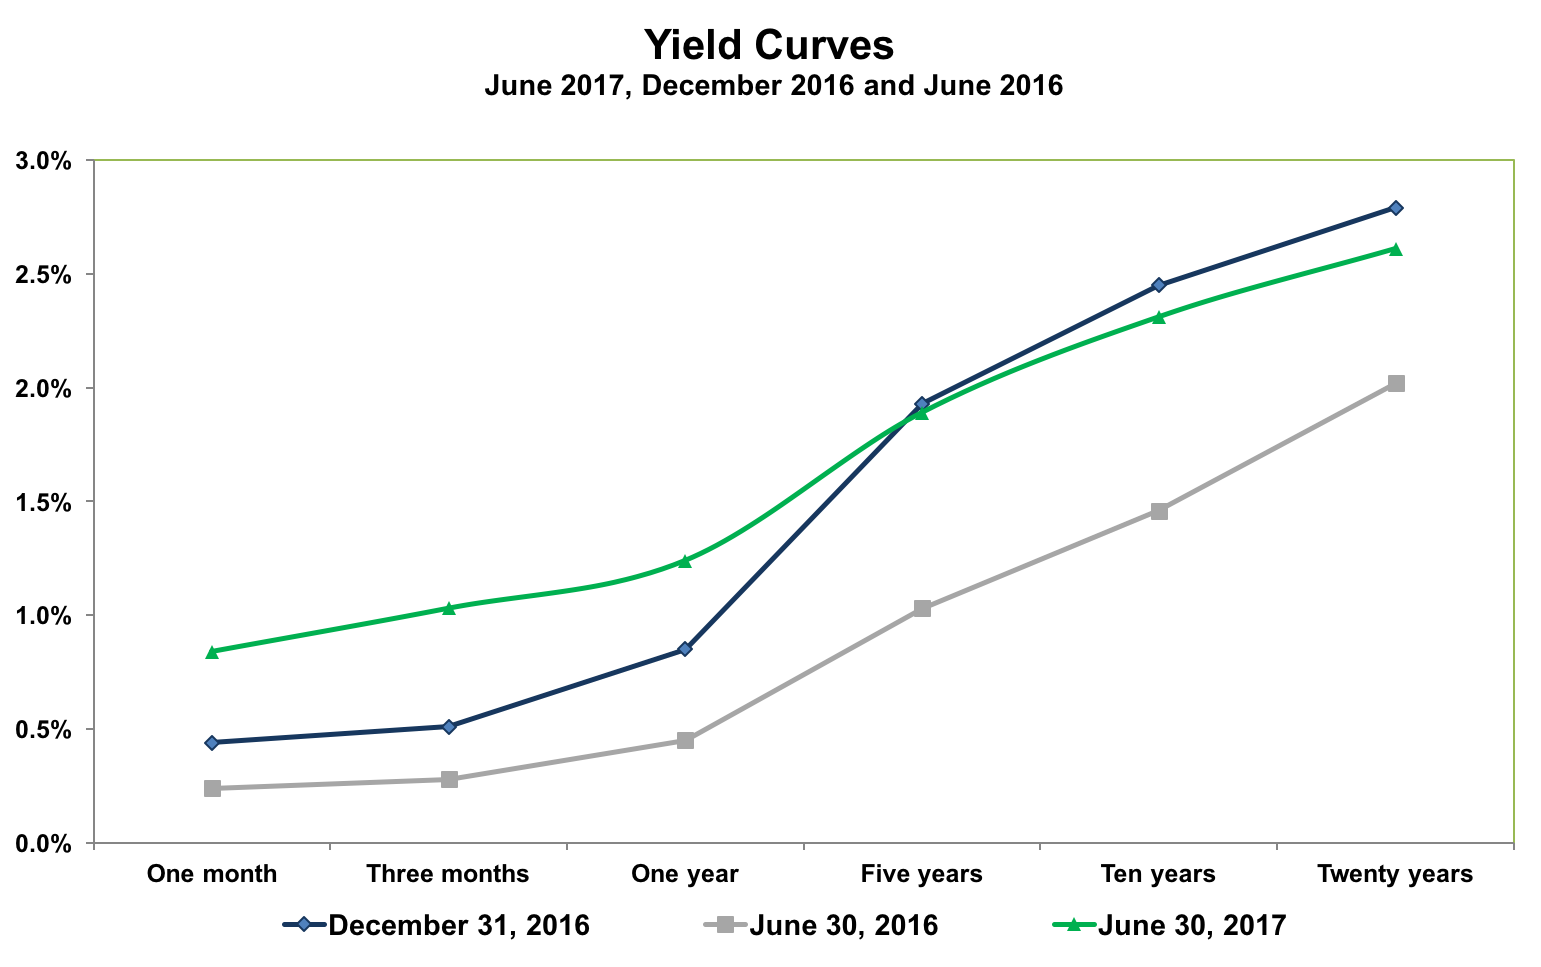 cipated that the Fed will continue to increase interest rates. Yet, longer-term bond yields have not increased. This flattening of the Yield Curve can be a harbinger of difficult times ahead as the market may be telling us they don’t expect the Fed will be able to increase rates. We’ll see.
Stock values have been climbing almost uninterruptedly over the recent past. Bonds have not. This record is consistent with the long-held maxim that if you can stand the heat, stocks will eventually outperform bonds. The recent track record, along with this widely held belief, has some wondering why hold bonds at all.
While stocks look good, there are still reasons to hold bonds. First, bonds reduce volatility, which can make it easier to remain committed to a given risk strategy over the long term. Failing to do so means not realizing the positive long-term returns of stocks. In some periods, maintaining an allocation to bonds provides a better outcome. (A portfolio with a 30% allocation to bonds did better than an all stock portfolio in 27% of the ten-year periods since 1926.) Prudence means not taking unnecessary risks and matching a portfolio’s profile to established long-term goals – bonds help do that.
If you’re ready to start planning for a brighter financial future, Rockbridge is ready with the advice you need to achieve your goals.
