Stock Markets
Not surprisingly, stock markets were volatile this quarter. Faced with a myriad of issues ranging from renewed inflation, historically high equity valuations, winding down the Fed’s “Quantitative Easing”, capped by Russia’s invasion of Ukraine. The largest tech companies held up reasonably well, with Facebook as the only notable exception. Returns from stocks traded in international and emerging markets are in negative territory. However, value stocks in both international and domestic markets traded at a premium over the quarter. The ups and downs of stock prices reflect the market’s continued incorporation of the ongoing news associated with our uncertain environment.
Inflation is a concern. Over the past twelve months the Consumer Price Index (CPI) is up 8% – levels not seen since the early 1980’s. It’s not clear whether this spike reflects government stimulus spending, or shortages due to global supply chain disruptions; likely a combination of both. The Fed is beginning to increase interest rates in response. Its success at balancing the need to bring down inflation without triggering a recession is uncertain. While the concern of continued inflation seems to be heightened, market signals continue to indicate that inflation will be relatively short lived.
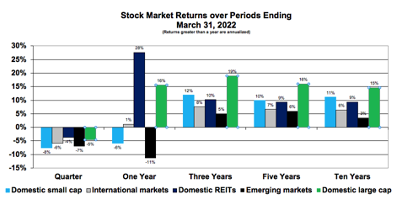
Stock returns in various markets over the past twelve months differ significantly from one another. Some differences in returns are offsetting performance from earlier periods, as the variability across market segments is less pronounced over the three-year period (shown above). Returns from domestic large-cap stocks remain well above long-term averages.
Over longer periods, we continue to see stocks in domestic markets doing better than those in non-domestic markets indicating generally more positive responses to uncertainty. Ten years is not a long period in financial markets. While these relative returns are useful to understanding recent performance in diversified portfolios, these results shouldn’t be used to predict the future.
Bond Markets
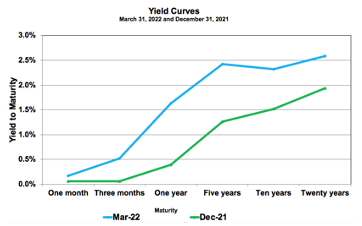
A Yield Curve exhibits the pattern of observed returns from holding bonds to term across several maturities. It provides a sense of where interest rates are heading. Shifts help explain short-term bond returns as bond prices/returns move inversely to yield changes. The longer the period to maturity, the greater the effect. Today’s upward sloping Yield Curve implies increasing yields going forward. The upward shift explains this quarter’s negative bond returns.
Yields are driven by interest rates, risk premiums and expected inflation. These factors change over time resulting in moving yields and volatile bond market returns. If we isolate interest rate and risk by looking at Treasury yields of like maturities, then we have a view of expected inflation. Five-year yields have increased to levels above the ten-year numbers, reflecting increased short-term inflation expectations. Five-year yields imply 3.8% inflation over that period while ten-year yields imply 2.8% inflation. While these numbers are up since December, they are well below the 8% experienced over the past twelve months.
Uncertainties associated with the Fed’s activities include (1) how fast and by how much it will increase interest rates to contain inflation and (2) how it will deal with the massive amount of government securities on its balance sheet. The Fed increased interest rates by ¼% at its last meeting, expecting several more rate hikes going forward with a goal to bring down inflation without triggering a recession. The Fed has $9.0 trillion of government securities on its balance sheet, well above anything seen in the past. How aggressively the Fed brings this amount back to historical levels will likely impact bond markets.
