Each year large Wall Street firms post their expected returns for the next decade. A year ago, we saw the following forecasts:

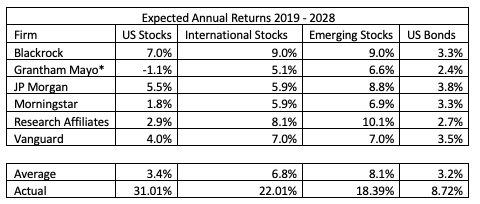
*  Denotes a seven-year forecast

The biggest thing that stands out here is the poor performance expected by U.S. Equities. Despite 93 years of annualized returns in excess of 9.5%, the best research minds in the country were only forecasting an average of 3.4% for the ensuing 10 years. It is also interesting how much better they expect returns from non-U.S. stocks to be than from U.S. stocks.

Another thing to note is how far off last year’s realized returns are from the forecasted returns. For U.S. Stocks, an annualized 3.4% for a decade works out to a gain of 39.7%. If that were to be true, we got more than three-quarters of that gain just in the last year.

The following table shows the same companies and their expected returns for the next decade.

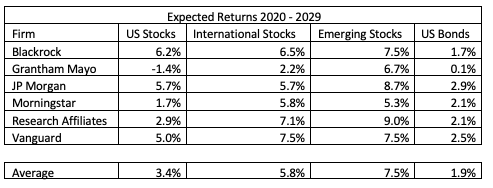
Relative to last year, it is interesting to see that U.S. Equities still have the same expected return, despite their great run in 2019. Expected returns from non-U.S. Stocks came down some but are still quite a bit higher than U.S. Stocks. One takeaway is that the U.S. economy and expected future earnings beat expectations last year by a greater margin than they did overseas. Still, overseas prospects are apparently brighter. Another interesting item is the expected return of U.S. bonds. The prediction fell from 3.2% to 1.9%, which is a function of interest rates falling. Currently, the U.S. Aggregate bond market is yielding 2.2%. To realize a 1.9% return off of a 2.2% yield means the underlying value of the bonds must be decreasing (interest rates are rising). The implied increase interest rates over the next decade would have to be towards the end of the decade and at least 0.50% for this to hold true.

We can think of a few takeaways from this information. First, despite the poor performance of international equities over the last decade, we believe it would be a mistake to reduce international equity allocation at this time. Second, markets are very hard to predict and years or even a decade can be short when it comes to markets and economic cycles.

A foolish investor last year would have seen an expected 3.4% return from U.S. Stocks and have been tempted to look elsewhere. If they had done that, they would have missed out on a 31% gain. We are again reminded that the most prudent thing is to stay diversified and stay invested while ensuring you are making all the correct decisions when it comes to saving and financial planning.

The following article by Ethan Gilbert was recently published on Jim Cramer’s website, “TheStreet”, in their retirement section. Ethan began being a guest contributor in 2019.

With recent headlines around the increasing national debt, our firm has had clients reach out to ask if they owned Treasuries and if the national debt is something that should worry them and their investments.

Most investors own U.S. government debt in some capacity. Whether it’s a pension, an insurance product, a mutual fund or ETF, savings bonds, or a Treasury note, government debt is everywhere. Part of the reason it’s so prevalent is because there is so much of it. Currently, the government owes $23 trillion and plans to add another trillion in 2020, making it the largest issuer of debt in the world.

Through the academic lens of investing, debt obligations of the U.S. government are assumed to be free of default risk as governments can print money. But through history we see that this does not always hold true.

Countries who let their debt get too large are forced to either print money or default. Neither is a good option, especially for investors. Could this happen to the U.S.?

It could, but it will likely be three or four decades until it reaches a tipping point, and even then, it’s not a guarantee. In the meantime, investors should feel safe buying Treasury bonds; safe in that they’ll receive their interest and principal, and safe that a buyer will exist should the investor want to sell them in the future.

First let’s look at the bad, our country’s fiscal health. The most relevant figure is debt as a percentage of the economy. Specifically, debt held by the public (excluding other government agencies). For the United States, that total is $17.1 trillion. The total size of the economy (gross domestic product, or GDP) is $21.7 trillion, putting public debt as a percentage of GDP at 79%.

This is high by historical standards, but not catastrophic. Countries that have defaulted tend to do so when debt as a percentage of GDP gets above 180%.

The credit rating agency, Moody’s, and the International Monetary Fund (IMF) each publish reports assessing developed countries’ “fiscal space” or how much additional debt they could incur before no longer being able to find buyers for their debt. Moody’s and the IMF each give a few numbers when assessing the U.S. In general, we are OK with debt up to 200% to 240% of GDP, but would struggle above that level. The U.S. is thought to have a relatively large fiscal ceiling because of our size and access to credit.

The reason for the multiple numbers is the uncertainty on interest rates and the cost of servicing the debt. Looking at data from 1962 to today, our debt is at an all-time high (79% versus an average of 41%). However, interest rates are low. The U.S. 5-year note is yielding 1.62% versus an average of 5.8%. Because of this, the cost of our debt as a percentage of GDP is close to average (1.85% versus 1.90%).

This cost has been rising in recent years as debt keeps increasing and the yield curve has risen. Were interest rates to return to their historical norm, the cost of the interest would become quite burdensome. Say with debt at 140% of GDP, and interest rates at 5%, the cost of the debt would be 7% of GDP. That’s more than a third of what our government raises each year through taxes.

Adding to the concern is the trajectory of our national debt. Since 1962, annual spending as a percentage of GDP has averaged 20.1%. In 2019, it will be 21.3%, by 2029 will rise to 22.5%, and by 2049 is expected to rise to 28.2%. Tax revenue will not keep up. Over the last 57 years, revenue has averaged 17.3% of GDP. This year it is expected to be 16.1%, by 2029 it is forecast to rise to 18.3%, and by 2049 will be 19.5%. In this scenario, debt held by the public would be 144% of GDP in 2049, and our annual interest expense would be 5.7%.

These projections come from the Congressional Budget Office’s (CBO) annual “Long-Term Budget Outlook” which was published in June 2019. These numbers are derived from a set of assumptions based on current law. Unfortunately, the situation worsened in August 2019 when congress passed the

Bipartisan Budget Act of 2019, which removed discretionary spending caps and didn’t offset those costs.

In anticipation of this, the Congressional Budget Office includes in their Long-Term Budget Outlook an Extended Alternative Fiscal Scenario, which tries to forecast elected officials’ propensity for increasing spending and reducing taxes. In this alternate scenario, come 2049 we have revenues of 17.6% of GDP and spending is 33.1% of GDP. Debt as a percent of GDP would be 219% and the annual interest component would be 9.4%. It’s hard to imagine this alternate situation would fully come to fruition but as recent history has taught us, forecasts under current law don’t seem to hold.

Estimating events 30 years away is guesswork at best, but it seems reasonable to think the United States would be reaching the point of insolvency in roughly 45 years, give or take a decade. A concern people have with budget issues is that waiting makes the future changes more difficult and abrupt. Like anything in life, if you plan ahead it’s easier. But Washington is doing the opposite, they are making the problem worse.

Still, there is good news for investors. The market doesn’t seem to mind our fiscal issues and markets are ruthless. When other countries have fallen out of favor with investors, buyers don’t exist, yields skyrocket, and countries are forced to print money or default. Nothing close to that has shown itself regarding Treasuries, instead the opposite has happened.

On Aug. 2, 2019, the Bipartisan Budget Bill was passed into law. It eliminated the 2011 sequestration on discretionary spending and raised the baseline for future discretionary spending. The market didn’t blink at this additional $1.7 trillion in spending over the next decade. Rather, within a month, interest rates on U.S. government debt declined to near record, or record levels, depending on the term. The U.S. 30-year, our longest-dated bond that in theory carries the most default risk, closed at a record low of 1.94% on Aug. 28. The market is clear, it doesn’t much care about America’s fiscal challenges.

This phenomenon of low interest rates is seen around the world. In August 2019, $17 trillion in global debt was yielding negative interest rates, and only $200 billion of that was in the United States. At the time this prompted investors to wonder why America’s government debt couldn’t get to negative yields. Negative yields are more a result of supply and demand than fundamentals. There is a lot of wealth in the world, and for those with a strong aversion to risk, owning negative yielding debt is a necessity.

The U.S. dollar is the reserve currency of the world. All types of institutions, companies, and people come across dollars and need to hold them for a period of time. Those who want a guarantee that their dollars will be returned purchase treasuries. This, along with other factors, should perpetuate strong demand for treasuries into the foreseeable future.

The situation in Japan may also relieve anxiety over the U.S. debt. Japanese debt currently stands at 238% and has been above 200% since 2009. Despite this high level of debt, over half of the outstanding debt trades with a negative interest rate. Factors supporting Japan’s yields are that the country is currently running close to a balanced budget and over 90% of the country’s debt is held within Japan.

America relies on foreigners for a larger share of Treasury ownership, about 30%. The following is a breakdown of America’s nearly $23 trillion in debt.

  1. $6.8 trillion – Foreign holders (Japan at $1.2 trillion & China at $1.1 trillion)
  2. $6.0 trillion – other U.S. government agencies (Social Security, Military Retirement, FERS)
  3. $2.6 trillion – Pension funds
  4. $2.3 trillion – Federal Reserve
  5. $5.3 trillion – All other U.S. investors (U.S. based mutual funds and ETFs, state and local governments, banks, insurance companies, U.S. Savings Bonds, private investors)

While we don’t have the same type of domestic demand that Japan enjoys, America does have a diverse form of debt owners reinforcing the argument that we have good access to credit.

Even if projections come to fruition in 40 years, the market may treat U.S. debt more like Japan than Argentina. Though we’d probably struggle to reach a balanced budget at that point.

When asked to identify the greatest threat to our national security, former admiral and chairman of the Joint Chiefs of Staff, Michael Mullen, and former Defense Secretary James Mattis have both cited the national debt rather than a foreign government or terrorist organization.

I agree, I think America’s national debt is the greatest threat to the world’s long-term prosperity outside of nuclear war (you could also argue a climate-induced catastrophe).

But from an investor’s standpoint there is no reason to be concerned about the national debt or holding Treasury bonds in the foreseeable future.

Often, all you need to be an excellent investor is a healthy dose of common sense: A penny saved is a penny earned. Buy low, sell high. Don’t put all your eggs in one basket.

That said, the best way to achieve these simple goals isn’t always as obvious. In fact, many of our favorite investment insights may at first seem counterintuitive. Today, we cover a trio of weird, but wonderful “upside-down” investment ideas.

Investment Insight #1: Market volatility is the norm, not the exception.

How often have you thought something like this: “The markets seem so crazy right now. Maybe I should back away, or at least wait until things settle down before I make my next move.”

The problem is, the markets rarely “settle down.” And when they do, we only realize it in hindsight. There are just too many daily seeds of doubt, forever being sown by late-breaking news. We never know which ones might germinate – until they do, or don’t.

We suggest putting market volatility in proper context.

“Being surprised at equities’ ups and downs is like visiting Chicago in January and being shocked by 8 inches of snowfall.” — William Bernstein

In other words, it’s normal for markets to swing seasonally. It’s just part of the weather. For example, in Dimensional Fund Advisors’ commentary, “Recent Market Volatility,” we see U.S. stock markets ultimately delivered positive annual returns in 33 of the 40 years between 1979–2018. But during the same period, investors had to tolerate average intra-year declines of 14%.

Investment Insight #2: Market volatility is your frenemy.

What if markets weren’t volatile? What if all the days, in every market, were like November 12, 2019, when the Dow closed at the same 27,691.49 price as the day before?

If prices never changed, traders would become unwilling to trade; they’d have no incentive to do so. In this extreme, markets would no longer be able to serve as a place where buyers and sellers came together and agreed to price changes. Soon enough, markets would cease to exist.

What if there were just far less market volatility? You would probably soon discover how much you missed those same, downward price swings you ordinarily loathe. That’s because, long-standing evidence has informed us: By giving up extra volatility, you also must give up the extra returns you can expect to earn by tolerating the volatility risk to begin with.

“If you’re living in fear of the next downturn, consider shifting your thinking instead of your investments. Focus on controlling what you can control, such as how much you save, or finding the right stock/bond mix.” — David Booth

Investment Insight #3: You can win for losing.

Wouldn’t it be great to hold only top selections in your investment portfolio, with no disappointments to detract from your success?

Of course it would. It would also be nice to hold a $100 million winning lottery ticket. But just as the lottery is no place to invest your life’s savings, neither is speculating on the razor-thin odds that you can consistently handpick which stars are next in line to shine.

Instead, we suggest building a broadly diversified portfolio covering a range of asset classes … and sticking with it over time.

By always being already invested wherever the next big run is about to occur, you’re best positioned to earn market returns according to your risk tolerance. At the same time, spreading yourself across multiple asset classes also means you’ll always be invested somewhere that isn’t doing quite as well. This means you’re unlikely to ever “beat the market” in a big, splashy way.

Here’s a helpful way to think about committing to a mixed-bag (diversified) portfolio:

On a scale of 1-10, with 10 being abject misery, I’m willing to bet your unhappiness with a diversified portfolio comes in at about a 5, maybe a 6. But your unhappiness if you guess wrong on your one and only investment for the year? That goes to 11. — Carl Richards

Obvious in Hindsight?

We hope the insights we’ve shared now seem a little more obvious. We also hope you’ll be in touch if we can help you incorporate or sustain these three upside-down ideas within your own portfolio management. Because …

“‘[O]bvious’ is often a long way from ‘really believed and internalized’ and in the gap between those two fortunes are made and lost.” — Cliff Asness


Although we believe it is reasonable to say that few of us know much (if anything at all) about the Coronavirus, it has quickly grabbed global headlines. As the viral news has spread, so too has financial uncertainty. What’s going to happen next? Will it infect our economy? So far, U.S. markets have remained relatively immune. But should you try to dodge markets that have been exposed?

Our advice is simple: Do try to avoid this or any other health risk through good hygiene. Wash your hands. Cover your mouth when you cough. Eat well, exercise, and get plenty of sleep.

But do not let the breaking news directly impact your investment stamina.

If you’re already following an evidence-based investment strategy …

  • You’ve already got a globally diversified investment portfolio.
  • It’s already structured to capture a measure of the market’s expected long-term
  • You’ve already accepted (at least in theory!) that tolerating a measure of this sort of risk is essential if you’d like to actually earn those expected long-term
  • You’ve already identified how much market risk you must expect to endure to achieve your personal financial goals; you have allocated your investments accordingly.

In other words, it may feel counterintuitive, but leaving your existing portfolio exposed to the risks wrought by a widespread epidemic is already part of the plan. All you need do is follow it.

Admittedly, that’s often easier said than done. Here are a few reminders on why sticking with your existing investment plan remains your best financial “treatment.”

Markets endure. We by no means wish to downplay the socioeconomic suffering coronavirus has created. But even in relatively recent memory, we’ve endured similar events – from SARS, to Zika, to Ebola. Each is terrible, tragic, and frightening as it plays out. But each time, markets have moved on. Whether coronavirus spreads further or we can quickly tamp it down, overwhelming historical evidence suggests capital markets will once again endure.

“Journalists who reported flights that didn’t crash or crops that didn’t fail would quickly lose their jobs. Stories about gradual improvements rarely make the front page even when they occur on a dramatic scale and impact millions of people.”
Hans Rosling

The risk is already priced in. The latest news on coronavirus is unfolding far too fast for any one investor to react to it … but not nearly fast enough to keep up with highly efficient markets. As each new piece of news is released, markets nearly instantly reflect it in new prices. So, if you decide to sell your holdings in response to bad news, you’ll do so at a price already discounted to reflect it. In short, you’ll lock in a loss, rather than ride out the storm.

“I’m assuming there will be no apocalypse. And that’s almost always, if not quite always, a good assumption.” — John C. Bogle

If you’re not invested, your investments can’t recover. Few of us make it through our days without enduring the occasional moderate to severe ailment. Once we recover, it feels so good to be “normal” again, we often experience a surge of energy. Similarly, markets are going to take a hit now and then. But with historical evidence as our guide, they’ll also often recover dramatically and without warning. If you exit the market to avoid the pain, you’re also quite likely to miss out on portions of the expected gain.

 “[T]he irony of obsessive loss aversion is that our worst fears become realized in our attempts to manage them.” — Daniel Crosby

Bottom line, market risks come in all shapes and sizes. This includes the financial and economic repercussions of a widespread virus, be it real or virtual. While it’s never fun to hunker down and tolerate risks as they play out, it likely remains your best course of action. Please let us know if we can help you maintain your investment plan at this time, or judiciously adjust your plan if you feel it no longer reflects your greater financial goals.

The SECURE Act was passed last month as part of a larger government spending bill. The new law is wide ranging, affecting retirees, heirs, those with 401(k)s, and 529 holders. The following are the most impactful sections of the new law.

New Rules on Inherited IRAs

  • IRAs inherited from people who die after 1/1/2020 can no longer be stretched over the inheritor’s lifetime. Instead, they must be taken out within 10 years.
    • Exceptions are:
      • Surviving spouses
      • Children who are minors. The 10-year rule starts when they turn 18.
      • Disabled people
      • Chronically ill people
      • Anyone not more than 10 years younger than the IRA owner. Many siblings inheriting an IRA will be able to take it over their lifetime.
    • Implications of the new Inherited IRA Rules:
      • Adults near retirement may want to backload Inherited IRA distributions. For example, if you plan on working for another 6 years when you inherit an IRA, it probably makes sense to take no distributions for the next 6 years and then liquidate the account over the following 4 years.
      • For high earners, inheriting an IRA is not as appealing as it was before. For those nearing the end of their lives with high-income children, it may make sense to do Roth IRA conversions as you’ll be converting the IRA in a lower tax bracket than your child will be taking it out once they inherit it. This will be more important for those with large IRAs, fewer children, and high-income children.
    • Inherited IRAs from people who died in 2019 or before are grandfathered into the old rules of a lifetime stretch.


New Required Minimum Distribution Age (RMD) of 72 (was 70.5)

  • For those born January 1st through June 30th, this delays the year of your first RMD by 2 years. For those born in the second half of the year it delays it by 1 year.
  • The distribution schedule does not change. The age 72 factor is 25.6 so the first year distribution is 3.9%.
  • Those who turned 70.5 in 2019 stay under the old rules. The later RMD age is only for those born 7/1/1949 and later.


No age limits to Traditional IRA contributions

  • You still need earned income, but in the past, traditional IRA contributions weren’t allowed after age 70.5. Income rules/limitations still apply.
  • This allows for Backdoor Roth IRA contributions for those over 70.5.


Annuities in 401(k)s

  • Portable annuities may be offered going forward in 401(k)s.
  • Despite its impact not being enormous, this feature is probably the reason the bill became law in the sense that insurance companies lobbied hard for the bill’s passage.
  • We will have to see the kind of imbedded fees associated with the 401(k) annuities, but assuming they are akin to immediate annuities that are bought in the open market, this will be very good for insurance companies and not good for investors who choose annuities in their 401(k)s. We will follow up with another post detailing how bad of an investment purchased annuities are and how high the fees associated with them are.


Expanded 529 uses

  • 529s can now be used to repay student loans. If you have loans and want a state tax deduction (if your state has one), you should run your payments through a 529.
  • 529s can now be used to pay for expenses related to homeschooling.