Rockbridge is involved in many organizations that advocate for children with disabilities and their caretakers.  As a result, we’ve helped numerous families financially navigate through their working years and successfully transition into retirement.  Special needs families tend to have common questions, one of which is how and when to file for Social Security benefits.

In order to provide a special needs child with the highest quality of care, it’s common for one spouse to stay at home full-time.  As a result, the non-working spouse doesn’t accumulate a significant work history and their future Social Security benefit suffers. Sure, the non-working spouse could file for Spousal benefits, but today we take a look at a special filing method called “Child-in-Care”.  Here’s how it works:

To file for this benefit, the working spouse must have retired and started collecting his/her Social Security benefit.  At this point, the non-working spouse can file for and start collecting Child-in-Care Spousal benefits AT ANY AGE.  That’s right, the non-working spouse can start collecting Child-in-Care benefits at any age.  Moreover, Child-in-Care benefits have preferential calculations over traditional Spousal benefits.  The non-working spouse is entitled to 50% of the working spouse’s Full Retirement Age (FRA) benefit.  Benefits would continue as long as the special needs child remains an eligible dependent (more on this later).

On its face, the Child-in-Care strategy sounds like an excellent way for a non-working spouse to receive a significant Social Security benefit.  However, there are two potential issues to consider:

  • First, the working spouse must start collecting his/her benefit in order for the non-working spouse to file and collect. If the working spouse starts collecting at age 62 (earliest age possible), he/she is locking in a permanent benefit reduction for the rest of their life.  Depending on the family’s assets, the working spouse could delay their benefit until a later age, providing a significantly higher lifetime income.  Delaying benefits could also provide protection for the non-working spouse should the working spouse pass away early in retirement.
  • Second, depending on the amount of SSI/SSDI benefits that the special needs child receives, you may exceed the Family Maximum Benefit.  Supplemental Security Income (SSI) and Social Security Disability Insurance (SSDI) are benefits paid on the working parent’s earnings record. The same is also true for spousal benefits.  As a result, combining SSI/SSDI benefits with the higher Child-in-Care spousal benefit can often exceed the Family Maximum Benefit.

So, how do you make an optimal filing decision?  It’s important to consider the following.

  • What’s the age discrepancy between the two spouses?
  • What’s the size of current SSI/SSDI benefits?
  • What’s the life expectancy of the child with special needs?
  • Does your family have other income and/or retirement assets?
  • What’s the family health history of the two spouses?
  • What’s your comfort level with delaying Social Security benefits?

As always, please feel free to reach out to your financial advisor at Rockbridge for an analysis that’s specific to your situation.

Stocks for this quarter maintained the above-average trend in the year-to-date numbers.  The primary market drivers are the Fed activities and the status of tariff discussions with China and Mexico.  As the prospects for reduced interest rates and resolution of the tariff negotiations wax and wane, stocks move up and down.

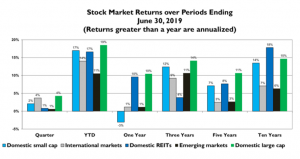
The graph below shows returns in several equity markets for various periods ending in June.  A few things stand out:  (1) domestic markets have done better than non-domestic markets; (2) there are significant differences among the various markets and; (3) while volatile, it was a reasonably good period for stocks.  Keep in mind that ten years is a short period and that markets have no short-term memory – what we see here may not be indicative of what the next ten years hold.  Consequently, the need for diversification.

Bond Markets

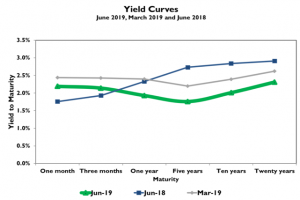
The yield curves below show what’s earned over several periods from holding U.S. Treasury securities to maturity.  These curves are sometimes indicative of the future direction of interest rates – upward sloping is consistent with a reward for taking interest rate risk and increasing rates; flat and downward sloping for decreasing rates. Note the parallel shift downward over the past quarter – positive for bond returns.  The typical yield curve slopes upward – greater return for longer maturities.  Note the June and March yield curves do not follow this pattern.  Look at the uptick in short-term yields and decline in yields for longer maturities over the past year – positive for long-term bonds, negative for short-term.

Diversification

Diversification can bring short-term uncertainty, but unless you can predict the future consistently, it is still the best strategy for the long run. Holding a diversified portfolio means in most periods, there will be at least one market we wished we avoided.  Recently, value stock returns are well under those in other markets. Yet, to realize the long-run benefits of diversification, we must deal with this short-term regret and uncertainty. There is evidence that over the long run, markets tend to move towards averages – periods of above-average returns are followed by periods of below-average returns.

International Trade

Markets move as the prospects for tariff negotiations wax and wane.  International trade ties world economies together – it’s fundamental to the workings of today’s global economy. Through time the world changes and comparative advantages shift.  International trade continuously affects various industries differently.  Recent volatility in stocks is consistent with ongoing trade negotiations with China and now Mexico.  As the specter of increasing tariffs becomes an issue, markets tend to fall when first introduced, then rise with anticipated resolution. These ups and downs are something we must live with today.

Capital Markets and the Fed

All eyes are on the Fed and the prospect for reduced interest rates.  While this noise is apt to be positive for stocks in the short run, it is hard to put together a compelling story for the longer term.  First, the Fed can only directly affect short-term rates.   Second, there is not much room for rates to fall from today’s historically low levels.  Third, Fed actions only impact long-term rates and borrowing costs to the extent they change market expectations. Finally, the reason for a rate cut is an economic slowdown – generally not positive for stocks.

Stock prices are the present value of expected future cash flows, and so move in sync with an increase’s or decrease’s in expected cash flows and move inversely with interest rates.  For reduced interest rates due to an economic slowdown, the positive impact of falling interest rates would offset the negative effect on expected cash flows.  It appears the market is making that tradeoff today.

The impact the Fed has on the bond market is mostly perception.  It can only affect short-term rates.  A bond’s yield (the amount it will earn if held to maturity) depends to an important extent on expected inflation.  Changes in these yields, which affect periodic returns, follow changes in expected inflation.  This is where the Fed and bond returns come full circle – the Fed watches expected inflation and signals its views by adjusting short-term rates. While it is comforting to have explanations for short-term market behaviour, often it is random noise. This time around the explanation seems to be an anticipated reduction in interest rates by the Fed.

For nearly all investors, the importance of asset allocation and security diversification cannot be overlooked. Diversification can mean different things to investors, but the concept is pretty well understood – hold several different types of investments and you will be better served than those who are concentrated in one stock or in one narrow investment strategy.

I would like to introduce the topic of “tax diversification” here – since it’s not a phrase that is generally understood or discussed among a large percentage of investors and retirees.  The type of account you are eligible to open and maintain will determine how and when the funds are taxed.

For example, whether a withdrawal from your account will affect your taxable income, and ultimately how much you pay in federal and state income taxes depends on the type of account.

Account types generally fall in one of three categories: Tax-Deferred, Tax-Free and Taxable.

  • Tax-Deferred: Funds held in Traditional IRAs, a 401k, 403b, pensions or profit-sharing plans are tax-deferred. Contributions to an employer’s sponsored plan are made on a pre-tax basis before wages are taxed (such as with a 401k or 403b or 457 plan). Most insurance annuities are tax-deferred – gains are taxable when you or a beneficiary receives a withdrawal. In the case of a Traditional IRA, contributions are normally made on a pre-tax basis. Contributions are allowed but complicate the future reporting that is required to avoid paying tax again.
  • Tax-Free: Funds held in Roth IRA’s are tax-free. Contributions to the account are after-tax, but there is no tax charged on earnings or normal distributions. Additionally, certain types of municipal bonds produce tax-free income and may not have to be reported as income on either your state or federal return – or both.
  • Taxable: A typical Brokerage account is taxable. The dividends, interest, capital gains or capital losses are reported to the taxpayer at the end of each year and you will have to pay tax on any income or realized gains. A withdrawal from this type of account are not a taxable event, because tax is paid on the income each year.

When in retirement, there may be compelling reasons to accelerate or delay tax-deferred distributions or rely on those that are deemed tax-free. Rather than simply withdrawing from only one account type, it may make sense to rely on two or even three of those category-types in later years, depending on personal circumstances.  We generally advise our clients, when appropriate and advantageous, to have and maintain a combination of accounts that are “tax-diversified” to maximize the efficiency of distributions, and the favorable tax treatment given to long-term capital gains, dividends and capital losses.  Certain account types are better suited for gifting to individuals or charities during life, while others can more effectively meet philanthropic goals upon death and avoid income tax.

As with many facets of financial planning, there is rarely an absolute right or wrong method, but rather, a better method for distributions, gifts and asset classes held in certain account types. If you believe you stand to benefit from being more “tax-diversified” with your account types, please contact your Rockbridge advisor for a more detailed discussion of this topic.

We’d like to welcome to the firm our newest investment advisor, Zach DeBottis, as well as our two summer interns, Joel Farella and Hari Nanthakumar.

Zach joined Rockbridge in a new capacity this past June, having worked for Rockbridge as an intern intermittently throughout his senior year of college at SUNY Geneseo. While working as an intern, Zach found a real appreciation for the approach that Rockbridge takes to improve the financial well-being of their clients. Upon nearing graduation, Zach received several job offers from other Syracuse-area firms within the industry, but he realized very quickly that the values instilled within the framework of Rockbridge resonated with his own values the most.

You can learn more about Zach here.

Joel joins us having just completed his first year at St. Lawrence University, where he intends to major in business and environmental studies. His connection to the firm is through his father, Anthony Farella, one of the founding partners. Joel believes this internship is an appropriate fit for him because he has had an interest in finance for a number of years. Aside from his interest in finance, he also believes that the dynamic of working in the Rockbridge office will provide him with valuable skills and experience for all of his future endeavors.

Hari, like Joel, has also just completed his first year at Columbia University as an economics and philosophy major. He heard about Rockbridge through Ed Barno, one of the advisors of our firm. Hari is hoping to take a deep dive into the world of investment management and explore the complex and sometimes difficult financial issues faced by individuals and institutions. Additionally, Hari is excited to learn about how Rockbridge in particular goes about making decisions to better the financial well-being of their clients.

Welcome Zach, Joel, and Hari!


The financial crisis of 2008 put the financial services industry under significant scrutiny. While the biggest headline grabbers were overleveraged investment banks and practices around mortgage origination, retail investment services also underwent additional regulatory oversight. Specifically, Section 913 of the Dodd-Frank Wall Street Reform and Consumer Protection Act directed the Securities and Exchange Commission (SEC) to rule on the obligations, actions, and standards of brokers, dealers, and investment advisers.

The legislation requiring a ruling came about because the sentiment among average Americans is that their interactions with the investment world tended to benefit those working in the investment world more so than themselves. These feelings were not unfounded. In the 80s and 90s, almost all “retail” (individuals purchasing for their own accounts, not part of a larger group) investing happened through brokers and the only fund offerings were high-cost actively managed accounts. Between advisory fees, sales loads, fund fees, trading commissions, and custodial fees, the cost of investing was often in excess of 3%. Read more

Target date funds have become some of the most common investments in America. Not coincidentally, their rise in prevalence has coincided with 401(k)s gaining in popularity. We have seen it here locally; many of the largest employers in Syracuse (Syracuse University, Carrier, Lockheed Martin, General Electric, Welch Allyn, and Niagara Mohawk/National Grid) had pensions. In almost all cases, the pension has been frozen and replaced with a 401(k)s that provides a target date fund (often the default investment when an employee enrolls).

Target date funds are good investments, they achieve two important goals to help satisfy the fiduciary obligation of the 401(k) plan’s advisor:

Diversification: They are generally diversified over thousands of stocks and bonds incorporating multiple asset classes.

Simplification: Target date funds are logistically simple. You only need one holding and it automatically adjusts your allocation from being aggressive when you are young to more conservative as you near retirement.

In most 401(k) plans which have automatic enrollment (73% of plans are now set up for automatic enrollment), target date retirement funds are the default investment. This means without any action taken, you’ll be investing in your 401(k), and it will be through a target date fund based on your age. Generally, you are placed in the target date fund closest to when you’ll turn 65, regardless of whether you plan on retiring at 55 or 75.

It is important to understand not all target date funds are the same, they can vary in allocation and cost.

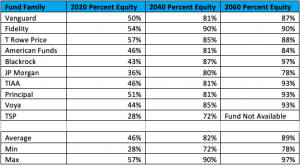
In terms of allocation, the most famous instance of allocation discrepancy was in 2008. During that year, returns on 2010 target date funds (designed for those retiring in two years) varied from -3.5% to -41.3%. Since then, companies managing target date funds have more standardized their allocations, but differences still exist. The following chart shows the stock allocation for different target date funds of various companies or organizations.

The largest disparity is in funds close to retirement. Federal Employees invested in the Thrift Savings Plan (TSP) who have chosen the Lifecycle Funds will have a very heavy allocation towards bonds as they near retirement. However, those who are invested with T. Rowe Price (common for employees at Syracuse University), are close to 60% equities despite being invested in the exact same fund year. In 2008, the TSP’s 2010 fund would have lost about 6% while the allocation held by T. Rowe Price would have dropped 20%. This is not to say the T. Rowe Price allocation is too risky, but rather a reminder that it’s important to understand exactly how your funds are invested.

While not a 30% disparity, we still see decent differences in the allocation of 2040 target date funds. Fidelity comes in most aggressive with a 90% equity allocation – that’s a lot of stock market risk for someone who is 45, especially if they plan on retiring in their 50s.

For 2060 target date funds, we see Blackrock has an effective all equity allocation while JP Morgan inexplicably has a more conservative allocation than their 2040 fund, with 15% in bonds and 7% in money market funds.

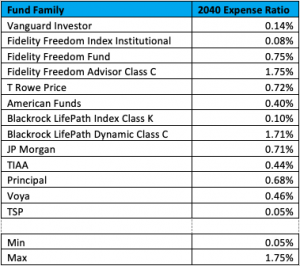
Another discrepancy between target date funds is cost. The following table shows the expense ratios associated with each 2040 target date fund.

The expense ratios of target date funds are confusing if you work in the industry. If you work outside the industry, good luck. Fidelity, the largest custodian of 401(k)s in the country, is a perfect example. The average investor would assume they are in Fidelity’s 2040 Target Date Fund. But Fidelity alone has 21 different 2040 Target Date funds. The expense ratios of these funds range from 0.08% to 1.75% despite more or less doing the same thing. This price complexity comes from two things:

Multiple Series: The largest fund companies have many series for the same type of investment. Fidelity, Blackrock, and Schwab all have actively managed target date funds that charge high fees and low-cost non-active target date funds. Look for the word index as that is usually low-cost.

Different Share Classes: Clients of Rockbridge don’t have to worry about share classes because they are associated with commissions. As fee-only fiduciary advisors, we are prohibited from receiving a commission on a product we recommend, but some 401(k)s will have commission-based investment options. Even among choices that don’t receive a commission, you can have difference expense ratios. Fidelity’s Advisor Freedom series has an “Institutional” share class which costs 0.75%, a “Z” share class which costs 0.65% and a “Z6” share class which costs 0.50%.

We’ve found investors can sometimes get the same exposure as the more expensive target date fund options through the use of low-cost funds within the same 401(k) plan. Saab Sensis, a successful local employer uses a lineup which includes Principal as their target date fund family. These target date funds charge from 0.57% to 0.79% depending on the year. However, they offer lower cost mutual funds which can get the same exposure for around 0.25%, leading to substantial savings for the investor.

Lockheed Martin is similar. Most of their target date fund options cost 0.54%, but you can get the same exposure through individual index funds for 0.08%.

In conclusion, target date funds are generally good investments, but it’s important to know exactly what your getting in terms of allocation and cost. As always, if you have questions or concerns, please contact your advisor at Rockbridge and we can help look through your specific situation as it relates to target date funds or more general financial planning.