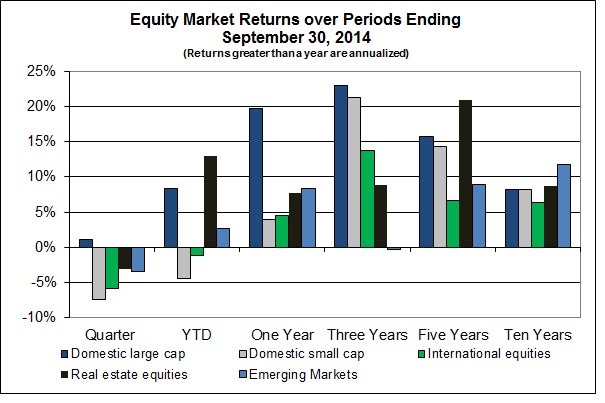
The indices in the chart at right, except for those of domestic large companies , show that stocks in the third quarter gave back some of their recent gains. International stocks and those of domestic small companies were down over 5%; stocks traded in emerging markets and Real Estate Investment Trusts were down by a lesser amount. The results of domestic large company stocks (S&P 500) in recent periods stand out. It is not clear why and may be evidence of short-term irrational behavior. Whenever an investor allocates new funds to stocks for whatever reason, they seem to gravitate towards the S&P 500, which bids up the prices of those stocks and could account for the recent positive results.
Over the past ten years stocks have provided reasonable returns, with a diversified stock portfolio earning an annualized return in the neighborhood of 10%. However, as the chart shows, to achieve that return it was necessary to endure a good deal of variability not only in the total portfolio but also among the individual asset classes. No doubt, this variability is what is in store for the future.
Bond Markets
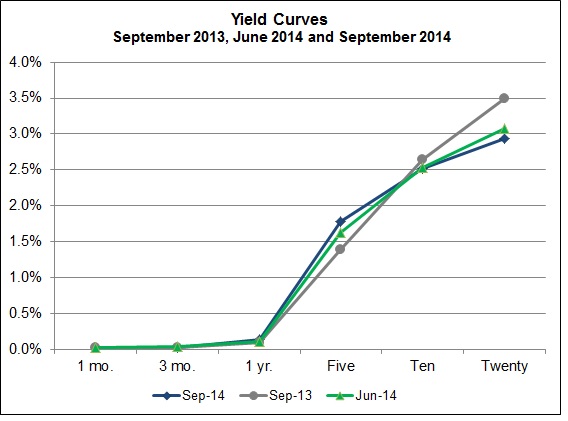
Bond returns reflect changes in yields which, as shown in the chart at right, were 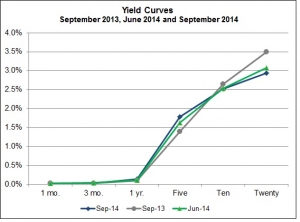 fairly stable over the past quarter and year-to-date periods. Consequently, returns on Treasury securities were relatively flat. Credit spreads (the difference between yield on Treasury securities and the comparable corporate bonds) have narrowed in recent periods, which explain the better returns from corporate bonds.
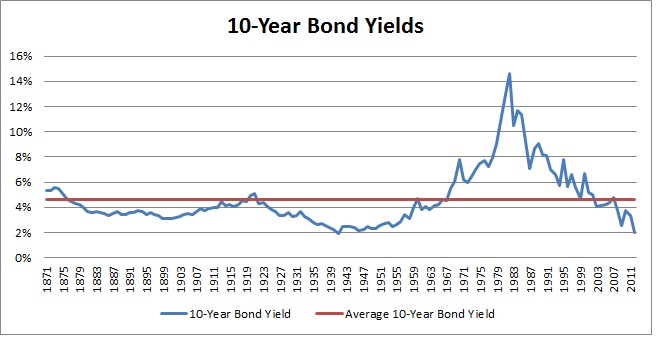
The ten-year yield on inflation protected Treasury securities of 0.6%, while increasing slightly, remains low by historical standards, and has remained so even as the Fed has cut back on its Quantitative Easing program. This minimal response to the Fed’s “tapering” leads some to predict that yields at these levels are a “new normal.” I remain doubtful.
Quantitative Easing and Excess Reserves
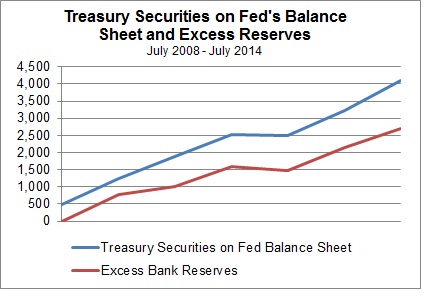
Over the past five years the Fed, through its “Quantitative Easing,” has added to its balance sheet $4.0 trillion (that’s trillion with a “t”) in U.S. Treasury securities. This massive purchase of Treasury securities seems to have had less than the expected impact on either economic activity or inflation. Now, as the Fed is curtailing this program, it might be useful to look at why this is the case.
When the Fed buys a security, it credits banks’ reserves. Reserves provide funds for the bank to lend to consumers, businesses and governments and thereby spur economic activity. Banks have not been making loans with these excess reserves.
In general banks don’t hold excess reserves. Until 2008, the average level of excess reserves was in the neighborhood of $1.3 billion. However, these excess reserves started to climb as the Fed began to  purchase securities. Look at the accompanying chart that shows Treasury securities on the Fed balance sheet and excess bank reserves over the past five years. As the Fed’s holdings climbed from a modest amount in July 2008, excess bank reserves climbed essentially in lockstep. In the past five years the proceeds from the Fed’s purchases have been held by banks as excess reserves. While the Fed can provide funds to loan with the purchase of securities, if there is no demand for loans then the impact on economic activity or inflation may not be what is expected. Essentially, the Fed is “pushing on a string.”
Given the above, the purchase by the Fed of U.S. Treasury securities has, by and large, simply been added to banks’ excess reserves. Therefore, as it begins to sell its current holdings, it seems a good guess that banks will simply use their excess reserves to purchase these securities and the impact from the Fed’s “tapering” will not be a whole lot more significant than when it was making the massive purchases.