If you have children approaching or in college, the end of summer means one thing:  a fall tuition payment!  Fortunately, as New York State residents, there is a little tax break for college expenses.  By contributing to the NYS 529 College Savings Plan, you are able to deduct up to $10,000 for a couple ($5,000 for an individual) on your NYS income tax return.  At approximately a 7% state tax rate, this could save a family $700/year on their state income taxes.

For the families with students currently in college, you are not out of luck.  If you contribute the $10,000 into a NYS 529 Plan, then pay the tuition payment from the 529 Plan, you are also eligible for a tax deduction.  The clearing time will take approximately 2 weeks, so please plan accordingly.  By just adding the one step before the tuition payment, you can also take advantage of this credit.

Finally, if you happen to be a family who is subject to federal estate taxes, a Legacy 529 Plan may be the perfect way to reduce estate taxes and provide a perpetual education fund for your heirs.  We would be happy to discuss this with you individually.

College savings can be an important part of your financial picture, and Rockbridge can help clarify your options.

Stock Markets
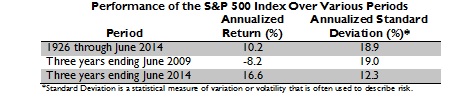
The first chart at right shows returns from various stock market indices over several periods ending June 30, 2014.  Equity markets have rewarded those of us who stayed the course.  Why?  I offer three culprits:

  1. Equity Market Returns over Periods Ending June 30, 2014Surprises associated with an improving economic environment
  2. Lack of return opportunities in bond markets
  3. “Animal Spirits”

These things are interrelated.  The worldwide economy continues to improve, albeit at a sluggish pace, due in some part to the central banks’ efforts to keep interest rates low.  However, these policies result in few opportunities in bond markets.  The third factor, “Animal Spirits,” is a term coined by John Maynard Keynes in his 1936 book “The General Theory of Employment, Interest and Money” to explain emotional confidence and trust in the future.  It is used to explain what makes individuals and corporations undertake long-term capital investments – oftentimes “Animal Spirits” can be a good explanation of the short-term behavior of stock markets.

Bond Markets
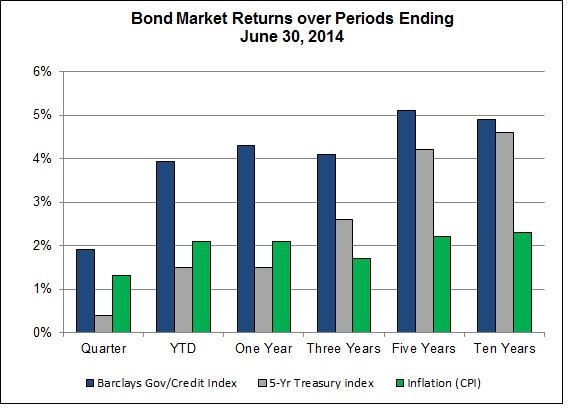
Bond market returns are driven by changes in yields and credit spreads.  Positive (negative) returns follow from declining (increasing) yields and narrowing (widening) credit spreads; the longer the time to maturity, the greater the impact.

Bond Market Returns over Periods Ending June 30, 2014Over the last six months the yield on the ten-year US Treasury security, which is often used as a bellwether for interest rates in general, fell from 3.0% to 2.5%.  At the same time, credit spreads narrowed.  The second chart at right shows inflation (percent change in Consumer Price Index) and bond returns over several periods ending June 30, 2014.  (The Treasury Index reflects only changes in interest rates; the Barclays Government/Credit Index shows the impact of both changing rates and credit spreads.)  Note the extent to which returns from the Barclays Index exceed those of the Treasury Index in recent periods, reflecting narrowing credit spreads.  Also, note that inflation has been rather benign.

The Fed is the primary driver of interest rates.  Yields have declined even as the Fed reduces its purchasing of long-term Treasury securities.  While it is no doubt too early to tell, the impact of the Fed’s backing away from its “Operation Twist” seems to have had little impact on yields so far.  While the Fed has promised to keep short-term interest rates near zero at least over the next year, there is a lot more discussion of the impact of increasing interest rates on economic activity, which may signal the beginning of the end of the Fed’s accommodative monetary policy – we’ll see.

Timing Markets
Strategic asset allocation is critical to investing over the long term – it defines the risk profile of the portfolio and explains most of its return.  Tactical asset allocation means shifting this strategic commitment to asset classes in response to predictions of short-term market behavior.  It’s a euphemism for “market timing.”  Making a shift to avoid a correction is market timing.

Unless there is a specific point at which the funds are needed, market timing requires two decisions – when to get out and when to get back in.  Being right with both is rare.

The market timing data is mixed.  Making the wrong market timing decision can be costly.  For example, buying and holding the S&P 500 since December 31, 1970 results in $1,000 growing to $78,435 by the end of this quarter, but if the best five quarters are missed, then it grows to just $31,195.  Avoiding down markets, on the other hand, can be very rewarding.  If the worst five quarters are missed, then $1,000 becomes $245,558, which helps to explain the appeal of market timing.

Given where we are today, we are interested in whether a period of above-average returns is generally followed by below-average returns and thus signals a potential down market.  To evaluate the extent to which we can use previous five-year returns to provide a meaningful forecast, let’s look at returns from the S&P 500 Index, after inflation (change in CPI), over the 174 quarters (43½ years) since December 31, 1970.  Further, let’s define a good five-year period as one with an average return greater than 15%, and a loss of 10% is the period to be avoided.   The results of this analysis are at right.
Timing Analysis July 2014
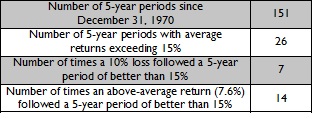
There are not a lot of five-year periods when the average return exceeded 15%.  However, note that a five-year period that averaged above 15% is more apt to be followed by another year of above-average returns than a loss that exceeds 10%.

While the results from avoiding a “down” market are compelling, the cost of missing “up” markets can be substantial.  There is always substantial variability about the future direction of stock markets.  Timing markets successfully requires reducing this variability.  Unfortunately, there is no reason to think past returns will be helpful.  There is simply no reason to conclude that now is the time to engage in tactical asset allocation.

The question of firm strength and continuity has surfaced more and more this year.  Both new and long-time clients are concerned that their financial planning firm will be around for the rest of their lives as well as for their children and grandchildren.  The good news is that over the past few years, Rockbridge has focused on becoming an enduring firm.

Business Model
Rockbridge is set up as a professional ensemble practice to achieve long-term continuity.  We have a multigenerational approach to planning and currently have employees who are in their 20s, 30s, 40s, 50s, and 60s plus.  Using the youth, experience, energy and patience of the different generations allows Rockbridge to truly provide clients financial advice for generations to come.

Processes
We have modified our business processes to provide better service to our clients.  About two years ago, we started involving two advisors in every client meeting.  Having two minds and contacts at the company provides reinforcement to clients that there is always someone available to speak with them.  In addition, two minds are always better than one when it comes to complex financial planning.   Finally, we are beginning to include a dedicated support person for each client to back up the primary and secondary financial advisors.  This trio of personnel should provide the highest level of customer service and personal touch.  We feel this approach sets us apart from the rest of the industry.

Expertise
As Rockbridge grows, we have found a good balance of individual expertise while keeping the feel of a small personal company.  As we grow, we have expanded to include two Certified Financial Planners (CFPs), two Chartered Financial Analysts (CFAs), two MBAs, one Ph.D., and one Certified Public Accountant (CPA).  Outside of individual credentials, each employee continues to build individual expertise, whether it be Investment Management, Financial Planning, Tax Planning, Education Planning, Social Security Analysis or Estate Planning. 

We are constantly looking for new ways to improve our business and provide an even better client experience.   As always, we appreciate any recommendations you have for us.  The highest compliment we can receive is a referral for a job well done.

We have seen high returns and low volatility over the past three years. It feels like the stock market is due for a correction. Over the past three years returns have been much higher than average and volatility has been much lower than average. The chart below compares returns, and the variability in returns, for the S&P 500 over various periods. Annual returns over the past three years, at nearly 17%, are well above the long-term average of about 10%, while variability was only two-thirds of that experienced historically. By way of contrast, the three-year period leading up to June 2009 was a disaster for returns, but volatility was merely average.

Performance of S&P 500 Index Over Various Periods

Different views of the future. When stocks are appropriately valued, it means that the pressure for higher valuations is roughly equal to the downward pressure on prices. Some think the future will bring faster growth in sales and earnings, while others hold an opposing view, but the equilibrium price includes an expectation that investors will earn a return on their capital over the long term.

Let’s consider some offsetting views. It is easy to tick off reasons why markets could, or should, correct. The P/E ratios have risen above historical averages, indicating overvaluation. The economy remains fragile and very dependent on the Federal Reserve. Emerging markets are struggling and growth has slowed in China. Europe and Japan are still struggling to get on their feet, and then we have all the volatile geopolitical issues of the day from Syria and Iraq to Russia and Ukraine, not to mention North Korea, and the turmoil in most of central Africa.

So why are the markets continuing to push the Dow and the S&P 500 indices to new record highs? Well, one thing to keep in mind is that the normal course of economic expansion should result in stock values growing and, therefore, constantly reaching new record highs. As investors, most of us are tainted by the experience of the past two decades, when the technology bubble of the late 1990s inflated stock values so much and so fast that it has taken 15 years to straighten out. Microsoft is a good example of how far out of whack valuations were at the height of the tech bubble. It is trading now at around 15 times earnings, which is near the long-term market average for all stocks. Back in 1999 the price reached a level that was over 80 times earnings. Paying 15 times earnings is more likely to generate an acceptable rate of return.

Other factors contributing to a positive outlook for stocks include the fact that the US economy is growing, with no signs of overheating or significant imbalances. There is a lot of promising new technology on the horizon – think 3-D printers. The energy boom is pushing the US back toward energy independence, which provides a wide variety of related economic and political benefits.

Conclusion – expect lower returns and more volatility. We should expect lower returns than the past five years and more volatility, but a major correction, while always possible, seems no more probable now than at any other time.

Of course, a significant correction is quite likely at some point, but it would represent a bump in the road for long-term investors who can expect market forces to provide adequate risk-adjusted returns over time.