Ready to get started?
If you’re ready to start planning for a brighter financial future, Rockbridge is ready with the advice you need to achieve your goals.
April 14, 2014
All
 In the chart at right, we show returns from several equity market indices for periods ending March 31, 2014. After falling in January and bouncing back in February, domestic equity market returns ended the March quarter slightly positive; returns in the REIT market were especially strong. While exhibiting the same ups and downs as domestic markets, returns in the international developed markets ended the quarter in positive territory as well. Emerging market returns were off just a bit. Except for emerging markets, equity market returns have been strong and generally above long-term averages over the one-, three- and five-year periods. Over the ten-year period returns from all our equity market indices, including emerging markets, are about on track with long-term averages.
I think equity market results over the past few months reflect nervousness about monetary policy by both domestic and international central banks. While the Fed continues to signal essentially no change in its current low interest rate policy, the impact on equity markets of a less accommodative monetary policy, as economies strengthen, is creating some uncertainty in today’s financial markets.
Bond Markets
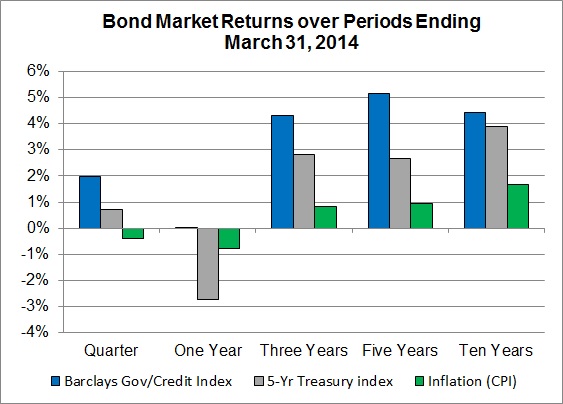 In the second chart at right, we compare returns from bonds that bear just interest-rate risk (5-year Treasury Index), with bonds that bear both interest-rate risk and credit risk (Barclays Gov/Credit Index) and changes in the Consumer Price Index (CPI). Except for the past year, bond returns have been well above the historically subdued level of inflation. While significantly under equity market returns in recent periods, a premium above inflation is consistent with what can be expected from bond investments over the long term.
The impact on bond yields, of both changing interest rates and reducing premiums for bearing credit risk, is what explains recent bond returns. Yields on Treasury securities of longer maturities did tick down a bit in the first quarter but have risen over the past year, which explains the positive returns of the past quarter but negative returns of the past year. Increasing yields have a negative effect on bond returns; the effect of falling yields is positive. Credit spreads (the difference between the yield on U.S. Treasury securities and the yield on corporate bonds) have been narrowing in recent periods more or less mirroring the positive results of equity markets, which explain the return premium from corporate bonds.
The Long Run
Investment decisions must be made with a focus on the long run. Seeking to avoid the impact of short-term variability (“market timing”) never works – don’t try it. However, maintaining a long-run discipline is difficult in the face of the constant noise surrounding market ups and downs. It would be comforting if we knew just how long we have to wait for the long run.
Let’s see if some past history provides any insight. We can define the long run as the period of time over which the actual average return equals what we expected. We can add some numbers. The average return from the S&P 500 after inflation over the past 44 years is 7.6%. By assuming market participants eventually realize what they expect, we can use this number as a proxy for what is expected for taking the risk inherent in the S&P 500. 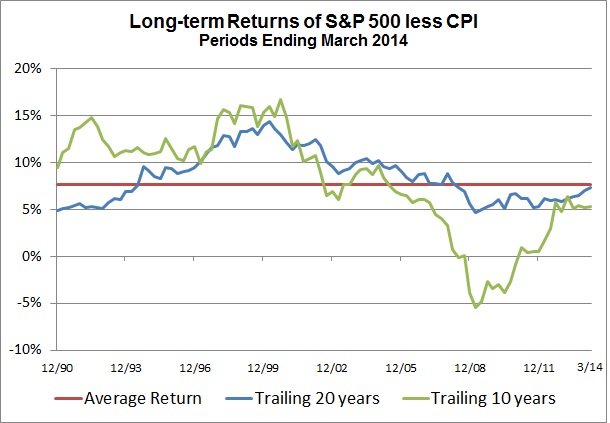 In the chart at right I have tracked average returns from the S&P 500 less inflation over both a trailing 10-year period and a trailing 20-year period to see if over these periods the actual average return is close to 7.6%. Note that there is considerable variability over the 10-year period which is reduced when the period is stretched to 20 years. Yet there is significant variability in the 20-year period as well. Neither 10 years nor 20 years have been long enough for investors to have realized the 44-year average return, which we use as a proxy for expectations.
The primary implication of the data in this chart is the idea that the long run does not lend itself to a specific time period. It shows that just because the average result for a prior 10-year period was negative does not mean this is what can be expected over the next 10 years. Even 20 years is not long enough for average returns to equal what might be expected. Making investment decisions for the long run is based on expectations as well as knowing the variability around those expectations that we will encounter through time. We must avoid the urge to extrapolate any past history into the future, even if those results are for as long as 20 years.
If you’re ready to start planning for a brighter financial future, Rockbridge is ready with the advice you need to achieve your goals.
