More to Savings Bonds Than Just Interest:
Savings bonds are perhaps the best interest-paying savings these days, with the banks paying little or no interest on savings and checking accounts and interest on CDs at an all-time low.  Savings bonds are typically long-term savings.  Several tax clients cashed in their long-term savings bonds in 2013, incurring lots of ordinary income and related tax liability. 

One advantage, besides the better interest rates, is that the interest is not subject to state taxes.  However, all of the interest is subject to federal taxes, and federal tax rates are generally much more than state tax rates.  One big disadvantage is that there is no “step-up” in basis for the one who inherits them.  The “basis” of most other financial assets (stocks, bonds, property), when inherited, is the value at the date of death when calculating gain or loss at the time of sale, and the gain is considered to be “long-term.”  Not so with savings bonds.

Given this fact, it might be advantageous to set up an annual schedule to cash in savings bonds, possibly paying less tax and avoiding the inclusion of this income in the Social Security income calculation.  Most are unaware of this tax treatment, and surprised at the tax on this inherited asset.  This is the kind of thing that should be discussed with your investment advisor when planning on cash flow from your investments or savings.

Do You Know What is in Your Account?:
One tax client had sales of securities to report from two brokers.  The number of stocks sold for 2013 was 159 individual stocks.  She had no idea why there were so many sales and what stocks were actually in her accounts.  One would wonder why an account would have that many individual securities, and we are only talking about those stocks that were sold in 2013.  I didn’t see what was bought because it was not relevant to the tax preparation!

It is not critical that investors know exactly what each investment is, but they must be able to get an explanation from the investment advisor if it is desired.  When this many stocks are bought or sold, I immediately begin to wonder if the transactions are made to benefit the client, or the salesperson.  And good luck doing the capital gains portion of a tax return with this many short- and long-term transactions!!

Take Advantage of Your Investment Advisor:
One client explained that he wanted to file “married filing separately” although he was married the entire year and is still living with his wife.  They were not separated.  I explained that there was a considerable difference in the tax rates for this status, but he told me his wife had already filed this way because she had created a trust and thought they no longer qualified as “married filing jointly”.  Their tax liability filing separately was $10,739.  The tax liability for filing jointly was $8,967.  The creation of a trust has no bearing on the decision on filing status, and a mistake like this can be costly.  The investment advisor, along with the attorney, should be part of any decision to move assets to a trust so these kinds of issues can be discussed.  Rockbridge has a “value proposition” stating “Helping clients make sound financial decisions through a comprehensive client experience.”  We hope clients will include us and use our expertise in their financial decisions.

Required Minimum Distributions (RMDs):
An annual occurrence seems to be a tale of the investment advisor or custodian who doesn’t follow up with the client who should have made a required distribution from his/her IRA account.  In this case, enough was taken from another IRA account to satisfy the minimum, but it was just accidental that it worked out.  One advisor just failed to contact the client to assure the proper distribution be made.  At Rockbridge we pay special attention to assure compliance for our clients.

At the end of a year and at “tax time” it is an ideal time to think about your investments and review your financial situation.  Take advantage of your investment advisor and their expertise in financial areas such as income taxes, retirement planning, investing, Social Security benefits, cash flow needs, and estate planning.  Call us at Rockbridge to discuss your accounts or to become a valued client.

In a recent Wall Street Journal (WSJ) article, the debate over whether to use active or passive investments was addressed. The conclusion was just use both! Let’s take a look at the five reasons they give to defend this neutral stance and see if they hold up to scrutiny. 

1. Use index funds for efficient markets, and active funds for others.

The rationale is that it is hard for active managers to beat the index in efficient markets like the S&P 500, but where they thrive is in less efficient markets like domestic small cap and international stocks.  

This sounds reasonable; however, the facts don’t back it up. According to the 2013 SPIVA study, which ranks active managers against their benchmark, the majority of active managers underperformed passive investments in 21 out of 22 categories over the 5-year period ending 12/31/13. Some conclusions from the study:

  • 79.4% of active managers underperformed large US stocks (S&P 500)
  • 74.8% of active managers underperformed small US stocks (Russell 2000)
  • 71% of active managers underperformed international stocks (EAFE)
  • 80% underperformed the “less-efficient” emerging markets asset class  

Clearly, the evidence suggests that active strategies are no more likely to outperform in less efficient markets. 

2. Keep the door open for beating the market. 

The article says, “Index mutual funds and exchange-traded funds offer a low-cost, tax-efficient way of matching broad market returns—which a large percentage of active managers can’t seem to do.”  However, they say there is an emotional element to investing you have to consider. People want to think they can beat the market and don’t want to settle for benchmark returns.

Well, sometimes I like to think I could play golf professionally, but then reality sets in as I wake up! Look at the stats from above; you are playing a loser’s game if you keep trying to beat the market.

3. Add an active manager to fine-tune the volatility of your portfolio. 

This reason doesn’t make much sense since active managers actually just layer an additional level of risk on your portfolio. An investor already has to deal with the volatility of the markets.  Why add the unknown human risk of an active manager to the equation?   

4. Use a mix of funds to hedge against market crosscurrents.  

Michael Ricca, managing director for Morgan Stanley, says, “Passive and active funds tend to perform better in different environments. It can be better to own an active manager who can scout for attractively valued securities or shift to sectors that might hold up better in a correction.”

I think the writers of this article are missing the point. Active managers have consistently underperformed their passive counterparts in 21 out of 22 asset classes over the last 5 years.  There is no credible evidence that active managers can add value through security selection. 

5. Use an active-passive blend to bring down overall expenses.  

The article says that “Many active funds charge 1% or much more in annual expenses, while index funds may charge as little as 0.05%. Even if you generally favor active funds, you might use a blend to lower your overall portfolio expense ratio to perhaps around 0.5%”.

Alternatively, you could use index or low-cost passively managed funds in all investment asset classes to reduce the cost of your investment portfolio. Remember, the saying “you get what you pay for” does not hold true when it comes to investing.

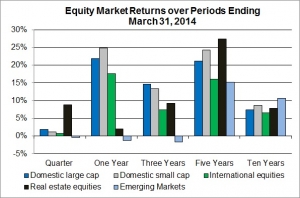
Equity Market Returns over Periods Ending March 31, 2014In the chart at right, we show returns from several equity market indices for periods ending March 31, 2014.  After falling in January and bouncing back in February, domestic equity market returns ended the March quarter slightly positive; returns in the REIT market were especially strong.  While exhibiting the same ups and downs as domestic markets, returns in the international developed markets ended the quarter in positive territory as well.  Emerging market returns were off just a bit.  Except for emerging markets, equity market returns have been strong and generally above long-term averages over the one-, three- and five-year periods.  Over the ten-year period returns from all our equity market indices, including emerging markets, are about on track with long-term averages.  

I think equity market results over the past few months reflect nervousness about monetary policy by both domestic and international central banks.  While the Fed continues to signal essentially no change in its current low interest rate policy, the impact on equity markets of a less accommodative monetary policy, as economies strengthen, is creating some uncertainty in today’s financial markets.

Bond Markets
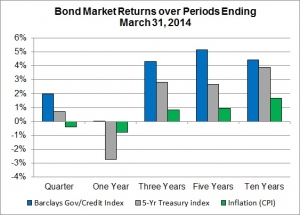
Bond Market Returns over Periods Ending March 31, 2014In the second chart at right, we compare returns from bonds that bear just interest-rate risk (5-year Treasury Index), with bonds that bear both interest-rate risk and credit risk (Barclays Gov/Credit Index) and changes in the Consumer Price Index (CPI).  Except for the past year, bond returns have been well above the historically subdued level of inflation.  While significantly under equity market returns in recent periods, a premium above inflation is consistent with what can be expected from bond investments over the long term.

The impact on bond yields, of both changing interest rates and reducing premiums for bearing credit risk, is what explains recent bond returns.  Yields on Treasury securities of longer maturities did tick down a bit in the first quarter but have risen over the past year, which explains the positive returns of the past quarter but negative returns of the past year.  Increasing yields have a negative effect on bond returns; the effect of falling yields is positive.  Credit spreads (the difference between the yield on U.S. Treasury securities and the yield on corporate bonds) have been narrowing in recent periods more or less mirroring the positive results of equity markets, which explain the return premium from corporate bonds.

The Long Run
Investment decisions must be made with a focus on the long run.  Seeking to avoid the impact of short-term variability (“market timing”) never works – don’t try it.  However, maintaining a long-run discipline is difficult in the face of the constant noise surrounding market ups and downs.  It would be comforting if we knew just how long we have to wait for the long run. 

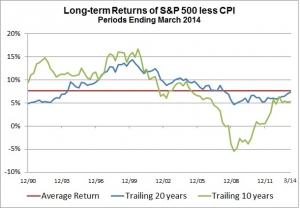
Let’s see if some past history provides any insight.  We can define the long run as the period of time over which the actual average return equals what we expected.  We can add some numbers.  The average return from the S&P 500 after inflation over the past 44 years is 7.6%.  By assuming market participants eventually realize what they expect, we can use this number as a proxy for what is expected for taking the risk inherent in the S&P 500.  Long-term Returns of S&P 500 less CPI Periods Ending March 2014In the chart at right I have tracked average returns from the S&P 500 less inflation over both a trailing 10-year period and a trailing 20-year period to see if over these periods the actual average return is close to 7.6%.  Note that there is considerable variability over the 10-year period which is reduced when the period is stretched to 20 years.  Yet there is significant variability in the 20-year period as well.  Neither 10 years nor 20 years have been long enough for investors to have realized the 44-year average return, which we use as a proxy for expectations.

The primary implication of the data in this chart is the idea that the long run does not lend itself to a specific time period.  It shows that just because the average result for a prior 10-year period was negative does not mean this is what can be expected over the next 10 years.  Even 20 years is not long enough for average returns to equal what might be expected.  Making investment decisions for the long run is based on expectations as well as knowing the variability around those expectations that we will encounter through time.  We must avoid the urge to extrapolate any past history into the future, even if those results are for as long as 20 years.

Does hiring an investment advisor improve your portfolio returns?  This question is often on the minds of our clients or prospective clients.  The value of an advisor is often easier to describe than define numerically.  Many clients find value in hiring an advisor to provide “peace of mind” and comfort that a professional is watching over their portfolio.  This value can be difficult to quantify because it varies by client. 

Value measurement – What is Alpha?
Investors have many tools available to evaluate the performance of portfolio managers.  One such tool is the Jensen Measure, named after its creator, Michael Jensen.  The Jensen Measure calculates the excess return that a portfolio generates over its expected return.  This measure of return is commonly known as Alpha.  Alpha is an elusive quality.  Very simply put, it is the ability to beat an index fund without adding risk to a portfolio. Investment managers are always seeking it but rarely sustain it.

The academic evidence strongly suggests that delivering above-average returns without adding additional risk is extremely difficult or nearly impossible in the long run.  However, most of what we read in the business news or watch on TV is directly aimed at uncovering the elusive manager able to “beat the market” and deliver consistent Alpha to investors.  The fixation on market beating returns has often led to dire results for the average investor. 

About 3%
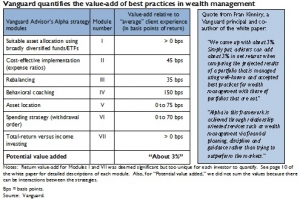
So how does an investor measure the value of an advisor who plans to match market benchmark returns?  It’s a question that Vanguard set out to answer in a recently published paper for investment advisors titled “Putting a value on your value: Quantifying Vanguard Advisor’s Alpha.”  Vanguard explored the idea of advisor Alpha more than a decade ago.  They recognized that the conventional wisdom of advisors providing value by “beating the market” was outdated and disproved by academic evidence.  Interestingly, the areas of best practices for wealth management that Vanguard identifies are identical to the values we have been providing for clients for over 20 years.  They are:

  • Asset allocation
  • Low-cost implementation
  • Rebalancing
  • Discipline and behavioral coaching
  • Asset location
  • Optimal withdrawal strategy
  • Total return vs. income investing

Vanguard quantifies value-add of best practices


Myth – n.  A fiction or half-truth, especially one that forms part of an ideology.  (American Heritage Dictionary)

Dividend paying stocks seem to have attained mythical proportions in recent years as people look for ways to coax income from their investment portfolios.

The idea that dividend paying stocks are somehow superior to other stocks, or an acceptable substitute for low-yielding bonds, is based on many half-truths.

Some say that dividend paying stocks are more conservative and likely to hold their value, so in a down market you can ignore the decline in share price and keep enjoying those dividend payments.  That may be half true, but in 2009, 57% of dividend paying companies, across 23 developed markets, reduced their dividends or eliminated them completely while market values were also tanking.

Dividend paying stocks are still subject to stock market risk, which makes them very different from bonds, and well, just like stocks.  See the table below which compares a high dividend index fund to the S&P 500 index fund and a total bond market index fund.  The first column of numbers shows that the high dividend stocks do indeed pay high dividends, with a current yield even higher than the bond fund. 

The Mythology of Dividend Paying Stocks chartThe second column shows that total returns for stocks (dividends + appreciation = total return) have been far greater than total returns for bonds over recent periods.

So why own bonds instead of high quality, dividend paying stocks?  The answer lies in the last two columns.  In 2008 dividend paying stocks displayed their lower-risk characteristics, losing only 32% compared to the S&P at -37%.  The bond market gained 5% that year, illustrating the fact that bond returns are not correlated with stock returns, and bonds therefore help diversify a portfolio.  The last column shows a measure of risk and illustrates that stocks, even dividend paying stocks, are 3-4 times more volatile than bonds.  One way to think about standard deviation is that two thirds of the time, or two years out of three, we can expect returns to fall in a range that is one standard deviation above or below the average.  So two thirds of the time bond returns will fall in a range of +/- 2.9% while stock returns will vary +/- 12.5%, and a third of time we can expect returns to come in above or below those ranges.

Bonds diversify a stock portfolio because they are less volatile than stocks and they reduce the correlation of returns among portfolio assets.

As the saying goes, diversification is the only free lunch in investing.  Every other potential reward comes with some amount of risk.  We are now five years into a bull market, during which we have seen historically low volatility in stocks.  Despite the euphoria of recent returns, it is important for successful investors to separate fads and myths from the fundamental principles of long-term investing.  Assuming any set of stocks is an acceptable substitute for bonds is likely to lead to unpleasant surprises.  Dividend paying stocks are just another unacceptable substitute.